 🔨 Auction
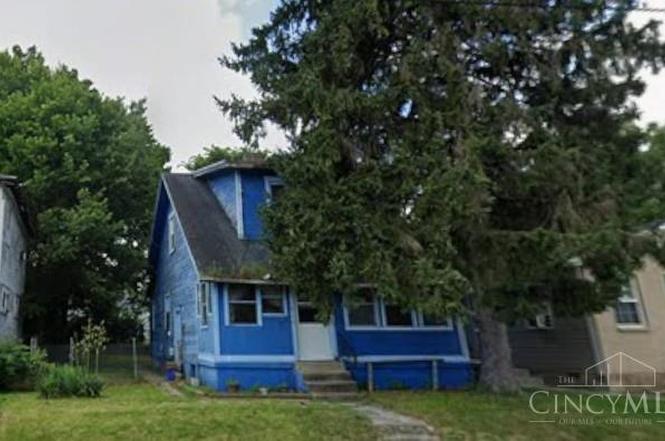
917 Maplehurst Ave · Dayton, OH
Flood risk 1/10 · Minimal
- FEMA flood zone
- X (unshaded)
- Chance of flooding over 30 yrs
- 0.0%
- Est. flood insurance / yr
- $473 – $860
Fire risk 1/10 · Minimal
- Est. fire insurance / yr
- $713 – $1,323
Heat risk 3/10 · Minor
- Hot days now (above 104°F)
- 7 days/yr
- Hot days in 30 yrs
- 19 days/yr
Wind risk 2/10 · Minimal
- Chance of severe wind over 30 yrs
- 0.0%
Air-quality risk 3/10 · Minor
- Unhealthy air days now
- 2 days/yr
- Unhealthy air days in 30 yrs
- 4 days/yr
Risk factors via First Street. Map © Google.
Why this score? — see what drove the C+ grade
The composite is a weighted blend of 9 inputs, each scored 0–100. Each bar is that input's sub-score; the figure is the points it added to the 100-point composite (weight × sub-score).
- Cash flow +28.3/30.0
- DSCR +10.0/10.0
- 1% rule +7.8/10.0
- ARV discount +7.5/15.0
- Rent growth +3.5/5.0
- Livability +3.2/5.0
- Condition / age +2.5/5.0
- Schools +1.3/10.0
- Appreciation +0.0/10.0
$1
🖨 Deal sheet 📄 Offer letter ✓ Due diligence
Listing remarks
Court Ordered Sale by Private Selling Officer. Auction ends on June 24, 2026. All information we have on the property is included. We have no additional information, property condition is unknown. NO SHOWINGS, NO trespassing for any reason. Information is thought to be correct but not guaranteed. 10% Buyer Premium added to the high bid, $5,000 deposit is due within 24 hours of bidding end.
Key facts
- 5,001 sq ft lot
- Built 1924
- Listed 3 days
Property features AI
Finance
- Financial info: Auction listed
- HOA & community: No HOA
Exterior
- Utilities: Public water; Public sewer; Natural gas; Other type of water heating
- Home design: Cape Cod style; Single-family home; One and one half stories
- Construction: Stucco and wood siding exterior; Block foundation
- Exterior features: Shingle roof; Aluminum windows
Interior
- Kitchen: Kitchen approximately 10 x 10; Dining room approximately 9 x 9 (level 1)
- Bedrooms: Three bedrooms total; Primary bedroom approximately 10 x 10 on level 1; Bedroom 2 approximately 10 x 10 on level 2; Bedroom 3 approximately 10 x 10 on level 2; Primary bedroom has additional features
- Bathrooms: One full bathroom; Primary bathroom features a shower; Main/full bath located on level 2
- Heating & cooling: Forced air heating
- Interior features: Six total rooms; Full basement
Neighborhood map
What this means for you Summary
Snapshot
- This is a 3-bed/1.0-bath single-family listed at $1.
Deal economics
- At list price, monthly cash flow is $290 ($3k/yr) — positive.
- The deal already cash-flows at list — no discount required.
- Meets the 1% rule at list price ($1k rent vs $1).
- Cap rate 10.1% vs local median 7.4% in Dayton — top-decile yield for the area; either an underpriced asset or a hidden risk that comps aren't pricing in. Stress-test before assuming the spread holds.
Location & tenants
- Location reads 65/100 on livability (#716 in OH) — a middle-class / working-renter tenant base. Strengths: cost of living A+, housing A+, health & safety A; Watch: schools C-, amenities C-, crime F.
- Dayton City (urban): math 12% / reading 21% proficiency, ranked #641 of 656 in OH (top 98%) — low school quality limits family demand, transient renter base, plan for 1-2y turnover; 74% free/reduced lunch — lower-income household profile, screen leases tightly.
- Market conditions: Rents rising (+4.0%/yr); 83 active listings in the ZIP; 35 comparable units currently listed for rent nearby; rentals at typical pace (median 24d on market — plan ~3-4 weeks tenant-placement turnaround); 43% of comp listings sitting > 30 days — soft ceiling on asking rent; 907 units permitted in Montgomery County in 2024 (416 in 5+ unit buildings).
Forward outlook
- Local home prices are declining (-3.0%/yr); year-one equity from $627 of loan paydown is wiped out by about $3k of value loss. Plan a longer hold.
- Montgomery County population projected at -10% by 2050 — secular population decline; favor cash flow + early exit over multi-decade hold.
- At projected returns (-3.0% appreciation + 4.0% rent growth), your $25k cash investment doubles in ~8 years — after that, you're playing with house money.
Negotiation context
- Only 3 days on market — expect competitive offers; lowballing is unlikely to land.
Risks & watch-outs
- Watch-outs: property tax is 136012.5% of price; built in 1924 — expect roof / HVAC / electrical / plumbing capex.
Questions for the listing agent
- Built in 1924 — when were the roof, HVAC, electrical panel, plumbing, and water heater last replaced?
- Property tax is high relative to price — has the assessment been appealed recently, and will the sale trigger a re-assessment?
- Is there a deadline driving the sale (1031 exchange, divorce, estate, relocation)? That informs how much negotiation room exists.
- Crime grade is F in this area — have there been break-ins, vandalism, or insurance claims at this property in the last 3 years? What carrier currently insures it and at what premium?
- What's the average days-on-market for RENTAL listings here right now (not sales)? A rising rental-DOM trend means longer vacancies and softer asking-rent achievability than the comps imply.
- What's the recent tenant-quality profile in this submarket — average credit score on applications, eviction rate, late-payment / NSF rate, and stable-employment percentage? A property-management company in the area should have these aggregated.
- How much new for-sale + rental construction is in the pipeline within 1–3 miles? Heavy new supply typically softens prices + rents 12–24 months out; constrained supply supports both.
Investment metrics
- 1% rule
- 1.28% ✓
- Cap rate
- 10.14%
- Cash-on-cash
- 13.72%
- DSCR
- 1.61
- GRM
- 6.5
CMA / ARV
- ARV (on-the-fly)
- $90,675
- Comps found
- 12
Show comp detail 12 sales within ~0.75 mi
| Address | Dist | Beds/Ba | Sqft | Sold | Price | $/sf | Match |
|---|---|---|---|---|---|---|---|
| 925 Maplehurst Ave | 0.01mi | 3/1.0 | 864 (-11%) | 0mo | $50,000 | $58 | 80 |
| 924 Kammer Ave | 0.41mi | 2/1.0 (-1) | 1,008 (+3%) | 2mo | $30,000 | $30 | 68 |
| 1812 Haverhill Dr | 0.56mi | 3/1.0 | 933 (-4%) | 1mo | $108,900 | $117 | 66 |
| 1215 Philadelphia Dr | 0.43mi | 3/1.0 | 1,056 (+8%) | 1mo | $108,000 | $102 | 65 |
| 105 Anna St | 0.64mi | 2/1.0 (-1) | 1,008 (+3%) | 1mo | $75,000 | $74 | 58 |
| 550 Brooklyn Ave | 0.36mi | 2/1.0 (-1) | 864 (-11%) | 4mo | $80,000 | $93 | 56 |
| 1200 Wilson Dr | 0.43mi | 3/2.0 | 1,079 (+11%) | 4mo | $125,000 | $116 | 55 |
| 1042 Shakespeare Ave | 0.34mi | 2/1.5 (-1) | 1,100 (+13%) | 3mo | $78,240 | $71 | 54 |
| 1335 Kingsley Ave | 0.71mi | 3/1.0 | 900 (-8%) | 4mo | $94,900 | $105 | 51 |
| 938 Leland Ave | 0.58mi | 2/1.0 (-1) | 844 (-13%) | 0mo | $40,000 | $47 | 45 |
| 1341 Shaftesbury Rd | 0.67mi | 3/2.0 | 1,116 (+14%) | 2mo | $144,900 | $130 | 39 |
| 848 N Upland Ave | 0.68mi | 2/1.0 (-1) | 846 (-13%) | 3mo | $52,000 | $61 | 38 |
Match score weights: distance 35% · size 25% · config 20% · recency 20%. Top-matched comps best support the ARV.
Projected returns pro-forma
-3.0% appreciation · 3.98% rent growth · sell at horizon
- IRR
- 5.0%
- Equity multiple
- 1.20×
- Total profit
- $4,970
- Equity at exit
- $13,520
- IRR
- 15.3%
- Equity multiple
- 2.30×
- Total profit
- $33,046
- Equity at exit
- $7,840
Cash invested: $25,389 (down + closing). Projections, not guarantees.
Landlord ↔ Tenant lean methodology
- Overall (STATE)
- 73 Landlord-Friendly
- State Ohio
- 73 Landlord-Friendly · R+6
- County
- — inherits STATE
- City
- — inherits STATE
ZIP-level market 45402
- Rents YoY
- 4.0%
- Active inventory
- 83
Monthly cashflow live
- Estimated rent
- $1,161 high interval (Pro) →
- Mortgage (P&I)
- −$476
- Tax est. 1.5%
- −$113 /mo · $1,360/yr
- Insurance
- −$38
- HOA
- −$0
- Vacancy / Maint / Mgmt
- −$244
- Net cashflow
- $290
Break-even live
UW: 25.0% down · 7.5% · 30yr · 1.5% tax · 5.0% vac · 8.0% maint · 8.0% mgmt
Financing live
Cash to close
- Down payment
- $22,669
- Closing costs
- $2,720
- Reserves months
- —
- Total cash needed
- —
Loan-product check · same deal, 3 products live
Conventional
25% down · 7.5% · 30yr
- Down + closing
- —
- Monthly P&I
- —
- Monthly cashflow
- —
- DSCR
- —
- Eligible?
- —
Personal DTI + credit; lowest rate.
DSCR
20% down · 8.5% · 30yr
- Down + closing
- —
- Monthly P&I
- —
- Monthly cashflow
- —
- DSCR
- —
- Eligible?
- —
No personal income docs; deal must DSCR.
Hard money
10% down · 12.0% · 12mo
- Down + closing
- —
- Monthly P&I
- —
- Monthly cashflow
- —
- DSCR
- —
- Eligible?
- —
Short-term bridge; refi at stabilization.
Rent comps 35 comps
| Address | Beds | Baths | Sqft | Rent | $/sqft | DOM | Units | Dist |
|---|---|---|---|---|---|---|---|---|
| 725 Maplehurst Ave Dayton, OH | 2.0 | 1.0 | 1104 | $895 | $0.81 | 43d | 1 | 0.05mi |
| 635 Anna St Dayton, OH | 3.0 | 1.0 | 960 | $1,300 | $1.35 | 14d | 1 | 0.20mi |
| 1903 W Grand Ave Unit 4 Dayton, OH | 2.0 | 1.0 | 600 | $850 | $1.42 | 43d | 1 | 0.42mi |
| 920 Huron Ave Dayton, OH | 2.0 | 1.0 | 950 | $995 | $1.05 | 3d | 1 | 0.50mi |
| 828 Walton Ave Unit 832 Walton Dayton, OH | 2.0 | 1.0 | 750 | $795 | $1.06 | 23d | 1 | 0.51mi |
| 41 N Marion St Dayton, OH | 2.0 | 1.0 | 652 | $925 | $1.42 | 3d | 1 | 0.62mi |
| 3222 Athens Ave Unit C Dayton, OH | 2.0 | 1.0 | 700 | $700 | $1.00 | 43d | 1 | 0.64mi |
| 70 Gramont Ave Dayton, OH | 3.0 | 1.5 | 966 | $1,300 | $1.35 | 2d | 1 | 0.67mi |
| 1816 N James H McGee Blvd Apt A Dayton, OH | 3.0 | 1.0 | 950 | $1,200 | $1.26 | 2d | 1 | 0.67mi |
| 1816 N James H McGee Blvd Unit C Dayton, OH | 3.0 | 1.0 | 950 | $1,150 | $1.21 | 2d | 1 | 0.67mi |
| 1816 N James H McGee Blvd Apt B Dayton, OH | 3.0 | 1.0 | 950 | $1,150 | $1.21 | 43d | 1 | 0.67mi |
| 863 N Upland Ave Dayton, OH | 3.0 | 1.0 | 1042 | $1,200 | $1.15 | 43d | 1 | 0.71mi |
| 137 Westwood Ave Dayton, OH | 2.0 | 1.0 | 784 | $900 | $1.15 | 3d | 1 | 0.75mi |
| 3220 Princeton Dr Dayton, OH | 3.0 | 1.0 | 900 | $1,000 | $1.11 | 43d | 1 | 0.76mi |
| 3925 Hoover Ave Dayton, OH | 2.0 | 1.0 | 936 | $1,100 | $1.18 | 2d | 1 | 0.92mi |
| 3007 Cornell Dr Dayton, OH | 2.0 | 1.0 | 827 | $1,000 | $1.21 | 3d | 1 | 0.96mi |
| 3552 Stanford Pl Dayton, OH | 2.0 | 1.0 | 800 | $800 | $1.00 | 23d | 1 | 1.14mi |
| 3552 Stanford Pl Unit 3552 Dayton, OH | 2.0 | 1.0 | 800 | $800 | $1.00 | 43d | 1 | 1.14mi |
| 1067 Salem Ave Dayton, OH | 2.0 | 1.0 | 1100 | $900 | $0.82 | 43d | 1 | 1.25mi |
| 1067 Salem Ave Unit 3 Dayton, OH | 2.0 | 1.5 | 1100 | $900 | $0.82 | 43d | 1 | 1.25mi |
| 1067 Salem Ave Unit 2 Dayton, OH | 2.0 | 1.5 | 1100 | $900 | $0.82 | 43d | 1 | 1.25mi |
| 652 Dennison Ave Dayton, OH | 2.0 | 2.0 | 988 | $1,095 | $1.11 | 21d | 1 | 1.26mi |
| 905 Neal Ave Dayton, OH | 2.0 | 1.0 | 950 | $750 | $0.79 | 23d | 1 | 1.29mi |
| 905 Neal Ave Dayton, OH | 3.0 | 1.0 | 1100 | $850 | $0.77 | 43d | 1 | 1.29mi |
| 673 Randolph St Dayton, OH | 2.0 | 1.0 | 792 | $950 | $1.20 | 43d | 1 | 1.30mi |
| 3652 Otterbein Ave Unit 3652 Dayton, OH | 2.0 | 1.0 | 700 | $800 | $1.14 | 2d | 1 | 1.31mi |
| 3650 Otterbein Ave Unit 3650 Dayton, OH | 2.0 | 1.0 | 900 | $800 | $0.89 | 2d | 1 | 1.31mi |
| 3311 Otterbein Ave Dayton, OH | 3.0 | 1.5 | 1004 | $1,300 | $1.29 | 11d | 1 | 1.34mi |
| 1732 Harold Dr Dayton, OH | 2.0 | 1.0 | 805 | $925 | $1.15 | 43d | 1 | 1.35mi |
| 4109 Midway Ave Dayton, OH | 3.0 | 1.0 | 971 | $1,000 | $1.03 | 3d | 1 | 1.37mi |
| 3537 Otterbein Ave Unit d Dayton, OH | 2.0 | 1.0 | 900 | $925 | $1.03 | 43d | 1 | 1.38mi |
| 119 Edgewood Ave Dayton, OH | 1.0–2.0 | 1.0 | 817 | $999 | $1.22 | 23d | 2 | 1.39mi |
| 2240 Lakeview Ave Dayton, OH | 3.0 | 1.0 | 1056 | $1,025 | $0.97 | 43d | 1 | 1.40mi |
| 848 Riverview Ter Apt 205 Dayton, OH | 2.0 | 1.0 | 1100 | $1,100 | $1.00 | 14d | 1 | 1.46mi |
| 1720 Kings Mill Ct Dayton, OH | 2.0 | 1.5 | 975 | $925 | $0.95 | 23d | 1 | 1.46mi |
Listing history 4 events
-
2026-06-18days on market $1 Active 3 DOM
-
2026-06-17days on market $1 Active 2 DOM
-
2026-06-15remarks 392-char remark
-
2026-06-15$1 Active 1 DOM
ⓘ Source: listings_history table (triggers on properties + properties_extension) + one-shot
backfill from property_details.listing_events for pre-trigger history.
Climate risk First Street
- Flood 1/10 Low FEMA zone X (unshaded) · 0% chance over 30 yrs
- Wildfire 1/10 Low
- Heat 3/10 Moderate 7 d/yr ≥104°F today · 19 d/yr by 30 yrs out
- Wind 2/10 Low 0% chance of damaging wind over 30 yrs
- Air quality 3/10 Moderate 2 unhealthy d/yr today · 4 by 30 yrs out
Nearby sold comps map
Loading sold comps map…
Walkable amenities ~0.75 mi
Loading nearby amenities…
Taxation est. · year 1
- Rental income
- $13,928
- − Mortgage interest
- −$5,079
- − Property taxes
- −$1,360
- − Insurance
- −$453
- − Repairs & maintenance
- −$1,114
- − Management
- −$1,114
- − Depreciation
- −$2,638
- Taxable income
- $2,169
- Est. tax owed @ 24.0%
- −$521
- After-tax cash flow
- $2,963/yr
For passive investors: Depreciation is non-cash, so a rental often shows a tax loss while cash-flowing — sheltering income. Rental losses are passive: they offset passive income freely, and up to $25,000/yr can offset ordinary (W-2) income if you actively participate and your MAGI is under $100k (phasing out to $0 by $150k); unused losses carry forward. On sale, claimed depreciation is recaptured at up to 25%, and gains may owe capital-gains tax (a 1031 exchange can defer both). Figures are a year-1 estimate at your 24.0% rate — not tax advice; consult a CPA.
Schools (NCES district)
- District
- Dayton City
- NCES district ID
- 3904384
- Math proficiency
- 12% ▼ -12.00%
- Reading proficiency
- 21% ▼ -11.00%
- Median HH income
- $28,688
- Composite
- 12.94/100
- National rank
- #9579
- State rank
- #641 of 656 in OH
Livability — Dayton
- Score
- 65/100
- State rank
- #716
- US rank
- #12895
Category grades
Schools grade is shown separately in the Schools card above.
Census & demographics
- Census place
- Dayton, OH
- County
- Montgomery County · 459,541 people
- City population
- 164,387
- Metro
- Dayton-Kettering, OH
- Population (ZIP)
- 9,407
- Household income
- $48,401
- Rent vs Own
- Severe rent burden
- 404.0
Population outlook (Montgomery County) Hauer SSP2
- Today (2025)
- 523,241 people
- By 2030
- 514,948 · -1.6%
- By 2040
- 493,378 · -5.7%
- By 2050
- 469,639 · -10.2%
- By 2075
- 418,360 · -20.0%
- By 2100
- 353,315 · -32.5%
Race, ethnicity, and origin ACS 2023
- Neighborhood character
- Diverse neighborhood (Simpson 0.57)
- Race & ethnicity
- Black 57% White 32% Two or more races 7% Hispanic / Latino 5%
- Hispanic origin (detail)
- Mexican 1%
- Common ancestry
- Italian 2% Serbian 2% Slovak 1%
- Foreign-born
- 5% · Canada, Vietnam, Jamaica
- Languages at home
- 94% English-only · Spanish 4% Other Asian/Pacific 1% Arabic 1%
Political lean MEDSL · Montgomery
- 2024 margin
- Toss-up / Even · D 49.8% · R 49.3%
- 2008→2024 swing
- -5.8pp toward R · 2008: 6.2pp · 2024: 0.5pp
- All cycles
- 2024: D+0.5 2020: D+2.2 2016: R+1.2 2012: D+3.1 2008: D+6.2
Not yet ingested
- Civics
- —
Market trends
- HPI YoY
- ▼ -81.89%
- Current HPI
- 149.7909
- Rent YoY
- ▲ 3.98%
- Metro
- Dayton-Kettering, OH
- State GDP YoY
- ▲ 1.98%
- F500 in state
- 48
Industry mix (Fortune 500 HQ in OH)
| Industry | F500 HQs | Revenue |
|---|---|---|
| Insurance | 3 | $145B |
|
||
| Industrial Machinery | 3 | $49B |
|
||
| Financial Services | 3 | $24B |
|
||
| Consumer Goods | 2 | $93B |
|
||
| Aerospace / Defense | 2 | $47B |
|
||
| Utilities | 2 | $33B |
|
||
Price history
2 events — show timeline
- 2026-06-08 Listed $1 Cincy MLS
- 1989-11-14 Sold (Public Records) $12,800 Public Records
Property tax history
-1.5%/yrLatest (2025): $819 · -0.2% YoY. Source: county tax records.
Cash-flow waterfall
monthlySold comps — $/sqft
last 12 mo · ≤1 miLoading sold comps…