5678 Pearl St · Spencerville, IN
Flood risk 1/10 · Minimal
- FEMA flood zone
- X (unshaded)
- Chance of flooding over 30 yrs
- 0.0%
- Est. flood insurance / yr
- $473 – $860
Fire risk 1/10 · Minimal
- Est. fire insurance / yr
- $717 – $1,331
Heat risk 3/10 · Minor
- Hot days now (above 100°F)
- 7 days/yr
- Hot days in 30 yrs
- 17 days/yr
Wind risk 2/10 · Minimal
- Chance of severe wind over 30 yrs
- —
Air-quality risk 3/10 · Minor
- Unhealthy air days now
- 2 days/yr
- Unhealthy air days in 30 yrs
- 3 days/yr
Risk factors via First Street. Map © Google.
Why this score? — see what drove the C- grade
The composite is a weighted blend of 9 inputs, each scored 0–100. Each bar is that input's sub-score; the figure is the points it added to the 100-point composite (weight × sub-score).
- Cash flow +21.7/30.0
- ARV discount +9.5/15.0
- DSCR +6.9/10.0
- 1% rule +4.4/10.0
- Schools +3.1/10.0
- Rent growth +2.5/5.0
- Livability +2.5/5.0
- Condition / age +2.5/5.0
- Appreciation +0.0/10.0
$199,000
🖨 Deal sheet 📄 Offer letter ✓ Due diligence
Listing remarks MLS
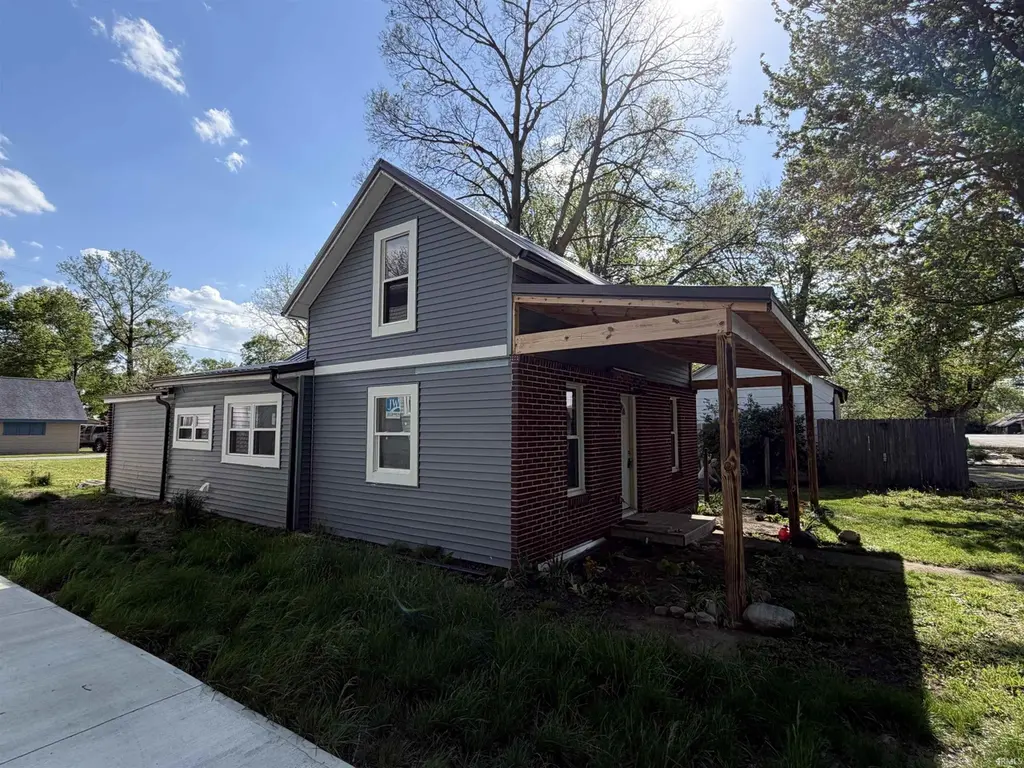
Looking to get out of the hustle and bustle of city living and you are looking for something to put sweat equity in? Are you a contractor and looking for a great project to work on? This one will be great for the Handiman or rehab enthusiast looking to give life back to a home located in a quiet rural area. Location is in Spencerville which is home to the only covered bridge in Dekalb County and only minutes away from the property! This 1-1/2 story home with brick front and vinyl siding has a nice sized lot on a quiet side street with HUGE mature trees. Well water and city sewer, all electric home on a crawl space with 2 bedrooms upstairs and one on main level. Cash only As is where is All items on property to convey to new owner. Mature trees for shade, Spencerville ordinance allows chickens, no HOA, walking distance to town stores.
Key facts
- 8,712 sq ft lot
- Built 1970
- Listed 5 days
Property features AI
Exterior
- Parking: Gravel parking
- Utilities: Private well water; Public sewer
- Home design: Single-family residence (site-built); One-story
- Construction: Brick and vinyl siding construction; Metal roof; Slab foundation; Built as a site-built home
- Exterior features: Front porch; Level, irregular-shaped lot
Interior
- Kitchen: Microwave; Refrigerator; Electric range
- Bedrooms: Master downstairs
- Flooring: Carpet; Vinyl
- Bathrooms: 1 full bathroom (main level)
- Heating & cooling: Electric heating; Baseboard heating; Ceiling fan cooling
- Interior features: Ceiling fans; Eat-in kitchen; Master bedroom on main level; Crawl space basement
- Laundry & utility: Washer; Dryer; Electric dryer hookup (main level); Owned water softener
Neighborhood map
What this means for you Summary
Snapshot
- This is a 3-bed/1.0-bath single-family listed at $199k.
Deal economics
- At list price, monthly cash flow is $305 ($4k/yr) — positive.
- The deal already cash-flows at list — no discount required.
- To meet the 1% rule (rent ≥ 1% of price), the offer needs to be $187k (6.3% below list).
- Recommended offer: $187k (6.3% below list) — sets the bar for 1% rule.
Location & tenants
- Location reads: area grade C — affects rentability + tenant quality, not the cash-flow math above.
- Dekalb County Eastern Community School District (rural): math 33% / reading 38% proficiency, ranked #184 of 301 in IN (top 61%) — families likely to look elsewhere, expect single-tenant / working-renter base with shorter leases.
- Zoned schools: Riverdale Elementary School (math 47% / reading 47%, grade D-, #325 of 994 statewide, top 36%, 293 students, 37% FRL); Eastside Junior-Senior High School (math 34% / reading 44%, grade F, #235 of 369 statewide, top 65%, 585 students, 38% FRL) — zoned schools at 37% FRL track the district average.
- Market conditions: 17 active listings in the ZIP; 116 units permitted in DeKalb County in 2024 (0 in 5+ unit buildings).
Forward outlook
- Local home prices are declining (-3.0%/yr); year-one equity from $1k of loan paydown is wiped out by about $6k of value loss. Plan a longer hold.
- DeKalb County population projected to shrink 9% by 2050 — rents likely to lag national; underwrite the cash flow, not the appreciation.
Negotiation context
- Only 5 days on market — expect competitive offers; lowballing is unlikely to land.
- Current owner paid $45k; list at $199k implies a 342% gain — meaningful room to come down on a strong offer.
Questions for the listing agent
- Built in 1970 — when were the roof, HVAC, electrical panel, plumbing, and water heater last replaced?
- Is there a deadline driving the sale (1031 exchange, divorce, estate, relocation)? That informs how much negotiation room exists.
- What's the average days-on-market for RENTAL listings here right now (not sales)? A rising rental-DOM trend means longer vacancies and softer asking-rent achievability than the comps imply.
- What's the recent tenant-quality profile in this submarket — average credit score on applications, eviction rate, late-payment / NSF rate, and stable-employment percentage? A property-management company in the area should have these aggregated.
- How much new for-sale + rental construction is in the pipeline within 1–3 miles? Heavy new supply typically softens prices + rents 12–24 months out; constrained supply supports both.
Investment metrics
- 1% rule
- 0.94% ✗
- Cap rate
- 8.13%
- Cash-on-cash
- 6.56%
- DSCR
- 1.29
- GRM
- 8.9
CMA / ARV
- ARV (on-the-fly)
- $208,320
- Comps found
- 1
Show comp detail 1 sale within ~0.75 mi
| Address | Dist | Beds/Ba | Sqft | Sold | Price | $/sf | Match |
|---|---|---|---|---|---|---|---|
| 7014 State Road 1 | 0.27mi | 2/1.0 (-1) | 1,152 (-14%) | 6mo | $178,000 | $155 | 54 |
Match score weights: distance 35% · size 25% · config 20% · recency 20%. Top-matched comps best support the ARV.
Projected returns pro-forma
-3.0% appreciation · 3.0% rent growth · sell at horizon
- IRR
- -6.3%
- Equity multiple
- 0.77×
- Total profit
- $-12,943
- Equity at exit
- $29,672
- IRR
- 3.3%
- Equity multiple
- 1.24×
- Total profit
- $13,311
- Equity at exit
- $17,206
Cash invested: $55,720 (down + closing). Projections, not guarantees.
Landlord ↔ Tenant lean methodology
- Overall (STATE)
- 90 Strongly Landlord-Friendly
- State Indiana
- 90 Strongly Landlord-Friendly · R+11
- County
- — inherits STATE
- City
- — inherits STATE
ZIP-level market 46788
- Home prices YoY
- -9.9%
- Active inventory
- 17
- Price-to-rent
- 8.9×
Monthly cashflow live
- Estimated rent
- $1,865 medium interval (Pro) →
- Mortgage (P&I)
- −$1,044
- Tax from tax record
- −$42 /mo · $508/yr
- Insurance
- −$83
- HOA
- −$0
- Vacancy / Maint / Mgmt
- −$392
- Net cashflow
- $305
Break-even live
UW: 25.0% down · 7.5% · 30yr · 1.5% tax · 5.0% vac · 8.0% maint · 8.0% mgmt
Financing live
Cash to close
- Down payment
- $49,750
- Closing costs
- $5,970
- Reserves months
- —
- Total cash needed
- —
Loan-product check · same deal, 3 products live
Conventional
25% down · 7.5% · 30yr
- Down + closing
- —
- Monthly P&I
- —
- Monthly cashflow
- —
- DSCR
- —
- Eligible?
- —
Personal DTI + credit; lowest rate.
DSCR
20% down · 8.5% · 30yr
- Down + closing
- —
- Monthly P&I
- —
- Monthly cashflow
- —
- DSCR
- —
- Eligible?
- —
No personal income docs; deal must DSCR.
Hard money
10% down · 12.0% · 12mo
- Down + closing
- —
- Monthly P&I
- —
- Monthly cashflow
- —
- DSCR
- —
- Eligible?
- —
Short-term bridge; refi at stabilization.
Listing history 12 events
-
2026-06-18days on market $199,000 Active 5 DOM
-
2026-06-17days on market $199,000 Active 4 DOM
-
2026-06-16days on market $199,000 Active 3 DOM
-
2026-06-15pricedays on market $199,000 Active 2 DOM
-
2026-06-13statusdays on market $200,000 Active 1 DOM
-
2026-06-12days on market $200,000 Coming Soon 10 DOM
-
2026-06-09days on market $200,000 Coming Soon 7 DOM
-
2026-06-08days on market $200,000 Coming Soon 6 DOM
-
2026-06-07days on market $200,000 Coming Soon 5 DOM
-
2026-06-07days on market $200,000 Coming Soon 4 DOM
-
2026-06-03remarks 415-char remark
-
2026-06-03$200,000 Coming Soon 1 DOM
ⓘ Source: listings_history table (triggers on properties + properties_extension) + one-shot
backfill from property_details.listing_events for pre-trigger history.
Tax reassessment forecast IN · Partial reset (capped growth)
- Current annual tax
- $508 · $42/mo
- Projected year-2 tax
- $1,100 · $92/mo
- Expected delta
- +$592/yr (+$49/mo · 116.4%)
ⓘ Screening estimate from a state-policy table — verify with the county assessor before closing.
Climate risk First Street
- Flood 1/10 Low FEMA zone X (unshaded) · 0% chance over 30 yrs
- Wildfire 1/10 Low
- Heat 3/10 Moderate 7 d/yr ≥100°F today · 17 d/yr by 30 yrs out
- Wind 2/10 Low
- Air quality 3/10 Moderate 2 unhealthy d/yr today · 3 by 30 yrs out
Nearby sold comps map
Loading sold comps map…
Walkable amenities ~0.75 mi
Loading nearby amenities…
Taxation est. · year 1
- Rental income
- $22,382
- − Mortgage interest
- −$11,147
- − Property taxes
- −$508
- − Insurance
- −$995
- − Repairs & maintenance
- −$1,791
- − Management
- −$1,791
- − Depreciation
- −$5,789
- Taxable income
- $361
- Est. tax owed @ 24.0%
- −$87
- After-tax cash flow
- $3,569/yr
For passive investors: Depreciation is non-cash, so a rental often shows a tax loss while cash-flowing — sheltering income. Rental losses are passive: they offset passive income freely, and up to $25,000/yr can offset ordinary (W-2) income if you actively participate and your MAGI is under $100k (phasing out to $0 by $150k); unused losses carry forward. On sale, claimed depreciation is recaptured at up to 25%, and gains may owe capital-gains tax (a 1031 exchange can defer both). Figures are a year-1 estimate at your 24.0% rate — not tax advice; consult a CPA.
Schools (NCES district)
- District
- Dekalb County Eastern Community School District
- NCES district ID
- 1803060
- Math proficiency
- 33% ▼ -10.00%
- Reading proficiency
- 38% ▼ -10.00%
- Median HH income
- $51,015
- Composite
- 30.84/100
- National rank
- #6132
- State rank
- #184 of 301 in IN
Livability — Spencerville
No livability data for this city. (Only ~50 U.S. cities are tracked.)
Census & demographics
- Census place
- Spencerville, IN
- Population (ZIP)
- 4,372
Population outlook (DeKalb County) Hauer SSP2
- Today (2025)
- 42,875 people
- By 2030
- 42,678 · -0.5%
- By 2040
- 41,494 · -3.2%
- By 2050
- 38,939 · -9.2%
- By 2075
- 31,457 · -26.6%
- By 2100
- 20,780 · -51.5%
Race, ethnicity, and origin ACS 2023
- Neighborhood character
- Predominantly White (94%)
- Race & ethnicity
- White 94% Two or more races 5% Hispanic / Latino 3%
- Common ancestry
- Iranian 3% Lithuanian 1% Romanian 1%
- Foreign-born
- 1% · Canada
- Languages at home
- 82% English-only · German/W. Germanic 18%
Political lean MEDSL · DeKalb
- 2024 margin
- Solid R (+47.1) · D 25.6% · R 72.7% · Other 1.7%
- 2008→2024 swing
- -31.9pp toward R · 2008: -15.2pp · 2024: -47.1pp
- All cycles
- 2024: R+47.1 2020: R+47.2 2016: R+48.2 2012: R+31.7 2008: R+15.2
Not yet ingested
- Civics
- —
Market trends
- HPI YoY
- ▼ -33.80%
- Current HPI
- 308.451
- Rent YoY
- —
- Metro
- —
- State GDP YoY
- ▲ 2.90%
- F500 in state
- 18
Industry mix (Fortune 500 HQ in IN)
| Industry | F500 HQs | Revenue |
|---|---|---|
| Industrial Machinery | 2 | $37B |
|
||
| Healthcare | 1 | $177B |
|
||
| Pharmaceuticals | 1 | $45B |
|
||
| Metals / Steel | 1 | $18B |
|
||
| Agriculture | 1 | $17B |
|
||
| Packaging | 1 | $12B |
|
||
Price history
+263.6% since first listed4 events — show timeline
- 2026-06-02 Coming Soon $200,000 IRMLS
- 2025-05-23 Sold (MLS) $45,000 IRMLS
- 2025-05-16 Pending — IRMLS
- 2025-05-13 Listed $55,000 IRMLS
Property tax history
+14.7%/yrLatest (2024): $508 · +2.6% YoY. Source: county tax records.
Cash-flow waterfall
monthlySold comps — $/sqft
last 12 mo · ≤1 miLoading sold comps…