 🏗️ New Construction
5248 Cobalt Falls Bnd · Aiken, SC
Flood risk No data
- FEMA flood zone
- —
- Chance of flooding over 30 yrs
- —
- Est. flood insurance / yr
- —
Fire risk No data
- Est. fire insurance / yr
- —
Heat risk No data
- Hot days now (above threshold)
- —
- Hot days in 30 yrs
- —
Wind risk No data
- Chance of severe wind over 30 yrs
- —
Air-quality risk No data
- Unhealthy air days now
- —
- Unhealthy air days in 30 yrs
- —
Risk factors via First Street. Map © Google.
Why this score? — see what drove the F grade
The composite is a weighted blend of 9 inputs, each scored 0–100. Each bar is that input's sub-score; the figure is the points it added to the 100-point composite (weight × sub-score).
- ARV discount +7.5/15.0
- Cash flow +7.1/30.0
- Condition / age +4.0/5.0
- Rent growth +3.8/5.0
- Livability +3.4/5.0
- Schools +3.2/10.0
- 1% rule +1.9/10.0
- DSCR +1.3/10.0
- Appreciation +0.0/10.0
$274,990
🖨 Deal sheet 📄 Offer letter ✓ Due diligence
Listing remarks
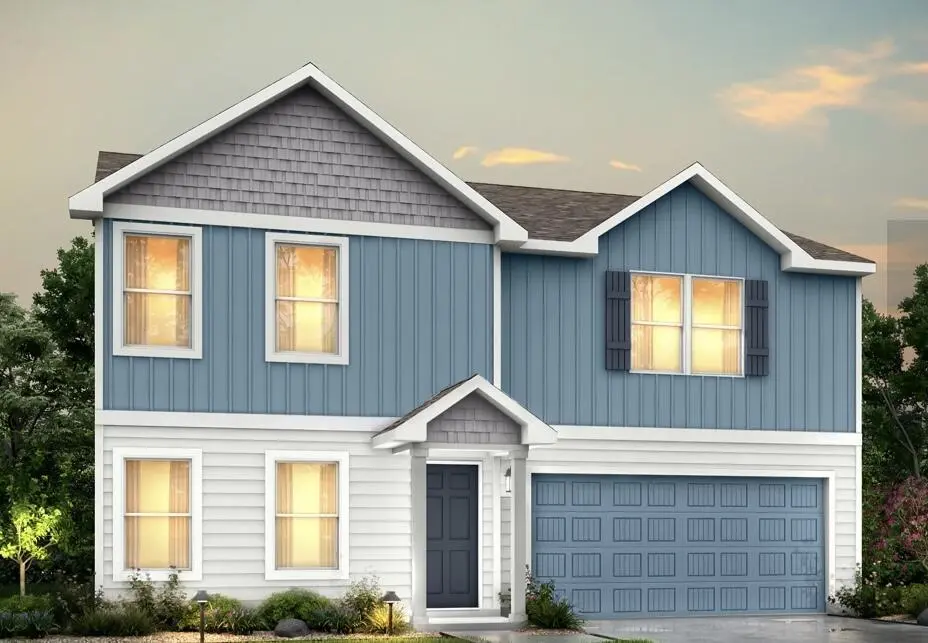
The Jackson Plan from our Liberty Series is where style meets functionality, offering a spacious design perfect for growing households. This 2-story home features 5 bedrooms, 3 bathrooms, a 2-car garage, and 2,600 square feet of thoughtfully crafted living space. As you enter, you'll find a main-level bedroom with a walk-in closet and a full bathroom -- ideal for guests. Continue down the hall to the dining area, which sits perfectly between the well-appointed kitchen and the inviting family room, creating an ideal space for gathering and entertaining. Upstairs, the primary suite is your private retreat, complete with a walk-in closet and an en suite bathroom. The upper level also feat
Key facts
- 8,363 sq ft lot
- 2 garage spots
- Built 2026
Property features AI
Finance
- HOA & community: No community features listed
Exterior
- Parking: Attached garage; 2 garage spaces; Driveway
- Security: Smoke detector(s)
- Utilities: Public water; Public sewer; Electricity available; Sewer available; Water available
- Home design: Single family residence; Two levels; New construction; Residential property
- Construction: Built by National HomeCorp; Frame construction with vinyl siding; Shingle (asphalt) roof; Slab foundation; Home warranty included
- Exterior features: Patio; Level lot; Paved road
Interior
- Kitchen: Dishwasher; Range; Microwave; Disposal; Electric water heater
- Bedrooms: Total of 9 rooms
- Flooring: Carpet
- Bathrooms: 3 full bathrooms
- Heating & cooling: Heat pump heating; Central air conditioning
- Interior features: Kitchen island; Smoke detector(s)
- Laundry & utility: Washer hookup; Electric dryer hookup
Neighborhood map
What this means for you Summary
Snapshot
- This is a 5-bed/3.0-bath single-family listed at $275k. Condition is rated good.
Deal economics
- At list price, monthly cash flow is $-468 ($-6k/yr) — negative.
- To cash-flow at today's rent, offer at most $260k (5.5% below list).
- To meet the 1% rule (rent ≥ 1% of price), the offer needs to be $227k (17.3% below list).
- Recommended offer: $227k (17.3% below list) — sets the bar for 1% rule.
Location & tenants
- Location reads 67/100 on livability (#93 in SC) — a middle-class / working-renter tenant base. Strengths: housing A+, health & safety A+, cost of living A; Watch: crime F, commute F.
- Aiken 01 (suburban): math 31% / reading 44% proficiency, ranked #36 of 80 in SC (top 45%) — families likely to look elsewhere, expect single-tenant / working-renter base with shorter leases.
- Market conditions: Rents rising fast (+5.1%/yr); 521 active listings in the ZIP; 5 comparable units currently listed for rent nearby; rentals at typical pace (median 24d on market — plan ~3-4 weeks tenant-placement turnaround); 2,500 units permitted in Aiken County in 2024 (1,023 in 5+ unit buildings).
- At $2,274/mo this rent would consume 46% of the median local household income ($60k/yr) (locally 1260% of renters already pay >50% of income on rent) — very limited rent-growth headroom before tenants either downsize or default.
Forward outlook
- Local home prices are declining (-3.0%/yr); year-one equity from $2k of loan paydown is wiped out by about $10k of value loss. Plan a longer hold.
- Aiken County population projected at +9% by 2050 — modest demand growth; plan on rents tracking national, not racing it.
Negotiation context
- It's been on market 66 days — a 6% lower offer ($258k) is reasonable based on typical stale-listing flexibility.
Questions for the listing agent
- What do current leases actually rent for vs. the listed asking? Can we see a recent rent roll and the last 12 months of T-12 income?
- It's been on market 66 days. Have you received any prior offers? Is the seller open to a 17% concession, seller financing, or rate buy-down credit?
- Why hasn't it sold? Are there any deal-killer items the seller is aware of (foundation, flood, title, zoning, code violations)?
- Is there a deadline driving the sale (1031 exchange, divorce, estate, relocation)? That informs how much negotiation room exists.
- Schools are B-rated — typically a magnet for longer-tenancy family renters. What's the average tenant stay here, and is there a school-zone premium baked into asking?
- Crime grade is F in this area — have there been break-ins, vandalism, or insurance claims at this property in the last 3 years? What carrier currently insures it and at what premium?
- The area grade is low — what's the realistic commute time and amenity access for the typical tenant pool here? Any planned neighborhood developments (good or bad) we should know about?
- What's the average days-on-market for RENTAL listings here right now (not sales)? A rising rental-DOM trend means longer vacancies and softer asking-rent achievability than the comps imply.
- What's the recent tenant-quality profile in this submarket — average credit score on applications, eviction rate, late-payment / NSF rate, and stable-employment percentage? A property-management company in the area should have these aggregated.
- How much new for-sale + rental construction is in the pipeline within 1–3 miles? Heavy new supply typically softens prices + rents 12–24 months out; constrained supply supports both.
Investment metrics
- 1% rule
- 0.69% ✗
- Cap rate
- 4.58%
- Cash-on-cash
- -6.12%
- DSCR
- 0.73
- GRM
- 12.0
CMA / ARV
- ARV (on-the-fly)
- $327,600
- Comps found
- 12
Show comp detail 12 sales within ~0.75 mi
| Address | Dist | Beds/Ba | Sqft | Sold | Price | $/sf | Match |
|---|---|---|---|---|---|---|---|
| 698 Shumard Oak Pl NW | 0.40mi | 5/2.5 | 2,576 (-1%) | 6mo | $319,900 | $124 | 73 |
| 5938 Cobalt Fls Bnd | 0.20mi | 5/3.0 | 2,334 (-10%) | 7mo | $278,990 | $120 | 68 |
| 7182 Foggy River Dr | 0.27mi | 5/2.5 | 2,459 (-5%) | 12mo | $311,400 | $127 | 66 |
| 7044 Mongolian Oak Dr NW | 0.33mi | 4/2.5 (-1) | 2,574 (-1%) | 13mo | $325,000 | $126 | 65 |
| 438 Narrow Bridge Ct | 0.17mi | 5/2.5 | 2,230 (-14%) | 2mo | $279,900 | $126 | 64 |
| 438 Narrow Bridge Ct | 0.17mi | 5/2.5 | 2,230 (-14%) | 2mo | $279,900 | $126 | 64 |
| 210 NW Shingle Oak Garden Gdn | 0.45mi | 5/3.0 | 2,433 (-6%) | 7mo | $303,968 | $125 | 63 |
| 9178 Wafer Ash Bnd NW | 0.46mi | 4/2.5 (-1) | 2,574 (-1%) | 14mo | $319,779 | $124 | 59 |
| 220 NW Shingle Oak Garden Gdn | 0.46mi | 5/3.0 | 2,273 (-13%) | 1mo | $279,990 | $123 | 56 |
| 9027 Wafer Ash Bnd NW | 0.42mi | 4/2.5 (-1) | 2,341 (-10%) | 14mo | $334,900 | $143 | 46 |
| 9212 Wafer Ash Bnd NW | 0.43mi | 5/3.0 | 2,225 (-14%) | 13mo | $319,900 | $144 | 45 |
| 421 Tasmanian Oak Aly NW | 0.41mi | 5/3.0 | 2,225 (-14%) | 15mo | $322,105 | $145 | 44 |
Match score weights: distance 35% · size 25% · config 20% · recency 20%. Top-matched comps best support the ARV.
Projected returns pro-forma
-3.0% appreciation · 5.06% rent growth · sell at horizon
- IRR
- -24.6%
- Equity multiple
- 0.15×
- Total profit
- $-78,040
- Equity at exit
- $48,846
- IRR
- -15.1%
- Equity multiple
- 0.07×
- Total profit
- $-85,602
- Equity at exit
- $28,325
Cash invested: $91,728 (down + closing). Projections, not guarantees.
Landlord ↔ Tenant lean methodology
- Overall (STATE)
- 90 Strongly Landlord-Friendly
- State South Carolina
- 90 Strongly Landlord-Friendly · R+6
- County
- — inherits STATE
- City
- — inherits STATE
ZIP-level market 29801
- Rents YoY
- 5.1%
- Active inventory
- 521
- Price-to-rent
- 10.1×
Monthly cashflow live
- Estimated rent
- $2,274 high interval (Pro) →
- Mortgage (P&I)
- −$1,718
- Tax est. 1.5%
- −$410 /mo · $4,914/yr
- Insurance
- −$136
- HOA
- −$0
- Vacancy / Maint / Mgmt
- −$477
- Net cashflow
- $-468
Break-even live
UW: 25.0% down · 7.5% · 30yr · 1.5% tax · 5.0% vac · 8.0% maint · 8.0% mgmt
Financing live
Cash to close
- Down payment
- $81,900
- Closing costs
- $9,828
- Reserves months
- —
- Total cash needed
- —
Loan-product check · same deal, 3 products live
Conventional
25% down · 7.5% · 30yr
- Down + closing
- —
- Monthly P&I
- —
- Monthly cashflow
- —
- DSCR
- —
- Eligible?
- —
Personal DTI + credit; lowest rate.
DSCR
20% down · 8.5% · 30yr
- Down + closing
- —
- Monthly P&I
- —
- Monthly cashflow
- —
- DSCR
- —
- Eligible?
- —
No personal income docs; deal must DSCR.
Hard money
10% down · 12.0% · 12mo
- Down + closing
- —
- Monthly P&I
- —
- Monthly cashflow
- —
- DSCR
- —
- Eligible?
- —
Short-term bridge; refi at stabilization.
Rent comps 5 comps
| Address | Beds | Baths | Sqft | Rent | $/sqft | DOM | Units | Dist |
|---|---|---|---|---|---|---|---|---|
| 7034 Foggy River Dr Aiken, SC | 5.0 | 2.0 | 2459 | $2,375 | $0.97 | 23d | 1 | 0.15mi |
| 844 Silent Barge Cv Aiken, SC | 4.0 | 2.5 | 1763 | $1,899 | $1.08 | 23d | 1 | 0.19mi |
| 7113 Foggy River Dr Aiken, SC | 4.0 | 2.5 | 2172 | $2,035 | $0.94 | 23d | 1 | 0.20mi |
| 7259 Foggy River Dr Aiken, SC | 4.0 | 2.0 | 2157 | $2,045 | $0.95 | 14d | 1 | 0.27mi |
| 755 Teague St NW Aiken, SC | 4.0 | 2.0 | 2000 | $2,200 | $1.10 | 14d | 1 | 1.35mi |
Listing history 17 events
-
2026-06-18days on market $274,990 Active 66 DOM
-
2026-06-17pricedays on market $274,990 Active 65 DOM
-
2026-06-16days on market $280,990 Active 64 DOM
-
2026-06-15days on market $280,990 Active 63 DOM
-
2026-06-14days on market $280,990 Active 61 DOM
-
2026-06-13days on market $280,990 Active 60 DOM
-
2026-06-10days on market $280,990 Active 58 DOM
-
2026-06-09days on market $280,990 Active 57 DOM
-
2026-06-08days on market $280,990 Active 56 DOM
-
2026-06-07days on market $280,990 Active 55 DOM
-
2026-06-03days on market $280,990 Active 51 DOM
-
2026-06-02days on market $280,990 Active 50 DOM
-
2026-06-01days on market $280,990 Active 49 DOM
-
2026-05-31days on market $280,990 Active 48 DOM
-
2026-05-30days on market $280,990 Active 47 DOM
-
2026-05-09price $280,990
-
2026-04-13$294,990 Active
ⓘ Source: listings_history table (triggers on properties + properties_extension) + one-shot
backfill from property_details.listing_events for pre-trigger history.
Nearby sold comps map
Loading sold comps map…
Walkable amenities ~0.75 mi
Loading nearby amenities…
Taxation est. · year 1
- Rental income
- $27,283
- − Mortgage interest
- −$18,351
- − Property taxes
- −$4,914
- − Insurance
- −$1,638
- − Repairs & maintenance
- −$2,183
- − Management
- −$2,183
- − Depreciation
- −$9,530
- Taxable loss
- −$11,515
- Est. tax savings @ 24.0%
- +$2,764
- After-tax cash flow
- $-2,851/yr
For passive investors: Depreciation is non-cash, so a rental often shows a tax loss while cash-flowing — sheltering income. Rental losses are passive: they offset passive income freely, and up to $25,000/yr can offset ordinary (W-2) income if you actively participate and your MAGI is under $100k (phasing out to $0 by $150k); unused losses carry forward. On sale, claimed depreciation is recaptured at up to 25%, and gains may owe capital-gains tax (a 1031 exchange can defer both). Figures are a year-1 estimate at your 24.0% rate — not tax advice; consult a CPA.
Condition & rehab AI · 6 photos
This 2-story home in the Liberty Series is in excellent condition with a spacious design and 5 bedrooms. It's move-in ready with minimal updates needed to maximize its value.
Value-add opportunities
- Both Painting exterior siding — Enhances curb appeal and value
- Both Replace carpet with hardwood flooring — Improves aesthetics and increases value
- Both Install smart home technology — Enhances convenience and adds value
Renovation cost estimate screening
Value-add ROI direction
- Both Painting exterior siding — Enhances curb appeal and value ↑
- Both Replace carpet with hardwood flooring — Improves aesthetics and increases value ↑
- Both Install smart home technology — Enhances convenience and adds value ↑
ⓘ Cost ranges are severity-bucket heuristics (US national rule-of-thumb). Get contractor quotes + a written scope before underwriting a rehab budget.
Schools (NCES district)
- District
- Aiken 01
- NCES district ID
- 4500720
- Math proficiency
- 31% ▼ -11.00%
- Reading proficiency
- 44% ▼ -1.00%
- Median HH income
- $45,081
- Composite
- 31.91/100
- National rank
- #5857
- State rank
- #36 of 80 in SC
Livability — Aiken
- Score
- 67/100
- State rank
- #93
- US rank
- #10443
Category grades
Schools grade is shown separately in the Schools card above.
Census & demographics
- County
- Aiken County · 116,534 people
- City population
- 71,807
- Metro
- Augusta-Richmond County, GA-SC
- Population (ZIP)
- 31,108
- Household income
- $59,573
- Rent vs Own
- Severe rent burden
- 1260.0
Population outlook (Aiken County) Hauer SSP2
- Today (2025)
- 178,003 people
- By 2030
- 182,876 · +2.7%
- By 2040
- 189,970 · +6.7%
- By 2050
- 193,840 · +8.9%
- By 2075
- 199,453 · +12.1%
- By 2100
- 192,403 · +8.1%
Race, ethnicity, and origin ACS 2023
- Neighborhood character
- Diverse neighborhood (Simpson 0.57)
- Race & ethnicity
- White 50% Black 42% Hispanic / Latino 5% Two or more races 4% Asian 1%
- Hispanic origin (detail)
- Mexican 1% Puerto Rican 2%
- Common ancestry
- Slovak 2% Italian 1% Serbian 1%
- Foreign-born
- 3% · Canada, Jamaica
- Languages at home
- 95% English-only · Spanish 3% Other Indo-European 1%
Political lean MEDSL · Aiken
- 2024 margin
- Strong R (+25.9) · D 36.4% · R 62.2% · Other 1.4%
- 2008→2024 swing
- -1.9pp toward R · 2008: -24.0pp · 2024: -25.9pp
- All cycles
- 2024: R+25.9 2020: R+22.7 2016: R+27.5 2012: R+26.0 2008: R+24.0
Not yet ingested
- Civics
- —
Market trends
- HPI YoY
- ▼ -278.52%
- Current HPI
- 173.7944
- Rent YoY
- ▲ 5.06%
- Metro
- Augusta-Richmond County, GA-SC
- State GDP YoY
- ▲ 4.51%
- F500 in state
- 2
Industry mix (Fortune 500 HQ in SC)
| Industry | F500 HQs | Revenue |
|---|---|---|
| Packaging | 1 | $7B |
|
||
Price history
-4.7% since first listed2 events — show timeline
- 2026-05-09 Price Changed $280,990 AMLS
- 2026-04-13 Listed $294,990 AMLS
Cash-flow waterfall
monthlySold comps — $/sqft
last 12 mo · ≤1 miLoading sold comps…