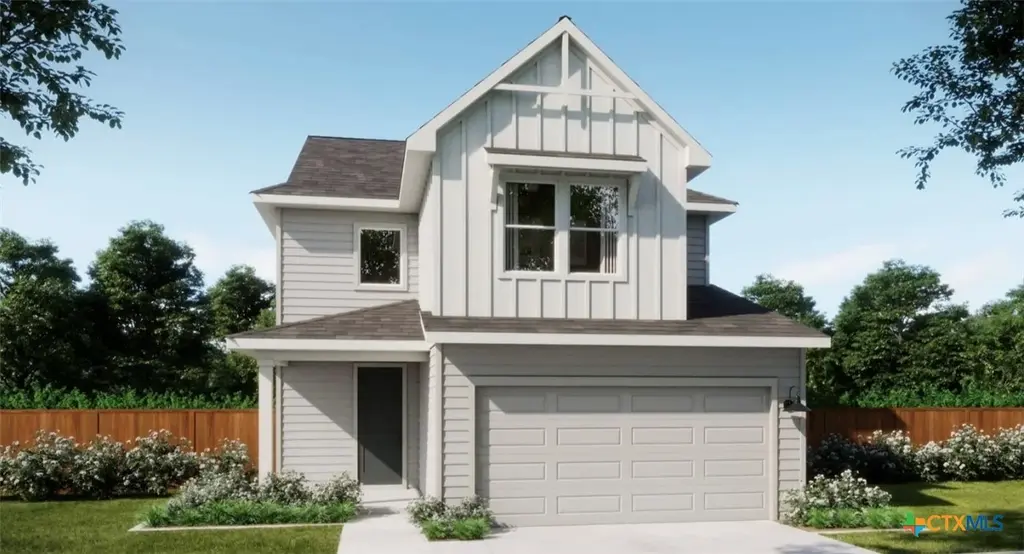
277 Langhorne Bnd · Liberty Hill, TX
Flood risk No data
- FEMA flood zone
- —
- Chance of flooding over 30 yrs
- —
- Est. flood insurance / yr
- —
Fire risk No data
- Est. fire insurance / yr
- —
Heat risk No data
- Hot days now (above threshold)
- —
- Hot days in 30 yrs
- —
Wind risk No data
- Chance of severe wind over 30 yrs
- —
Air-quality risk No data
- Unhealthy air days now
- —
- Unhealthy air days in 30 yrs
- —
Risk factors via First Street. Map © Google.
Why this score? — see what drove the D- grade
The composite is a weighted blend of 9 inputs, each scored 0–100. Each bar is that input's sub-score; the figure is the points it added to the 100-point composite (weight × sub-score).
- ARV discount +10.4/15.0
- Cash flow +10.2/30.0
- Schools +4.4/10.0
- Livability +3.4/5.0
- DSCR +2.9/10.0
- Condition / age +2.5/5.0
- 1% rule +2.3/10.0
- Rent growth +2.0/5.0
- Appreciation +0.0/10.0
$381,990
🖨 Deal sheet 📄 Offer letter ✓ Due diligence
Listing remarks MLS
This gas-equipped home offers a versatile game room/loft that provides flexible space for entertaining or everyday living. . Enjoy outdoor relaxation on the covered patio. Inside, the walk-in closet offers plenty of storage and organization, enhancing the home's thoughtful design. With a comfortable layout and functional features throughout, this home is designed to fit a variety of lifestyles.
Key facts
- 6,751 sq ft lot
- 2 garage spots
- Built 2026
Property features AI
Finance
- HOA & community: Homeowners association with annual fee; HOA fee: $840 annually; Community sidewalks
Exterior
- Parking: Attached garage with 2 spaces
- Security: Smoke detectors
- Utilities: Public water; Public sewer; Electricity available; Cable available; Phone available; Underground utilities
- Home design: 2-story home; Under construction; Built by Risewell Homes; Facing information not provided
- Construction: Brick veneer, HardiPlank, masonry, stone veneer, and steel construction; Composition shingle roof; Slab foundation; Built by builder (year built source: Builder)
- Exterior features: Covered patio; Porch; Covered patio/porch
Interior
- Kitchen: Dishwasher; Electric range; Microwave; Garbage disposal; Vented exhaust fan; Pantry
- Bedrooms: Walk-in closet(s)
- Flooring: Carpet; Vinyl
- Bathrooms: 3 full bathrooms; 1 half bathroom
- Heating & cooling: Central heating (electric); Central air conditioning (electric)
- Interior features: Ceiling fans; Double vanities; Recessed lighting; Smart home features; Kitchen and family room combo; Kitchen and dining combo; Pantry; See remarks (fireplace info referenced in remarks)
- Laundry & utility: Dedicated laundry room; Electric water heater
Neighborhood map
What this means for you Summary
Snapshot
- This is a 4-bed/3.5-bath other listed at $382k.
Deal economics
- At list price, monthly cash flow is $-217 ($-3k/yr) — negative.
- To cash-flow at today's rent, offer at most $344k (10.1% below list).
- To meet the 1% rule (rent ≥ 1% of price), the offer needs to be $280k (26.8% below list).
- Recommended offer: $280k (26.8% below list) — sets the bar for 1% rule.
- Cap rate 5.6% vs local median 2.8% in Liberty Hill — top-decile yield for the area; either an underpriced asset or a hidden risk that comps aren't pricing in. Stress-test before assuming the spread holds.
Location & tenants
- Location reads 68/100 on livability (#495 in TX) — a middle-class / working-renter tenant base. Strengths: cost of living A+, housing A+, crime A; Watch: schools C-, employment D+, amenities F.
- Liberty Hill ISD (rural): math 43% / reading 52% proficiency, ranked #160 of 826 in TX (top 19%) — families likely to look elsewhere, expect single-tenant / working-renter base with shorter leases.
- Market conditions: Rents soft (-1.9%/yr); 1496 active listings in the ZIP; 3 comparable units currently listed for rent nearby; rentals leasing fast (median 11d on market — plan ~1-2 weeks tenant-placement turnaround); high-income renter base; 7,543 units permitted in Williamson County in 2024 (1,425 in 5+ unit buildings).
Forward outlook
- Local home prices are declining (-3.0%/yr); year-one equity from $3k of loan paydown is wiped out by about $11k of value loss. Plan a longer hold.
- Williamson County population projected at +69% by 2050 — long-run rental-demand tailwind backs the buy-and-hold thesis.
Negotiation context
- It's been on market 50 days — a 3% lower offer ($371k) is reasonable based on typical stale-listing flexibility.
- 2 sale attempts with the ask held roughly flat each time — persistent listings suggest the price (not the market) is what's stuck; bring a comps-based counter.
Questions for the listing agent
- What do current leases actually rent for vs. the listed asking? Can we see a recent rent roll and the last 12 months of T-12 income?
- It's been on market 50 days. Have you received any prior offers? Is the seller open to a 27% concession, seller financing, or rate buy-down credit?
- What does the HOA fee cover, when was the last increase, and are there any pending special assessments or reserve-fund shortfalls?
- Is there a deadline driving the sale (1031 exchange, divorce, estate, relocation)? That informs how much negotiation room exists.
- The area grade is low — what's the realistic commute time and amenity access for the typical tenant pool here? Any planned neighborhood developments (good or bad) we should know about?
- What's the average days-on-market for RENTAL listings here right now (not sales)? A rising rental-DOM trend means longer vacancies and softer asking-rent achievability than the comps imply.
- What's the recent tenant-quality profile in this submarket — average credit score on applications, eviction rate, late-payment / NSF rate, and stable-employment percentage? A property-management company in the area should have these aggregated.
- How much new for-sale + rental construction is in the pipeline within 1–3 miles? Heavy new supply typically softens prices + rents 12–24 months out; constrained supply supports both.
Investment metrics
- 1% rule
- 0.73% ✗
- Cap rate
- 5.61%
- Cash-on-cash
- -2.44%
- DSCR
- 0.89
- GRM
- 11.4
CMA / ARV
- ARV (median comp)
- $408,718
- List price
- $381,990
- Delta
- -6.54%
- Verdict
- FAIR
- Comps
- 20 within 1.0 mi
Projected returns pro-forma
-3.0% appreciation · 0.0% rent growth · sell at horizon
- IRR
- -23.5%
- Equity multiple
- 0.21×
- Total profit
- $-84,034
- Equity at exit
- $56,956
- IRR
- -28.1%
- Equity multiple
- -0.15×
- Total profit
- $-123,042
- Equity at exit
- $33,028
Cash invested: $106,957 (down + closing). Projections, not guarantees.
Landlord ↔ Tenant lean methodology
- Overall (STATE)
- 87 Strongly Landlord-Friendly
- State Texas
- 87 Strongly Landlord-Friendly · R+5
- County
- — inherits STATE
- City
- — inherits STATE
ZIP-level market 78642
- Home prices YoY
- -32.4%
- Rents YoY
- -1.9%
- Active inventory
- 1496
- Price-to-rent
- 11.4×
Monthly cashflow live
- Estimated rent
- $2,796 medium interval (Pro) →
- Mortgage (P&I)
- −$2,003
- Tax from tax record
- −$194 /mo · $2,329/yr
- Insurance
- −$159
- HOA
- −$70
- Vacancy / Maint / Mgmt
- −$587
- Net cashflow
- $-217
Break-even live
UW: 25.0% down · 7.5% · 30yr · 1.5% tax · 5.0% vac · 8.0% maint · 8.0% mgmt
Financing live
Cash to close
- Down payment
- $95,498
- Closing costs
- $11,460
- Reserves months
- —
- Total cash needed
- —
Loan-product check · same deal, 3 products live
Conventional
25% down · 7.5% · 30yr
- Down + closing
- —
- Monthly P&I
- —
- Monthly cashflow
- —
- DSCR
- —
- Eligible?
- —
Personal DTI + credit; lowest rate.
DSCR
20% down · 8.5% · 30yr
- Down + closing
- —
- Monthly P&I
- —
- Monthly cashflow
- —
- DSCR
- —
- Eligible?
- —
No personal income docs; deal must DSCR.
Hard money
10% down · 12.0% · 12mo
- Down + closing
- —
- Monthly P&I
- —
- Monthly cashflow
- —
- DSCR
- —
- Eligible?
- —
Short-term bridge; refi at stabilization.
Rent comps 3 comps
| Address | Beds | Baths | Sqft | Rent | $/sqft | DOM | Units | Dist |
|---|---|---|---|---|---|---|---|---|
| 217 McCrae Dr Liberty Hill, TX | 4.0 | 3.5 | 2453 | $2,900 | $1.18 | 11d | 1 | 0.10mi |
| 144 Danielson St Liberty Hill, TX | 3.0 | 2.5 | 1745 | $2,350 | $1.35 | 16d | 1 | 0.11mi |
| 144 Danielson St Liberty Hill, TX | 3.0 | 3.0 | 1745 | $2,350 | $1.35 | 4d | 1 | 0.11mi |
HOA detail
- Monthly dues
- $70 · $840/yr
- Likely covers
- gas
Listing history 14 events
-
2026-06-18days on market $381,990 Active 50 DOM
-
2026-06-17days on market $381,990 Active 49 DOM
-
2026-06-16days on market $381,990 Active 48 DOM
-
2026-06-15days on market $381,990 Active 47 DOM
-
2026-06-13days on market $381,990 Active 45 DOM
-
2026-06-09days on market $381,990 Active 41 DOM
-
2026-06-08days on market $381,990 Active 40 DOM
-
2026-06-07days on market $381,990 Active 39 DOM
-
2026-06-05days on market $381,990 Active 36 DOM
-
2026-06-03days on market $381,990 Active 35 DOM
-
2026-06-02days on market $381,990 Active 34 DOM
-
2026-06-01days on market $381,990 Active 33 DOM
-
2026-05-31days on market $381,990 Active 32 DOM
-
2026-04-29$381,990 Active 401-char remark
ⓘ Source: listings_history table (triggers on properties + properties_extension) + one-shot
backfill from property_details.listing_events for pre-trigger history.
Tax reassessment forecast TX · Resets to sale price
- Current annual tax
- $2,329 · $194/mo
- Projected year-2 tax
- $6,990 · $583/mo
- Expected delta
- +$4,661/yr (+$388/mo · 200.1%)
ⓘ Screening estimate from a state-policy table — verify with the county assessor before closing.
Nearby sold comps map
Loading sold comps map…
Walkable amenities ~0.75 mi
Loading nearby amenities…
Taxation est. · year 1
- Rental income
- $33,554
- − Mortgage interest
- −$21,397
- − Property taxes
- −$2,329
- − Insurance
- −$1,910
- − Repairs & maintenance
- −$2,684
- − Management
- −$2,684
- − HOA
- −$840
- − Depreciation
- −$11,112
- Taxable loss
- −$9,404
- Est. tax savings @ 24.0%
- +$2,257
- After-tax cash flow
- $-353/yr
For passive investors: Depreciation is non-cash, so a rental often shows a tax loss while cash-flowing — sheltering income. Rental losses are passive: they offset passive income freely, and up to $25,000/yr can offset ordinary (W-2) income if you actively participate and your MAGI is under $100k (phasing out to $0 by $150k); unused losses carry forward. On sale, claimed depreciation is recaptured at up to 25%, and gains may owe capital-gains tax (a 1031 exchange can defer both). Figures are a year-1 estimate at your 24.0% rate — not tax advice; consult a CPA.
Schools (NCES district)
- District
- Liberty Hill ISD
- NCES district ID
- 4827420
- Math proficiency
- 43% ▼ -20.00%
- Reading proficiency
- 52% ▼ -11.00%
- Median HH income
- $81,084
- Composite
- 43.65/100
- National rank
- #2965
- State rank
- #160 of 826 in TX
Livability — Liberty Hill
- Score
- 68/100
- State rank
- #495
- US rank
- #9892
Category grades
Schools grade is shown separately in the Schools card above.
Census & demographics
- County
- Williamson County · 680,029 people
- City population
- 26,434
- Metro
- Austin-Round Rock-Georgetown, TX
- Population (ZIP)
- 26,434
- Household income
- $132,958
- Rent vs Own
- Severe rent burden
- 220.0
Population outlook (Williamson County) Hauer SSP2
- Today (2025)
- 699,027 people
- By 2030
- 795,537 · +13.8%
- By 2040
- 990,683 · +41.7%
- By 2050
- 1,184,292 · +69.4%
- By 2075
- 1,623,825 · +132.3%
- By 2100
- 1,924,153 · +175.3%
Race, ethnicity, and origin ACS 2023
- Neighborhood character
- Predominantly White (65%)
- Race & ethnicity
- White 65% Hispanic / Latino 27% Two or more races 14% Asian 2% Black 2%
- Hispanic origin (detail)
- Mexican 25% Puerto Rican 1%
- Common ancestry
- Slovak 3% Romanian 3% Lithuanian 3%
- Foreign-born
- 9% · Canada
- Languages at home
- 81% English-only · Spanish 15% Other Asian/Pacific 1% Tagalog/Filipino 1%
Political lean MEDSL · Williamson
- 2024 margin
- Toss-up / Even · D 48.0% · R 50.4% · Other 1.6%
- 2008→2024 swing
- +10.6pp toward D · 2008: -13.0pp · 2024: -2.5pp
- All cycles
- 2024: R+2.5 2020: D+1.4 2016: R+9.9 2012: R+21.5 2008: R+13.0
Not yet ingested
- Civics
- —
Market trends
- HPI YoY
- ▼ -109.62%
- Current HPI
- 228.5772
- Rent YoY
- ▼ -1.89%
- Metro
- Austin-Round Rock-Georgetown, TX
- State GDP YoY
- ▲ 3.95%
- F500 in state
- 110
Industry mix (Fortune 500 HQ in TX)
| Industry | F500 HQs | Revenue |
|---|---|---|
| Energy | 16 | $1,198B |
|
||
| Technology | 5 | $198B |
|
||
| Engineering / Construction | 4 | $72B |
|
||
| Energy Services | 3 | $60B |
|
||
| Utilities | 3 | $41B |
|
||
| Healthcare | 2 | $330B |
|
||
Price history
+0.0% since first listed2 events — show timeline
- 2026-05-29 Listed $381,990 Zillow
- 2026-04-29 Listed $381,990 CTXMLS
Property tax history
-14.4%/yrLatest (2026): $2,329 · +0.0% YoY. Source: county tax records.
Cash-flow waterfall
monthlySold comps — $/sqft
last 12 mo · ≤1 miLoading sold comps…