 Multi-family
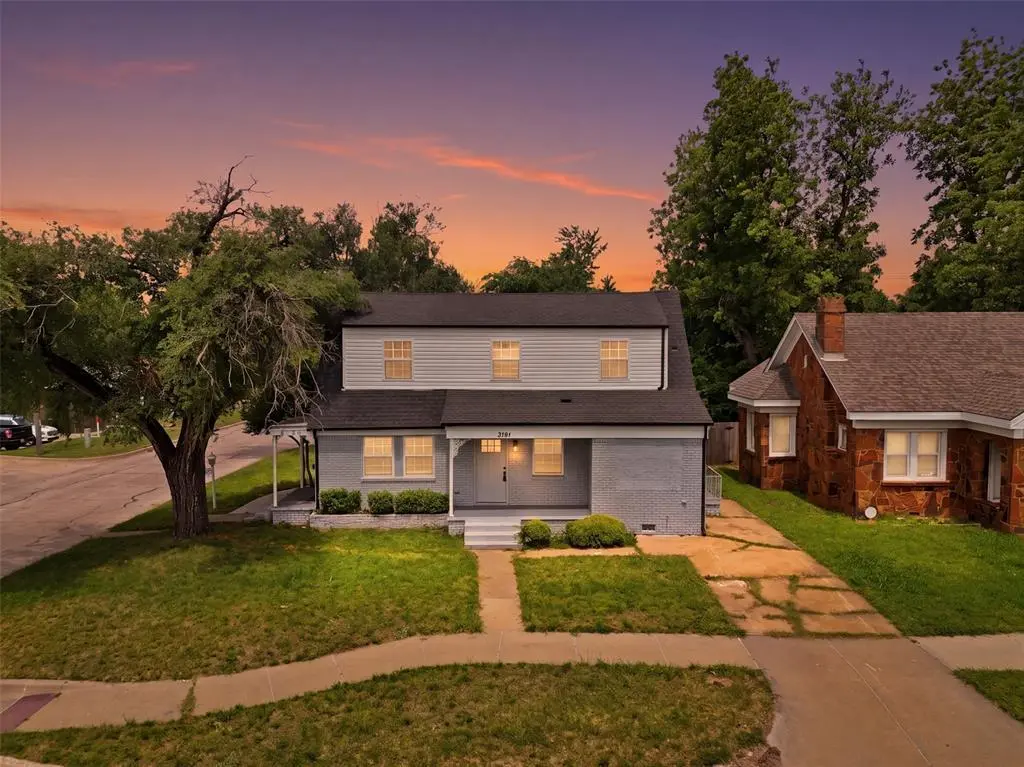
3141 NW 23rd St · Oklahoma City, OK
Flood risk 1/10 · Minimal
- FEMA flood zone
- X (unshaded)
- Chance of flooding over 30 yrs
- 0.0%
- Est. flood insurance / yr
- $507 – $1,088
Fire risk 1/10 · Minimal
- Est. fire insurance / yr
- $2,463 – $4,575
Heat risk 5/10 · Moderate
- Hot days now (above 107°F)
- 7 days/yr
- Hot days in 30 yrs
- 18 days/yr
Wind risk 2/10 · Minimal
- Chance of severe wind over 30 yrs
- 3.0%
Air-quality risk 2/10 · Minimal
- Unhealthy air days now
- 1 days/yr
- Unhealthy air days in 30 yrs
- 2 days/yr
Risk factors via First Street. Map © Google.
Why this score? — see what drove the C+ grade
The composite is a weighted blend of 9 inputs, each scored 0–100. Each bar is that input's sub-score; the figure is the points it added to the 100-point composite (weight × sub-score).
- Cash flow +21.8/30.0
- ARV discount +15.0/15.0
- DSCR +7.0/10.0
- 1% rule +5.1/10.0
- Rent growth +4.3/5.0
- Livability +4.0/5.0
- Condition / age +2.5/5.0
- Schools +0.7/10.0
- Appreciation +0.0/10.0
$220,000
🖨 Deal sheet 📄 Offer letter ✓ Due diligence
Multi-family units
County records classify this as Multi-Family (2-4 Unit). Listing-text estimate: 1 unit. estimate disagrees with records
Listing remarks MLS
This expansive property offers a unique and flexible layout with four bedrooms and three bathrooms, providing generous living space and multiple functional areas. The home features a two-level design with multiple living and dining spaces, allowing for a variety of uses and configurations. Situated on a prominent corner lot, the property includes a detached two-car garage with additional workshop and storage space, adding versatility and practicality. The overall layout offers abundant storage and adaptable interior areas suited for a range of needs. Conveniently located along NW 23rd Street with easy access to major roadways, shopping, dining, and central Oklahoma City destinations, this property combines space, visibility, and long-term potential in an established area.
Key facts
- Two level design
- Additional workshop
- Abundant storage
Tags
Neighborhood map
What this means for you Summary
Snapshot
- This is a 2-bed/3.0-bath multifamily listed at $220k.
Deal economics
- At list price, monthly cash flow is $344 ($4k/yr) — positive.
- The deal already cash-flows at list — no discount required.
- Meets the 1% rule at list price ($2k rent vs $220k).
- Recommended offer: $200k (9.0% below list) — sets the bar for market timing.
- Cap rate 8.2% vs local median 3.7% in Oklahoma City — top-decile yield for the area; either an underpriced asset or a hidden risk that comps aren't pricing in. Stress-test before assuming the spread holds.
Location & tenants
- Location reads 80/100 on livability (#3 in OK, #1,635 nationally) — a professional / high-income tenant draw. Strengths: amenities A+, commute A+, cost of living A+; Watch: schools F, crime F.
- Oklahoma City (urban): math 7% / reading 10% proficiency, ranked #254 of 270 in OK (top 94%) — low school quality limits family demand, transient renter base, plan for 1-2y turnover; 82% free/reduced lunch — lower-income household profile, screen leases tightly.
- Market conditions: Rents rising fast (+7.3%/yr); 216 active listings in the ZIP; 16 comparable units currently listed for rent nearby; rentals at typical pace (median 24d on market — plan ~3-4 weeks tenant-placement turnaround); 5,365 units permitted in Oklahoma County in 2024 (569 in 5+ unit buildings).
- At $2,214/mo this rent would consume 47% of the median local household income ($57k/yr) (locally 1210% of renters already pay >50% of income on rent) — very limited rent-growth headroom before tenants either downsize or default.
Forward outlook
- Local home prices are declining (-3.0%/yr); year-one equity from $2k of loan paydown is wiped out by about $7k of value loss. Plan a longer hold.
- Oklahoma County population projected at +41% by 2050 — long-run rental-demand tailwind backs the buy-and-hold thesis.
- At projected returns (-3.0% appreciation + 7.3% rent growth), your $62k cash investment doubles in ~9 years — after that, you're playing with house money.
Negotiation context
- It's been on market 119 days — a 9% lower offer ($200k) is reasonable based on typical stale-listing flexibility.
- 3 sale attempts since 23y ago with the ask held roughly flat each time — persistent listings suggest the price (not the market) is what's stuck; bring a comps-based counter.
- Current owner paid $140k; list at $220k implies a 57% gain — meaningful room to come down on a strong offer.
Risks & watch-outs
- Watch-outs: built in 1930 — expect roof / HVAC / electrical / plumbing capex.
- Climate carrying-cost: extreme-heat days projected 7→18/yr by 2055 (HVAC capex compounding) — expect insurance premiums to compound above CPI over the hold.
Questions for the listing agent
- It's been on market 119 days. Have you received any prior offers? Is the seller open to a 9% concession, seller financing, or rate buy-down credit?
- Built in 1930 — when were the roof, HVAC, electrical panel, plumbing, and water heater last replaced?
- Why hasn't it sold? Are there any deal-killer items the seller is aware of (foundation, flood, title, zoning, code violations)?
- Is there a deadline driving the sale (1031 exchange, divorce, estate, relocation)? That informs how much negotiation room exists.
- Schools are F-rated, which usually means shorter tenancies and higher turnover. Who's the typical renter profile here, and what's been the actual vacancy rate?
- Crime grade is F in this area — have there been break-ins, vandalism, or insurance claims at this property in the last 3 years? What carrier currently insures it and at what premium?
- What's the average days-on-market for RENTAL listings here right now (not sales)? A rising rental-DOM trend means longer vacancies and softer asking-rent achievability than the comps imply.
- What's the recent tenant-quality profile in this submarket — average credit score on applications, eviction rate, late-payment / NSF rate, and stable-employment percentage? A property-management company in the area should have these aggregated.
- How much new apartment / multifamily construction is in the pipeline within 1–3 miles? Heavy new supply (>2% of stock underway) typically softens rents 12–24 months out; light construction supports rent growth.
Investment metrics
- 1% rule
- 1.01% ✓
- Cap rate
- 8.17%
- Cash-on-cash
- 6.70%
- DSCR
- 1.30
- GRM
- 8.3
CMA / ARV
- ARV (median comp)
- $282,595
- List price
- $220,000
- Delta
- -22.15%
- Verdict
- UNDERPRICED
- Comps
- 20 within 1.0 mi
Projected returns pro-forma
-3.0% appreciation · 7.29% rent growth · sell at horizon
- IRR
- -1.6%
- Equity multiple
- 0.94×
- Total profit
- $-3,826
- Equity at exit
- $32,803
- IRR
- 12.0%
- Equity multiple
- 2.13×
- Total profit
- $69,405
- Equity at exit
- $19,022
Cash invested: $61,600 (down + closing). Projections, not guarantees.
Landlord ↔ Tenant lean methodology
- Overall (STATE)
- 83 Strongly Landlord-Friendly
- State Oklahoma
- 83 Strongly Landlord-Friendly · R+20
- County
- — inherits STATE
- City
- — inherits STATE
ZIP-level market 73107
- Rents YoY
- 7.3%
- Active inventory
- 216
- Price-to-rent
- 16.6×
Monthly cashflow live
- Estimated rent
- $2,214 high interval (Pro) →
- Mortgage (P&I)
- −$1,154
- Tax from tax record
- −$160 /mo · $1,920/yr
- Insurance
- −$92
- HOA
- −$0
- Vacancy / Maint / Mgmt
- −$465
- Net cashflow
- $344
Break-even live
2-unit breakdown (identical units grouped — click to expand)
| Units | Beds | Baths | Est. rent |
|---|---|---|---|
| 1× unit | 2 | 1 | $1,107 |
| 1× unit | 2 | 2 | $1,107 |
| Total (2 units) | $2,214 | ||
UW: 25.0% down · 7.5% · 30yr · 1.5% tax · 5.0% vac · 8.0% maint · 8.0% mgmt
Financing live
Cash to close
- Down payment
- $55,000
- Closing costs
- $6,600
- Reserves months
- —
- Total cash needed
- —
Loan-product check · same deal, 3 products live
Conventional
25% down · 7.5% · 30yr
- Down + closing
- —
- Monthly P&I
- —
- Monthly cashflow
- —
- DSCR
- —
- Eligible?
- —
Personal DTI + credit; lowest rate.
DSCR
20% down · 8.5% · 30yr
- Down + closing
- —
- Monthly P&I
- —
- Monthly cashflow
- —
- DSCR
- —
- Eligible?
- —
No personal income docs; deal must DSCR.
Hard money
10% down · 12.0% · 12mo
- Down + closing
- —
- Monthly P&I
- —
- Monthly cashflow
- —
- DSCR
- —
- Eligible?
- —
Short-term bridge; refi at stabilization.
Rent comps 16 comps
| Address | Beds | Baths | Sqft | Rent | $/sqft | DOM | Units | Dist |
|---|---|---|---|---|---|---|---|---|
| 3145 NW 21st St Oklahoma City, OK | 3.0 | 2.0 | 1728 | $1,600 | $0.93 | 2d | 1 | 0.11mi |
| 2808 NW 24th St Unit A Oklahoma City, OK | 3.0 | 1.5 | 1604 | $1,595 | $0.99 | 3d | 1 | 0.46mi |
| 2736 NW 27th St Oklahoma City, OK | 3.0 | 2.0 | 1657 | $1,895 | $1.14 | 2d | 1 | 0.56mi |
| 1414 N Drexel Blvd Oklahoma City, OK | 2.0 | 1.0 | 1604 | $1,100 | $0.69 | 2d | 1 | 0.65mi |
| 3701 NW 24th St Oklahoma City, OK | 3.0 | 2.0 | 1404 | $1,299 | $0.93 | 44d | 1 | 0.66mi |
| 2928 NW 33rd St Oklahoma City, OK | 3.0 | 2.0 | 1450 | $1,600 | $1.10 | 44d | 1 | 0.79mi |
| 1517 N Miller Blvd Oklahoma City, OK | 3.0 | 2.0 | 1968 | $1,650 | $0.84 | 4d | 1 | 0.82mi |
| 3608 N Independence Ave Oklahoma City, OK | 3.0 | 2.0 | 1597 | $1,600 | $1.00 | 24d | 1 | 0.90mi |
| 4036 NW 30th Ter Oklahoma City, OK | 3.0 | 2.0 | 1675 | $1,500 | $0.90 | 24d | 1 | 1.11mi |
| 2525 NW 11th St Oklahoma City, OK | 3.0 | 2.0 | 1415 | $1,550 | $1.10 | 44d | 1 | 1.15mi |
| 2519 W Park Pl Oklahoma City, OK | 3.0 | 2.0 | 2000 | $1,900 | $0.95 | 44d | 1 | 1.21mi |
| 3407 NW 39th St Oklahoma City, OK | 3.0 | 2.0 | 1400 | $1,240 | $0.89 | 24d | 1 | 1.37mi |
| 2139 NW 15th St Oklahoma City, OK | 3.0 | 2.0 | 1551 | $1,950 | $1.26 | 44d | 1 | 1.37mi |
| 3411 Cameron Ct Oklahoma City, OK | 2.0 | 2.0 | 1409 | $1,300 | $0.92 | 44d | 1 | 1.42mi |
| 3411 Cameron Ct Oklahoma City, OK | 2.0 | 2.0 | 1409 | $1,300 | $0.92 | 24d | 1 | 1.42mi |
| 3633 N Youngs Blvd Oklahoma City, OK | 3.0 | 2.5 | 1404 | $1,450 | $1.03 | 4d | 1 | 1.47mi |
Listing history 9 events
-
2026-05-13status Pending 782-char remark
Show marketing remark (782 chars)
This expansive property offers a unique and flexible layout with four bedrooms and three bathrooms, providing generous living space and multiple functional areas. The home features a two-level design with multiple living and dining spaces, allowing for a variety of uses and configurations. Situated on a prominent corner lot, the property includes a detached two-car garage with additional workshop and storage space, adding versatility and practicality. The overall layout offers abundant storage and adaptable interior areas suited for a range of needs. Conveniently located along NW 23rd Street with easy access to major roadways, shopping, dining, and central Oklahoma City destinations, this property combines space, visibility, and long-term potential in an established area.
-
2026-01-10$220,000 Active 782-char remark
Show marketing remark (782 chars)
This expansive property offers a unique and flexible layout with four bedrooms and three bathrooms, providing generous living space and multiple functional areas. The home features a two-level design with multiple living and dining spaces, allowing for a variety of uses and configurations. Situated on a prominent corner lot, the property includes a detached two-car garage with additional workshop and storage space, adding versatility and practicality. The overall layout offers abundant storage and adaptable interior areas suited for a range of needs. Conveniently located along NW 23rd Street with easy access to major roadways, shopping, dining, and central Oklahoma City destinations, this property combines space, visibility, and long-term potential in an established area.
-
2022-07-20soldstatus $140,000
-
2014-04-07soldstatus $120,000
-
2014-03-31soldstatus $120,000 321-char remark
Show marketing remark (321 chars)
Duplex - on side has 2 bed, 2 fullbaths, office & 2 dining -large living with f/p,hardwood thru-out ,new roof & kit. flooring, lot of storage -other side 1 bed, eatin kitchen - decent size living & bed - full bath -2 closets - 2 car oversized garage & storage bldg, brick fence & patio, with backyard.
-
2013-08-01$139,900 321-char remark
Show marketing remark (321 chars)
Duplex - on side has 2 bed, 2 fullbaths, office & 2 dining -large living with f/p,hardwood thru-out ,new roof & kit. flooring, lot of storage -other side 1 bed, eatin kitchen - decent size living & bed - full bath -2 closets - 2 car oversized garage & storage bldg, brick fence & patio, with backyard.
-
2004-08-11soldstatus $90,000
-
2003-09-30soldstatus $90,000
-
2003-04-28$94,500
ⓘ Source: listings_history table (triggers on properties + properties_extension) + one-shot
backfill from property_details.listing_events for pre-trigger history.
Tax reassessment forecast OK · Resets to sale price
- Current annual tax
- $1,920 · $160/mo
- Projected year-2 tax
- $1,980 · $165/mo
- Expected delta
- +$60/yr (+$5/mo · 3.1%)
ⓘ Screening estimate from a state-policy table — verify with the county assessor before closing.
Climate risk First Street
- Flood 1/10 Low FEMA zone X (unshaded) · 0% chance over 30 yrs
- Wildfire 1/10 Low
- Heat 5/10 Major 7 d/yr ≥107°F today · 18 d/yr by 30 yrs out
- Wind 2/10 Low 3% chance of damaging wind over 30 yrs
- Air quality 2/10 Low 1 unhealthy d/yr today · 2 by 30 yrs out
Nearby sold comps map
Loading sold comps map…
Walkable amenities ~0.75 mi
Loading nearby amenities…
Taxation est. · year 1
- Rental income
- $26,568
- − Mortgage interest
- −$12,323
- − Property taxes
- −$1,920
- − Insurance
- −$1,100
- − Repairs & maintenance
- −$2,125
- − Management
- −$2,125
- − Depreciation
- −$6,400
- Taxable income
- $574
- Est. tax owed @ 24.0%
- −$138
- After-tax cash flow
- $3,987/yr
For passive investors: Depreciation is non-cash, so a rental often shows a tax loss while cash-flowing — sheltering income. Rental losses are passive: they offset passive income freely, and up to $25,000/yr can offset ordinary (W-2) income if you actively participate and your MAGI is under $100k (phasing out to $0 by $150k); unused losses carry forward. On sale, claimed depreciation is recaptured at up to 25%, and gains may owe capital-gains tax (a 1031 exchange can defer both). Figures are a year-1 estimate at your 24.0% rate — not tax advice; consult a CPA.
Schools (NCES district)
- District
- Oklahoma City
- NCES district ID
- 4022770
- Math proficiency
- 7% ▼ -5.00%
- Reading proficiency
- 10% ▼ -6.00%
- Median HH income
- $35,606
- Composite
- 7.0/100
- National rank
- #9970
- State rank
- #254 of 270 in OK
Livability — Oklahoma City
- Score
- 80/100
- State rank
- #3
- US rank
- #1635
Category grades
Schools grade is shown separately in the Schools card above.
Census & demographics
- Census place
- Oklahoma City, OK
- County
- Oklahoma County · 771,644 people
- City population
- 498,656
- Metro
- Oklahoma City, OK
- Population (ZIP)
- 25,791
- Household income
- $56,873
- Rent vs Own
- Severe rent burden
- 1210.0
Population outlook (Oklahoma County) Hauer SSP2
- Today (2025)
- 911,875 people
- By 2030
- 982,413 · +7.7%
- By 2040
- 1,130,468 · +24.0%
- By 2050
- 1,288,422 · +41.3%
- By 2075
- 1,711,482 · +87.7%
- By 2100
- 2,088,448 · +129.0%
Race, ethnicity, and origin ACS 2023
- Neighborhood character
- Diverse neighborhood (Simpson 0.64)
- Race & ethnicity
- White 47% Hispanic / Latino 37% Two or more races 13% Native American 6% Black 5% Asian 2%
- Hispanic origin (detail)
- Mexican 22%
- Common ancestry
- Lithuanian 1% Italian 1% Slovak 1%
- Foreign-born
- 19% · Canada, Vietnam
- Languages at home
- 67% English-only · Spanish 30% Vietnamese 1%
Political lean MEDSL · Oklahoma
- 2024 margin
- Toss-up / Even · D 48.0% · R 49.7% · Other 2.3%
- 2008→2024 swing
- +15.1pp toward D · 2008: -16.8pp · 2024: -1.7pp
- All cycles
- 2024: R+1.7 2020: R+1.1 2016: R+10.5 2012: R+16.7 2008: R+16.8
Not yet ingested
- Civics
- —
Market trends
- HPI YoY
- ▼ -245.03%
- Current HPI
- 274.7844
- Rent YoY
- ▲ 7.29%
- Metro
- Oklahoma City, OK
- State GDP YoY
- ▲ 1.55%
- F500 in state
- 6
Industry mix (Fortune 500 HQ in OK)
| Industry | F500 HQs | Revenue |
|---|---|---|
| Energy | 3 | $48B |
|
||
Price history
+132.8% since first listed9 events — show timeline
- 2026-05-13 Pending — MLSOK
- 2026-01-10 Listed $220,000 MLSOK
- 2022-07-20 Sold (Public Records) $140,000 Public Records
- 2014-04-07 Sold (Public Records) $120,000 Public Records
- 2014-03-31 Sold (MLS) $120,000 MLSOK
- 2013-08-01 Listed $139,900 MLSOK
- 2004-08-11 Sold (MLS) $90,000 MLSOK
- 2003-09-30 Sold (Public Records) $90,000 Public Records
- 2003-04-28 Listed $94,500 MLSOK
Property tax history
+1.4%/yrLatest (2025): $1,920 · -1.1% YoY. Source: county tax records.
Cash-flow waterfall
monthlySold comps — $/sqft
last 12 mo · ≤1 miLoading sold comps…