82 NE 15th Ter · Jensen Beach, FL
Flood risk 5/10 · Moderate
- FEMA flood zone
- X (unshaded)
- Chance of flooding over 30 yrs
- 0.48%
- Est. flood insurance / yr
- $507 – $1,088
Fire risk 2/10 · Minimal
- Est. fire insurance / yr
- $947 – $1,759
Heat risk 10/10 · Severe
- Hot days now (above 106°F)
- 7 days/yr
- Hot days in 30 yrs
- 22 days/yr
Wind risk 10/10 · Severe
- Chance of severe wind over 30 yrs
- 99.0%
Air-quality risk 2/10 · Minimal
- Unhealthy air days now
- 1 days/yr
- Unhealthy air days in 30 yrs
- 1 days/yr
Risk factors via First Street. Map © Google.
Why this score? — see what drove the C+ grade
The composite is a weighted blend of 9 inputs, each scored 0–100. Each bar is that input's sub-score; the figure is the points it added to the 100-point composite (weight × sub-score).
- Cash flow +27.1/30.0
- DSCR +9.4/10.0
- ARV discount +7.5/15.0
- 1% rule +6.7/10.0
- Schools +4.5/10.0
- Livability +3.5/5.0
- Condition / age +2.5/5.0
- Rent growth +2.3/5.0
- Appreciation +0.0/10.0
$149,900
🖨 Deal sheet 📄 Offer letter ✓ Due diligence
Listing remarks MLS
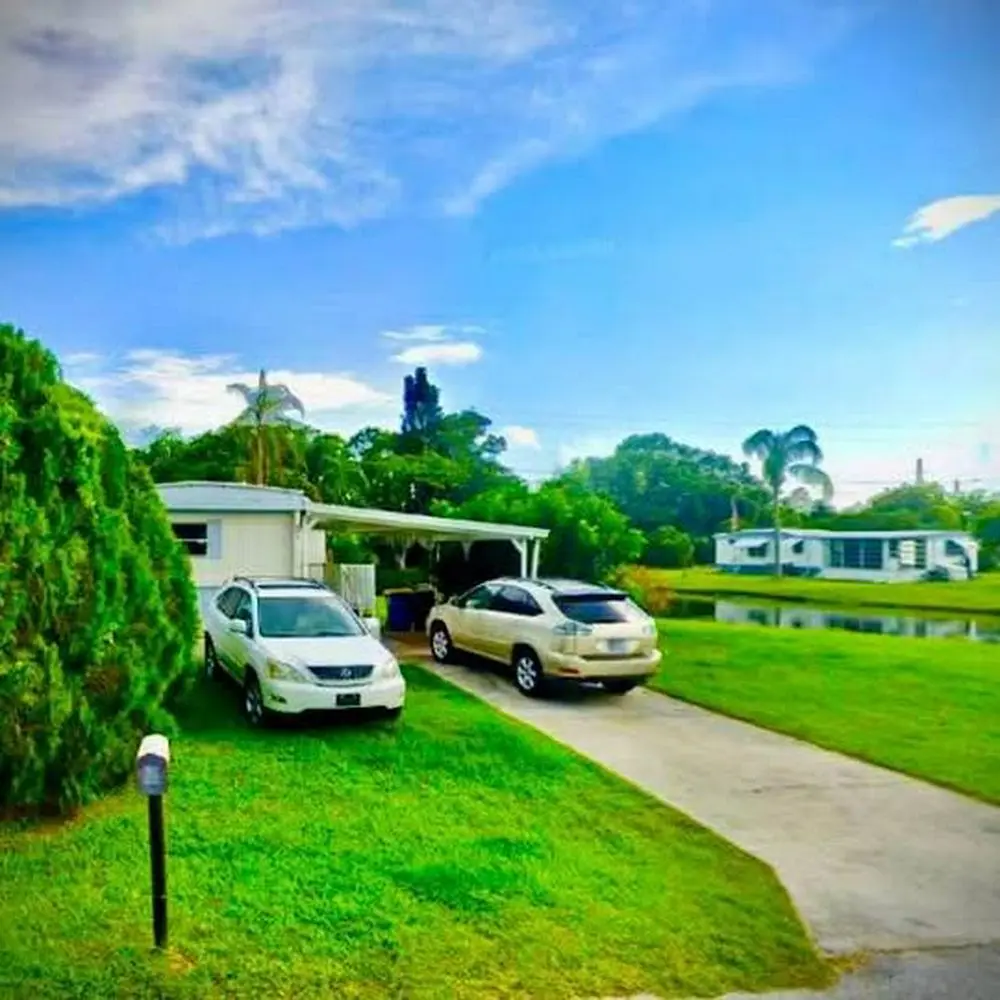
Waterfront 3br 1 bath Mobile Home
Key facts
- 0.26 acre lot
- Built 1970
- Listed 207 days
Neighborhood map
What this means for you Summary
Snapshot
- This is a 1-bed/1.0-bath manufactured listed at $150k.
Deal economics
- At list price, monthly cash flow is $423 ($5k/yr) — positive.
- The deal already cash-flows at list — no discount required.
- Meets the 1% rule at list price ($2k rent vs $150k).
- Recommended offer: $132k (12.0% below list) — sets the bar for market timing.
- Cap rate 9.7% vs local median 4.1% in Jensen Beach — top-decile yield for the area; either an underpriced asset or a hidden risk that comps aren't pricing in. Stress-test before assuming the spread holds.
Location & tenants
- Location reads 70/100 on livability (#432 in FL) — a middle-class / working-renter tenant base. Strengths: crime A+, housing A+, cost of living B+; Watch: amenities F, commute F, health & safety D-.
- Martin (suburban): math 52% / reading 53% proficiency, ranked #24 of 73 in FL (top 33%) — acceptable for families but not a draw, mixed tenant base, ~2y average lease.
- Market conditions: Rents soft (-0.7%/yr); 256 active listings in the ZIP; 9 comparable units currently listed for rent nearby; rentals at typical pace (median 14d on market — plan ~3-4 weeks tenant-placement turnaround); 737 units permitted in Martin County in 2024 (167 in 5+ unit buildings).
- This rent runs 34% of the median local income ($63k/yr) — at the standard rent-burdened threshold; future hikes will face affordability resistance.
Forward outlook
- Local home prices are declining (-3.0%/yr); year-one equity from $1k of loan paydown is wiped out by about $4k of value loss. Plan a longer hold.
- Martin County population projected at +19% by 2050 — long-run rental-demand tailwind backs the buy-and-hold thesis.
Negotiation context
- It's been on market 207 days — a 12% lower offer ($132k) is reasonable based on typical stale-listing flexibility.
- 3 sale attempts since 4y ago with the ask held roughly flat each time — persistent listings suggest the price (not the market) is what's stuck; bring a comps-based counter.
- Current owner paid $105k; 43% above their basis — modest negotiation headroom, anchor on the comps not their cost.
Risks & watch-outs
- Climate carrying-cost: moderate flood risk; severe wind risk, 99% chance of damaging wind over 30y; extreme-heat days projected 7→22/yr by 2055 (HVAC capex compounding) — expect insurance premiums to compound above CPI over the hold.
Questions for the listing agent
- It's been on market 207 days. Have you received any prior offers? Is the seller open to a 12% concession, seller financing, or rate buy-down credit?
- Built in 1970 — when were the roof, HVAC, electrical panel, plumbing, and water heater last replaced?
- Why hasn't it sold? Are there any deal-killer items the seller is aware of (foundation, flood, title, zoning, code violations)?
- Is there a deadline driving the sale (1031 exchange, divorce, estate, relocation)? That informs how much negotiation room exists.
- Schools are B-rated — typically a magnet for longer-tenancy family renters. What's the average tenant stay here, and is there a school-zone premium baked into asking?
- What's the average days-on-market for RENTAL listings here right now (not sales)? A rising rental-DOM trend means longer vacancies and softer asking-rent achievability than the comps imply.
- What's the recent tenant-quality profile in this submarket — average credit score on applications, eviction rate, late-payment / NSF rate, and stable-employment percentage? A property-management company in the area should have these aggregated.
- How much new for-sale + rental construction is in the pipeline within 1–3 miles? Heavy new supply typically softens prices + rents 12–24 months out; constrained supply supports both.
Investment metrics
- 1% rule
- 1.17% ✓
- Cap rate
- 9.68%
- Cash-on-cash
- 12.09%
- DSCR
- 1.54
- GRM
- 7.1
CMA / ARV
- ARV (median comp)
- $300,655
- List price
- $149,900
- Delta
- -50.14%
- Verdict
- UNDERPRICED
- Comps
- 5 within 1.0 mi
Projected returns pro-forma
-3.0% appreciation · 0.0% rent growth · sell at horizon
- IRR
- -1.6%
- Equity multiple
- 0.94×
- Total profit
- $-2,519
- Equity at exit
- $22,351
- IRR
- 4.7%
- Equity multiple
- 1.30×
- Total profit
- $12,516
- Equity at exit
- $12,961
Cash invested: $41,972 (down + closing). Projections, not guarantees.
Landlord ↔ Tenant lean methodology
- Overall (STATE)
- 87 Strongly Landlord-Friendly
- State Florida
- 87 Strongly Landlord-Friendly · R+3
- County
- — inherits STATE
- City
- — inherits STATE
ZIP-level market 34994
- Home prices YoY
- -27.1%
- Rents YoY
- -0.7%
- Active inventory
- 256
- Price-to-rent
- 7.1×
Monthly cashflow live
- Estimated rent
- $1,758 high interval (Pro) →
- Mortgage (P&I)
- −$786
- Tax from tax record
- −$118 /mo · $1,411/yr
- Insurance
- −$62
- HOA
- −$0
- Vacancy / Maint / Mgmt
- −$369
- Net cashflow
- $423
Break-even live
UW: 25.0% down · 7.5% · 30yr · 1.5% tax · 5.0% vac · 8.0% maint · 8.0% mgmt
Financing live
Cash to close
- Down payment
- $37,475
- Closing costs
- $4,497
- Reserves months
- —
- Total cash needed
- —
Loan-product check · same deal, 3 products live
Conventional
25% down · 7.5% · 30yr
- Down + closing
- —
- Monthly P&I
- —
- Monthly cashflow
- —
- DSCR
- —
- Eligible?
- —
Personal DTI + credit; lowest rate.
DSCR
20% down · 8.5% · 30yr
- Down + closing
- —
- Monthly P&I
- —
- Monthly cashflow
- —
- DSCR
- —
- Eligible?
- —
No personal income docs; deal must DSCR.
Hard money
10% down · 12.0% · 12mo
- Down + closing
- —
- Monthly P&I
- —
- Monthly cashflow
- —
- DSCR
- —
- Eligible?
- —
Short-term bridge; refi at stabilization.
Rent comps 9 comps
| Address | Beds | Baths | Sqft | Rent | $/sqft | DOM | Units | Dist |
|---|---|---|---|---|---|---|---|---|
| 1001 NE Baker Rd Stuart, FL | 1.0–3.0 | 1.0–2.0 | 952 | $1,901 | $2.00 | 14d | 27 | 0.40mi |
| 800 NW Fork Rd Stuart, FL | 1.0–2.0 | 1.0–2.0 | 886 | $1,800 | $2.03 | 14d | 2 | 0.93mi |
| 1900 NW Federal Hwy Stuart, FL | 1.0–2.0 | 1.0–2.0 | 1013 | $2,165 | $2.14 | 14d | 21 | 0.99mi |
| 2201 NW Federal Hwy Stuart, FL | 1.0–3.0 | 1.0–2.0 | 1080 | $1,810 | $1.68 | 14d | 18 | 1.07mi |
| 1010 NW Fresco Way Jensen Beach, FL | 1.0–3.0 | 1.0–2.0 | 1011 | $1,725 | $1.71 | 14d | 10 | 1.15mi |
| 1225 NW 21st St Unit 35-3512 Stuart, FL | 1.0 | 1.5 | 747 | $1,395 | $1.87 | 23d | 1 | 1.23mi |
| 1225 NW 21st St Stuart, FL | 1.0 | 1.5 | 773 | $1,350 | $1.75 | 14d | 1 | 1.24mi |
| 1225 NW 21st St Stuart, FL | 1.0 | 1.5 | 773 | $1,500 | $1.94 | 21d | 3 | 1.24mi |
| 1225 NW 21st St Unit 7-705 Stuart, FL | 1.0 | 1.5 | 747 | $1,550 | $2.07 | 14d | 1 | 1.24mi |
Listing history 27 events
-
2026-06-18days on market $149,900 Active 207 DOM
-
2026-06-17days on market $149,900 Active 206 DOM
-
2026-06-16days on market $149,900 Active 205 DOM
-
2026-06-15days on market $149,900 Active 204 DOM
-
2026-06-14days on market $149,900 Active 202 DOM
-
2026-06-13days on market $149,900 Active 201 DOM
-
2026-06-10days on market $149,900 Active 199 DOM
-
2026-06-09days on market $149,900 Active 198 DOM
-
2026-06-08days on market $149,900 Active 197 DOM
-
2026-06-07days on market $149,900 Active 196 DOM
-
2026-06-03days on market $149,900 Active 192 DOM
-
2026-06-02days on market $149,900 Active 191 DOM
-
2026-06-01days on market $149,900 Active 190 DOM
-
2026-05-31days on market $149,900 Active 189 DOM
-
2026-05-31days on market $149,900 Active 188 DOM
-
2026-01-22soldstatus $105,000
-
2025-11-23$149,900 Active 33-char remark
Show marketing remark (33 chars)
Waterfront 3br 1 bath Mobile Home
-
2023-09-08soldstatus $124,500
-
2023-08-10soldstatus $124,500 Closed 422-char remark
Show marketing remark (422 chars)
Great location in stuart lake views. You actually own the land as well! Great rental income property This is a 2/1/ plus has an extra room. Its a single wide trailer with lake views. Has an oversized lot . 26. Partially updated with flooring in the living room bedroom and bathroom. Has a wall over and top stove Some new paneling. Has a carport and a large shed in back yard. and is much larger than others in the area.
-
2023-07-29status Pending 422-char remark
Show marketing remark (422 chars)
Great location in stuart lake views. You actually own the land as well! Great rental income property This is a 2/1/ plus has an extra room. Its a single wide trailer with lake views. Has an oversized lot . 26. Partially updated with flooring in the living room bedroom and bathroom. Has a wall over and top stove Some new paneling. Has a carport and a large shed in back yard. and is much larger than others in the area.
-
2023-07-25price $124,999 422-char remark
Show marketing remark (422 chars)
Great location in stuart lake views. You actually own the land as well! Great rental income property This is a 2/1/ plus has an extra room. Its a single wide trailer with lake views. Has an oversized lot . 26. Partially updated with flooring in the living room bedroom and bathroom. Has a wall over and top stove Some new paneling. Has a carport and a large shed in back yard. and is much larger than others in the area.
-
2023-07-20price $126,999 422-char remark
Show marketing remark (422 chars)
Great location in stuart lake views. You actually own the land as well! Great rental income property This is a 2/1/ plus has an extra room. Its a single wide trailer with lake views. Has an oversized lot . 26. Partially updated with flooring in the living room bedroom and bathroom. Has a wall over and top stove Some new paneling. Has a carport and a large shed in back yard. and is much larger than others in the area.
-
2023-07-10$129,999 Active 422-char remark
Show marketing remark (422 chars)
Great location in stuart lake views. You actually own the land as well! Great rental income property This is a 2/1/ plus has an extra room. Its a single wide trailer with lake views. Has an oversized lot . 26. Partially updated with flooring in the living room bedroom and bathroom. Has a wall over and top stove Some new paneling. Has a carport and a large shed in back yard. and is much larger than others in the area.
-
2023-03-29soldstatus $75,000
-
2023-03-06soldstatus $75,000 Closed
-
2022-10-24status Pending
-
2022-10-14$85,000 Active
ⓘ Source: listings_history table (triggers on properties + properties_extension) + one-shot
backfill from property_details.listing_events for pre-trigger history.
Tax reassessment forecast FL · Resets to sale price
- Current annual tax
- $1,411 · $118/mo
- Projected year-2 tax
- $1,411 · $118/mo
- Expected delta
- $0/yr ($0/mo · -0.0%)
ⓘ Screening estimate from a state-policy table — verify with the county assessor before closing.
Climate risk First Street
- Flood 5/10 Major FEMA zone X (unshaded) · 48% chance over 30 yrs
- Wildfire 2/10 Low
- Heat 10/10 Extreme 7 d/yr ≥106°F today · 22 d/yr by 30 yrs out
- Wind 10/10 Extreme 99% chance of damaging wind over 30 yrs
- Air quality 2/10 Low 1 unhealthy d/yr today · 1 by 30 yrs out
Nearby sold comps map
Loading sold comps map…
Walkable amenities ~0.75 mi
Loading nearby amenities…
Taxation est. · year 1
- Rental income
- $21,101
- − Mortgage interest
- −$8,397
- − Property taxes
- −$1,411
- − Insurance
- −$750
- − Repairs & maintenance
- −$1,688
- − Management
- −$1,688
- − Depreciation
- −$4,361
- Taxable income
- $2,807
- Est. tax owed @ 24.0%
- −$674
- After-tax cash flow
- $4,402/yr
For passive investors: Depreciation is non-cash, so a rental often shows a tax loss while cash-flowing — sheltering income. Rental losses are passive: they offset passive income freely, and up to $25,000/yr can offset ordinary (W-2) income if you actively participate and your MAGI is under $100k (phasing out to $0 by $150k); unused losses carry forward. On sale, claimed depreciation is recaptured at up to 25%, and gains may owe capital-gains tax (a 1031 exchange can defer both). Figures are a year-1 estimate at your 24.0% rate — not tax advice; consult a CPA.
Schools (NCES district)
- District
- Martin
- NCES district ID
- 1201290
- Math proficiency
- 52% ▼ -14.00%
- Reading proficiency
- 53% ▼ -4.00%
- Median HH income
- $52,482
- Composite
- 45.1/100
- National rank
- #2690
- State rank
- #24 of 73 in FL
Livability — Jensen Beach
- Score
- 70/100
- State rank
- #432
- US rank
- #7719
Category grades
Schools grade is shown separately in the Schools card above.
Census & demographics
- Census place
- Jensen Beach, FL
- County
- Martin County · 165,223 people
- City population
- 23,462
- Metro
- Port St. Lucie, FL
- Population (ZIP)
- 18,737
- Household income
- $62,533
- Rent vs Own
- Severe rent burden
- 1408.0
Population outlook (Martin County) Hauer SSP2
- Today (2025)
- 172,383 people
- By 2030
- 180,192 · +4.5%
- By 2040
- 194,114 · +12.6%
- By 2050
- 204,992 · +18.9%
- By 2075
- 229,641 · +33.2%
- By 2100
- 232,146 · +34.7%
Race, ethnicity, and origin ACS 2023
- Neighborhood character
- Majority White (65%)
- Race & ethnicity
- White 65% Hispanic / Latino 21% Two or more races 12% Black 11%
- Hispanic origin (detail)
- Mexican 6% Puerto Rican 5% Cuban 1%
- Common ancestry
- Romanian 5% Lithuanian 3% Slovak 2%
- Foreign-born
- 12% · Canada
- Languages at home
- 80% English-only · Spanish 16% Russian/Polish/Slavic 2% Other Indo-European 1%
Political lean MEDSL · Martin
- 2024 margin
- Solid R (+31.1) · D 34.1% · R 65.2%
- 2008→2024 swing
- -17.5pp toward R · 2008: -13.6pp · 2024: -31.1pp
- All cycles
- 2024: R+31.1 2020: R+24.6 2016: R+26.9 2012: R+22.9 2008: R+13.6
Not yet ingested
- Civics
- —
Market trends
- HPI YoY
- ▼ -130.08%
- Current HPI
- 349.7061
- Rent YoY
- ▼ -0.69%
- Metro
- Port St. Lucie, FL
- State GDP YoY
- ▲ 3.28%
- F500 in state
- 36
Industry mix (Fortune 500 HQ in FL)
| Industry | F500 HQs | Revenue |
|---|---|---|
| Industrial Technology | 2 | $29B |
|
||
| Insurance | 2 | $17B |
|
||
| Retail | 1 | $60B |
|
||
| Technology Distribution | 1 | $58B |
|
||
| Homebuilding | 1 | $35B |
|
||
| Technology Manufacturing | 1 | $35B |
|
||
Price history
+23.5% since first listed12 events — show timeline
- 2026-01-22 Sold (Public Records) $105,000 Public Records
- 2025-11-23 Listed $149,900 ForSaleByOwner.com
- 2023-09-08 Sold (Public Records) $124,500 Public Records
- 2023-08-10 Sold (MLS) $124,500 Beaches MLS
- 2023-07-29 Pending — Beaches MLS
- 2023-07-25 Price Changed $124,999 Beaches MLS
- 2023-07-20 Price Changed $126,999 Beaches MLS
- 2023-07-10 Listed $129,999 Beaches MLS
- 2023-03-29 Sold (Public Records) $75,000 Public Records
- 2023-03-06 Sold (MLS) $75,000 Beaches MLS
- 2022-10-24 Pending — Beaches MLS
- 2022-10-14 Listed $85,000 Beaches MLS
Property tax history
+15.1%/yrLatest (2025): $1,411 · -1.4% YoY. Source: county tax records.
Cash-flow waterfall
monthlySold comps — $/sqft
last 12 mo · ≤1 miLoading sold comps…