 Duplex
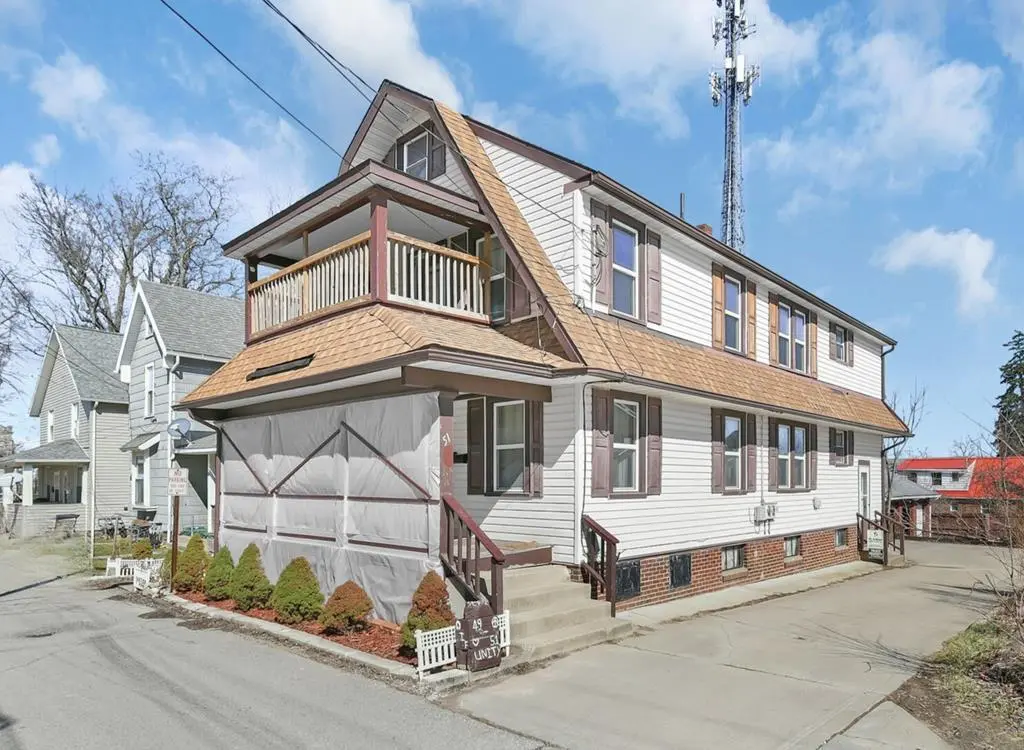
49 -51 Lind Ave · Mansfield, OH
Flood risk 1/10 · Minimal
- FEMA flood zone
- X (unshaded)
- Chance of flooding over 30 yrs
- 0.0%
- Est. flood insurance / yr
- $473 – $860
Fire risk 1/10 · Minimal
- Est. fire insurance / yr
- $713 – $1,323
Heat risk 3/10 · Minor
- Hot days now (above 96°F)
- 7 days/yr
- Hot days in 30 yrs
- 17 days/yr
Wind risk 2/10 · Minimal
- Chance of severe wind over 30 yrs
- —
Air-quality risk 2/10 · Minimal
- Unhealthy air days now
- 1 days/yr
- Unhealthy air days in 30 yrs
- 1 days/yr
Risk factors via First Street. Map © Google.
Why this score? — see what drove the C grade
The composite is a weighted blend of 9 inputs, each scored 0–100. Each bar is that input's sub-score; the figure is the points it added to the 100-point composite (weight × sub-score).
- Cash flow +27.7/30.0
- DSCR +9.7/10.0
- 1% rule +6.6/10.0
- Livability +3.8/5.0
- Rent growth +2.5/5.0
- Condition / age +2.5/5.0
- Schools +2.3/10.0
- ARV discount +0.0/15.0
- Appreciation +0.0/10.0
$174,900
🖨 Deal sheet 📄 Offer letter ✓ Due diligence
Multi-family units
County records classify this as Multi-Family (2-4 Unit). Listing-text estimate: 2 units. confirmed
Listing remarks MLS
Charming Multi-Family Opportunity in the heart of Mansfield! Offering strong investment potential or an excellent opportunity for owner-occupancy with rental income. This two-unit features both upper and lower units, each with separate entrances and utilities. Ideal for tenants or multi-generational living. Located just minutes from downtown, on a quiet dead end street, and only a few blocks from OhioHealth Mansfield Hospital, with a wide variety of shopping and dining options nearby. Public transportation is available. Both units offer spacious layouts, 3 BR, LR, DR, Kit with plenty of natural light. Includes off street parking for several vehicles. If you're looking to expand your investment portfolio or live in one unit while renting the other, don't miss this versatile opportunity! A one year home warranty is included. Seller is open to negotiation.
Key facts
- Separate utilities
- Off street parking
- Separate entrances
Tags
Neighborhood map
What this means for you Summary
Snapshot
- This is a 2 × 3-bed/1-bath units multifamily listed at $175k.
Deal economics
- At list price, monthly cash flow is $527 ($6k/yr) — positive. Per door: $264/mo.
- The deal already cash-flows at list — no discount required.
- Meets the 1% rule at list price ($2k rent vs $175k).
- Recommended offer: $159k (9.0% below list) — sets the bar for market timing.
- Cap rate 9.9% vs local median 4.2% in Mansfield — top-decile yield for the area; either an underpriced asset or a hidden risk that comps aren't pricing in. Stress-test before assuming the spread holds.
Location & tenants
- Location reads 76/100 on livability (#224 in OH, #3,525 nationally) — a middle-class / working-renter tenant base. Strengths: commute A+, cost of living A+, housing A+; Watch: schools C-, crime D-, amenities D-.
- Mansfield City (urban): math 24% / reading 33% proficiency, ranked #590 of 656 in OH (top 90%) — low school quality limits family demand, transient renter base, plan for 1-2y turnover; 80% free/reduced lunch — lower-income household profile, screen leases tightly.
- Market conditions: 122 active listings in the ZIP; 1 comparable units currently listed for rent nearby; 145 units permitted in Richland County in 2024 (0 in 5+ unit buildings).
- This rent runs 37% of the median local income ($65k/yr) — at the standard rent-burdened threshold; future hikes will face affordability resistance.
Forward outlook
- Local home prices are declining (-3.0%/yr); year-one equity from $1k of loan paydown is wiped out by about $5k of value loss. Plan a longer hold.
- Richland County population projected at -18% by 2050 — secular population decline; favor cash flow + early exit over multi-decade hold.
- At projected returns (-3.0% appreciation + 3.0% rent growth), your $49k cash investment doubles in ~9 years — after that, you're playing with house money.
Negotiation context
- It's been on market 101 days — a 9% lower offer ($159k) is reasonable based on typical stale-listing flexibility.
- 3 sale attempts since 5y ago with the ask held roughly flat each time — persistent listings suggest the price (not the market) is what's stuck; bring a comps-based counter.
Risks & watch-outs
- Watch-outs: built in 1930 — expect roof / HVAC / electrical / plumbing capex.
Questions for the listing agent
- It's been on market 101 days. Have you received any prior offers? Is the seller open to a 9% concession, seller financing, or rate buy-down credit?
- Can we see the unit-by-unit rent roll, current vacancy, and any below-market leases? What's the average tenancy length?
- What capital expenditures (roof, boiler, parking lot, exteriors) have been made in the last 5 years, and what's planned in the next 2?
- Built in 1930 — when were the roof, HVAC, electrical panel, plumbing, and water heater last replaced?
- Why hasn't it sold? Are there any deal-killer items the seller is aware of (foundation, flood, title, zoning, code violations)?
- Is there a deadline driving the sale (1031 exchange, divorce, estate, relocation)? That informs how much negotiation room exists.
- Crime grade is D in this area — have there been break-ins, vandalism, or insurance claims at this property in the last 3 years? What carrier currently insures it and at what premium?
- What's the average days-on-market for RENTAL listings here right now (not sales)? A rising rental-DOM trend means longer vacancies and softer asking-rent achievability than the comps imply.
- What's the recent tenant-quality profile in this submarket — average credit score on applications, eviction rate, late-payment / NSF rate, and stable-employment percentage? A property-management company in the area should have these aggregated.
- How much new apartment / multifamily construction is in the pipeline within 1–3 miles? Heavy new supply (>2% of stock underway) typically softens rents 12–24 months out; light construction supports rent growth.
Investment metrics
- 1% rule
- 1.16% ✓
- Cap rate
- 9.91%
- Cash-on-cash
- 12.92%
- DSCR
- 1.57
- GRM
- 7.2
CMA / ARV
- ARV (median comp)
- $117,818
- List price
- $174,900
- Delta
- 48.45%
- Verdict
- OVERPRICED
- Comps
- 12 within 1.0 mi
Projected returns pro-forma
-3.0% appreciation · 3.0% rent growth · sell at horizon
- IRR
- 2.8%
- Equity multiple
- 1.11×
- Total profit
- $5,193
- Equity at exit
- $26,078
- IRR
- 12.3%
- Equity multiple
- 1.97×
- Total profit
- $47,561
- Equity at exit
- $15,122
Cash invested: $48,972 (down + closing). Projections, not guarantees.
Landlord ↔ Tenant lean methodology
- Overall (STATE)
- 73 Landlord-Friendly
- State Ohio
- 73 Landlord-Friendly · R+6
- County
- — inherits STATE
- City
- — inherits STATE
ZIP-level market 44903
- Home prices YoY
- -27.7%
- Active inventory
- 122
- Price-to-rent
- 14.4×
Monthly cashflow live
- Estimated rent
- $2,030 high interval (Pro) →
- Mortgage (P&I)
- −$917
- Tax from tax record
- −$86 /mo · $1,036/yr
- Insurance
- −$73
- HOA
- −$0
- Vacancy / Maint / Mgmt
- −$426
- Net cashflow
- $527
Break-even live
2-unit breakdown (identical units grouped — click to expand)
| Units | Beds | Baths | Est. rent |
|---|---|---|---|
| 2× units | 3 | 1 | $2,030 |
| #1 | 3 | 1 | $1,015 |
| #2 | 3 | 1 | $1,015 |
| Total (2 units) | $2,030 | ||
UW: 25.0% down · 7.5% · 30yr · 1.5% tax · 5.0% vac · 8.0% maint · 8.0% mgmt
Financing live
Cash to close
- Down payment
- $43,725
- Closing costs
- $5,247
- Reserves months
- —
- Total cash needed
- —
Loan-product check · same deal, 3 products live
Conventional
25% down · 7.5% · 30yr
- Down + closing
- —
- Monthly P&I
- —
- Monthly cashflow
- —
- DSCR
- —
- Eligible?
- —
Personal DTI + credit; lowest rate.
DSCR
20% down · 8.5% · 30yr
- Down + closing
- —
- Monthly P&I
- —
- Monthly cashflow
- —
- DSCR
- —
- Eligible?
- —
No personal income docs; deal must DSCR.
Hard money
10% down · 12.0% · 12mo
- Down + closing
- —
- Monthly P&I
- —
- Monthly cashflow
- —
- DSCR
- —
- Eligible?
- —
Short-term bridge; refi at stabilization.
Rent comps 1 comps
| Address | Beds | Baths | Sqft | Rent | $/sqft | DOM | Units | Dist |
|---|---|---|---|---|---|---|---|---|
| 243 W 1st St Mansfield, OH | 4.0 | 1.0 | 1470 | $1,195 | $0.81 | 43d | 1 | 0.25mi |
Listing history 25 events
-
2026-06-19days on market $174,900 Active 101 DOM
-
2026-06-18$174,900 Active 100 DOM
-
2026-06-18days on market $174,900 Active 100 DOM
-
2026-06-17days on market $174,900 Active 99 DOM
-
2026-06-16days on market $174,900 Active 98 DOM
-
2026-06-15days on market $174,900 Active 97 DOM
-
2026-06-14days on market $174,900 Active 95 DOM
-
2026-06-12days on market $174,900 Active 94 DOM
-
2026-06-09days on market $174,900 Active 91 DOM
-
2026-06-08days on market $174,900 Active 90 DOM
-
2026-06-07days on market $174,900 Active 89 DOM
-
2026-06-05days on market $174,900 Active 86 DOM
-
2026-06-03days on market $174,900 Active 85 DOM
-
2026-06-02days on market $174,900 Active 84 DOM
-
2026-06-01days on market $174,900 Active 83 DOM
-
2026-05-31days on market $174,900 Active 82 DOM
-
2026-05-30days on market $174,900 Active 81 DOM
-
2026-03-10$179,900 Active 865-char remark
Show marketing remark (865 chars)
Charming Multi-Family Opportunity in the heart of Mansfield! Offering strong investment potential or an excellent opportunity for owner-occupancy with rental income. This two-unit features both upper and lower units, each with separate entrances and utilities. Ideal for tenants or multi-generational living. Located just minutes from downtown, on a quiet dead end street, and only a few blocks from OhioHealth Mansfield Hospital, with a wide variety of shopping and dining options nearby. Public transportation is available. Both units offer spacious layouts, 3 BR, LR, DR, Kit with plenty of natural light. Includes off street parking for several vehicles. If you're looking to expand your investment portfolio or live in one unit while renting the other, don't miss this versatile opportunity! A one year home warranty is included. Seller is open to negotiation.
-
2023-03-01soldstatus $155,000
-
2022-03-28status Pending
-
2022-03-28historical
-
2022-03-04price $159,900
-
2021-12-18$169,900 Active
-
2010-06-15soldstatus $28,500
ⓘ Source: listings_history table (triggers on properties + properties_extension) + one-shot
backfill from property_details.listing_events for pre-trigger history.
Tax reassessment forecast OH · Partial reset (capped growth)
- Current annual tax
- $1,036 · $86/mo
- Projected year-2 tax
- $1,882 · $157/mo
- Expected delta
- +$846/yr (+$71/mo · 81.7%)
ⓘ Screening estimate from a state-policy table — verify with the county assessor before closing.
Climate risk First Street
- Flood 1/10 Low FEMA zone X (unshaded) · 0% chance over 30 yrs
- Wildfire 1/10 Low
- Heat 3/10 Moderate 7 d/yr ≥96°F today · 17 d/yr by 30 yrs out
- Wind 2/10 Low
- Air quality 2/10 Low 1 unhealthy d/yr today · 1 by 30 yrs out
Nearby sold comps map
Loading sold comps map…
Walkable amenities ~0.75 mi
Loading nearby amenities…
Taxation est. · year 1
- Rental income
- $24,360
- − Mortgage interest
- −$9,797
- − Property taxes
- −$1,036
- − Insurance
- −$874
- − Repairs & maintenance
- −$1,949
- − Management
- −$1,949
- − Depreciation
- −$5,088
- Taxable income
- $3,667
- Est. tax owed @ 24.0%
- −$880
- After-tax cash flow
- $5,448/yr
For passive investors: Depreciation is non-cash, so a rental often shows a tax loss while cash-flowing — sheltering income. Rental losses are passive: they offset passive income freely, and up to $25,000/yr can offset ordinary (W-2) income if you actively participate and your MAGI is under $100k (phasing out to $0 by $150k); unused losses carry forward. On sale, claimed depreciation is recaptured at up to 25%, and gains may owe capital-gains tax (a 1031 exchange can defer both). Figures are a year-1 estimate at your 24.0% rate — not tax advice; consult a CPA.
Schools (NCES district)
- District
- Mansfield City
- NCES district ID
- 3904429
- Math proficiency
- 24% ▼ -19.00%
- Reading proficiency
- 33% ▼ -12.00%
- Median HH income
- $32,435
- Composite
- 23.25/100
- National rank
- #7934
- State rank
- #590 of 656 in OH
Livability — Mansfield
- Score
- 76/100
- State rank
- #224
- US rank
- #3525
Category grades
Schools grade is shown separately in the Schools card above.
Census & demographics
- Census place
- Mansfield, OH
- County
- Richland · 128,966 people
- City population
- 16,349
- Metro
- Mansfield, OH
- Population (ZIP)
- 26,804
- Household income
- $65,421
- Rent vs Own
- Severe rent burden
- 9.5
Population outlook (Richland County) Hauer SSP2
- Today (2025)
- 115,577 people
- By 2030
- 111,669 · -3.4%
- By 2040
- 103,323 · -10.6%
- By 2050
- 95,135 · -17.7%
- By 2075
- 76,719 · -33.6%
- By 2100
- 57,188 · -50.5%
Race, ethnicity, and origin ACS 2023
- Neighborhood character
- Predominantly White (80%)
- Race & ethnicity
- White 80% Two or more races 9% Black 9% Hispanic / Latino 2% Asian 1%
- Common ancestry
- Slovak 2% Iranian 1% Romanian 1%
- Foreign-born
- 1%
- Languages at home
- 97% English-only · Spanish 1% Other Indo-European 1%
Political lean MEDSL · Richland
- 2024 margin
- Solid R (+42.3) · D 28.4% · R 70.8%
- 2008→2024 swing
- -28.8pp toward R · 2008: -13.6pp · 2024: -42.3pp
- All cycles
- 2024: R+42.3 2020: R+39.7 2016: R+37.5 2012: R+20.1 2008: R+13.6
Not yet ingested
- Civics
- —
Market trends
- HPI YoY
- ▼ -92.50%
- Current HPI
- 241.9342
- Rent YoY
- —
- Metro
- —
- State GDP YoY
- ▲ 1.98%
- F500 in state
- 48
Industry mix (Fortune 500 HQ in OH)
| Industry | F500 HQs | Revenue |
|---|---|---|
| Insurance | 3 | $145B |
|
||
| Industrial Machinery | 3 | $49B |
|
||
| Financial Services | 3 | $24B |
|
||
| Consumer Goods | 2 | $93B |
|
||
| Aerospace / Defense | 2 | $47B |
|
||
| Utilities | 2 | $33B |
|
||
Price history
+531.2% since first listed8 events — show timeline
- 2026-03-10 Listed $179,900 MARMLS
- 2026-03-10 Listed $179,900 ABOR
- 2023-03-01 Sold (Public Records) $155,000 Public Records
- 2022-03-28 Pending — CBRMLS
- 2022-03-28 Listing Removed — CBRMLS
- 2022-03-04 Price Changed $159,900 CBRMLS
- 2021-12-18 Listed $169,900 CBRMLS
- 2010-06-15 Sold (Public Records) $28,500 Public Records
Property tax history
+5.0%/yrLatest (2025): $1,036 · -2.2% YoY. Source: county tax records.
Cash-flow waterfall
monthlySold comps — $/sqft
last 12 mo · ≤1 miLoading sold comps…