 Duplex
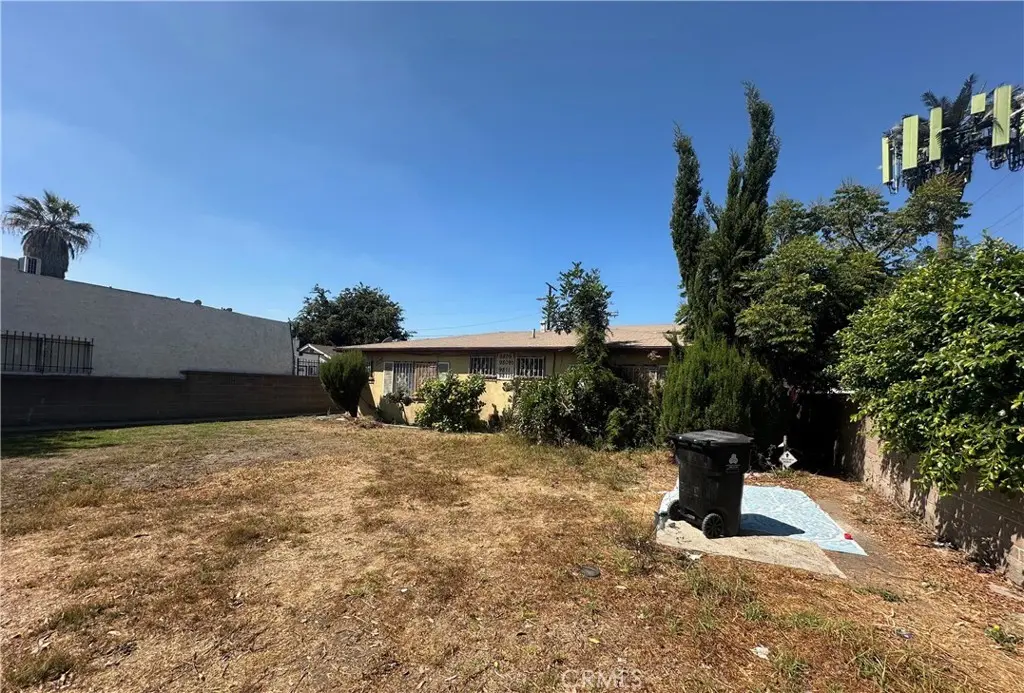
9809 Avalon · Los Angeles, CA
Flood risk 1/10 · Minimal
- FEMA flood zone
- X (unshaded)
- Chance of flooding over 30 yrs
- 0.0%
- Est. flood insurance / yr
- $507 – $1,088
Fire risk 1/10 · Minimal
- Est. fire insurance / yr
- $659 – $1,223
Heat risk 5/10 · Moderate
- Hot days now (above 90°F)
- 7 days/yr
- Hot days in 30 yrs
- 22 days/yr
Wind risk 1/10 · Minimal
- Chance of severe wind over 30 yrs
- —
Air-quality risk 5/10 · Moderate
- Unhealthy air days now
- 7 days/yr
- Unhealthy air days in 30 yrs
- 7 days/yr
Risk factors via First Street. Map © Google.
Why this score? — see what drove the D- grade
The composite is a weighted blend of 9 inputs, each scored 0–100. Each bar is that input's sub-score; the figure is the points it added to the 100-point composite (weight × sub-score).
- ARV discount +15.0/15.0
- Cash flow +6.8/30.0
- Schools +3.6/10.0
- Livability +3.4/5.0
- Rent growth +2.5/5.0
- Condition / age +2.5/5.0
- 1% rule +2.0/10.0
- DSCR +1.0/10.0
- Appreciation +0.0/10.0
$624,900
🖨 Deal sheet (PDF) 📄 Offer letter ✓ Due diligence
Multi-family units
County records classify this as Multi-Family (2-4 Unit). Listing-text estimate: 2 units. confirmed
Listing remarks
REO! BANK OWNED! SOLD STRICTLY AS IS! WELCOME TO THIS GREEN MEADOWS LOCATED FOUR PLEX, FOUR ONE BED, ONE BATH UNITS, AND FIVE GARAGE SPACES UNDER TWO UNITS ABOVE IN REAR, AND TWO UNITS IN FRONT, TWO SEPARATE BUILDINGS, BACK ALLEY ACCESS, CONVENIENT CENTRAL LOCATION! PLEASE DO NOT DISTURB! BUYER TO PURCHASE THE PROPERTY SITE UNSEEN, NO INSPECTIONS, NO APPRAISAL, CASH ONLY! BUYER TO BE RESPONSIBLE AFTER CLOSE OF ESCROW AT BUYER'S EXPENSE REGARDING ANY RELOCATION AND/OR RENOVATION EXPENSES. CLOSE TO LAX, ABOUT 13 MILES TO MANHATTAN BEACH! EXCELLENT COMMUTER LOCATION, NEAR 110 AND 105 FWYS!
Key facts
- Back alley access
- Five garage spaces
- 8,081 sq ft lot
Tags
Property features AI
Finance
- HOA & community: Urban neighborhood with sidewalks; Subject to rent control; Land lease
Exterior
- Parking: Five parking spaces total; Each unit includes 1 garage space (some units have attached garages)
- Utilities: Sewer or septic (unknown); Water source: see remarks; One separate water meter; Four separate gas meters; Four separate electric meters
- Home design: Attached multi-unit property; Two-story building; Total building area 2,605
- Construction: Two buildings on the parcel; Property built (year per assessor)
- Exterior features: No pool; Front yard
Interior
- Bedrooms: Four 1-bedroom units (each unit listed as 1 bed)
- Bathrooms: Four full bathrooms (each unit has 1 full bath)
- Interior features: Ground-level entry
- Laundry & utility: On-site laundry available (see remarks for details)
Neighborhood map
What this means for you Summary
Snapshot
- This is a 2 × 1-bed/?-bath units multifamily listed at $625k.
Deal economics
- At list price, monthly cash flow is $-967 ($-12k/yr) — negative. Per door: $-484/mo.
- To cash-flow at today's rent, offer at most $454k (27.3% below list).
- To meet the 1% rule (rent ≥ 1% of price), the offer needs to be $436k (30.2% below list).
- Recommended offer: $436k (30.2% below list) — sets the bar for 1% rule.
- Cap rate 4.4% vs local median 2.1% in Los Angeles — top-decile yield for the area; either an underpriced asset or a hidden risk that comps aren't pricing in. Stress-test before assuming the spread holds.
Location & tenants
- Location reads 68/100 on livability (#273 in CA) — a middle-class / working-renter tenant base. Strengths: amenities A+, commute A+, employment B; Watch: health & safety C-, schools D+, crime F.
- Los Angeles Unified (urban): math 29% / reading 54% proficiency, ranked #223 of 517 in CA (top 43%) — families likely to look elsewhere, expect single-tenant / working-renter base with shorter leases; 67% free/reduced lunch — lower-income household profile, screen leases tightly.
- Market conditions: Rents flat; 161 active listings in the ZIP; 40 comparable units currently listed for rent nearby; rentals lingering (median 45d on market — plan ~5-8 weeks vacancy on turnover, expect pricing pressure); 55% of comp listings sitting > 30 days — soft ceiling on asking rent; 19,697 units permitted in Los Angeles County in 2024 (9,426 in 5+ unit buildings).
- At $4,364/mo this rent would consume 93% of the median local household income ($56k/yr) (locally 4550% of renters already pay >50% of income on rent) — very limited rent-growth headroom before tenants either downsize or default.
Forward outlook
- Local home prices are declining (-3.0%/yr); year-one equity from $4k of loan paydown is wiped out by about $19k of value loss. Plan a longer hold.
- Los Angeles County population projected at +9% by 2050 — modest demand growth; plan on rents tracking national, not racing it.
Negotiation context
- It's been on market 24 days — a 2% lower offer ($616k) is reasonable based on typical stale-listing flexibility.
- 7 sale attempts since 22y ago with the ask held roughly flat each time — persistent listings suggest the price (not the market) is what's stuck; bring a comps-based counter.
Risks & watch-outs
- Watch-outs: built in 1954 — expect roof / HVAC / electrical / plumbing capex.
- Climate carrying-cost: extreme-heat days projected 7→22/yr by 2055 (HVAC capex compounding) — expect insurance premiums to compound above CPI over the hold.
Questions for the listing agent
- What do current leases actually rent for vs. the listed asking? Can we see a recent rent roll and the last 12 months of T-12 income?
- Can we see the unit-by-unit rent roll, current vacancy, and any below-market leases? What's the average tenancy length?
- What capital expenditures (roof, boiler, parking lot, exteriors) have been made in the last 5 years, and what's planned in the next 2?
- Built in 1954 — when were the roof, HVAC, electrical panel, plumbing, and water heater last replaced?
- Is there a deadline driving the sale (1031 exchange, divorce, estate, relocation)? That informs how much negotiation room exists.
- Schools are D-rated, which usually means shorter tenancies and higher turnover. Who's the typical renter profile here, and what's been the actual vacancy rate?
- Crime grade is F in this area — have there been break-ins, vandalism, or insurance claims at this property in the last 3 years? What carrier currently insures it and at what premium?
- The area grade is low — what's the realistic commute time and amenity access for the typical tenant pool here? Any planned neighborhood developments (good or bad) we should know about?
- What's the average days-on-market for RENTAL listings here right now (not sales)? A rising rental-DOM trend means longer vacancies and softer asking-rent achievability than the comps imply.
- What's the recent tenant-quality profile in this submarket — average credit score on applications, eviction rate, late-payment / NSF rate, and stable-employment percentage? A property-management company in the area should have these aggregated.
- How much new apartment / multifamily construction is in the pipeline within 1–3 miles? Heavy new supply (>2% of stock underway) typically softens rents 12–24 months out; light construction supports rent growth.
Investment metrics
- 1% rule
- 0.70% ✗
- Cap rate
- 4.44%
- Cash-on-cash
- -6.63%
- DSCR
- 0.70
- GRM
- 11.9
CMA / ARV
- ARV (median comp)
- $801,135
- List price
- $624,900
- Delta
- -22.00%
- Verdict
- UNDERPRICED
- Comps
- 20 within 1.0 mi
Show comp detail 4 sales within ~0.75 mi
| Address | Dist | Beds/Ba | Sqft | Sold | Price | $/sf | Match |
|---|---|---|---|---|---|---|---|
| 755 E 106th St | 0.53mi | 3/2.0 (+1) | 1,297 (-1%) | 22mo | $640,000 | $493 | 51 |
| 155 E Colden Ave | 0.40mi | 3/2.0 (+1) | 1,427 (+9%) | 23mo | $650,000 | $456 | 41 |
| 936 E 91st St | 0.65mi | 3/2.0 (+1) | 1,218 (-7%) | 22mo | $660,000 | $542 | 35 |
| 1235 E 99th St | 0.74mi | 3/2.0 (+1) | 1,171 (-10%) | 13mo | $690,000 | $589 | 32 |
Match score weights: distance 35% · size 25% · config 20% · recency 20%. Top-matched comps best support the ARV.
Projected returns pro-forma
-3.0% appreciation · 0.11% rent growth · sell at horizon
- IRR
- -31.1%
- Equity multiple
- -0.00×
- Total profit
- $-175,063
- Equity at exit
- $93,175
- IRR
- -54.3%
- Equity multiple
- -0.59×
- Total profit
- $-279,014
- Equity at exit
- $54,030
Cash invested: $174,972 (down + closing). Projections, not guarantees.
Landlord ↔ Tenant lean methodology
- Overall (CITY)
- 0 Strongly Tenant-Friendly
- State California
- 18 Strongly Tenant-Friendly · D+13
- County
- — inherits STATE
- City Los Angeles
- 0 Strongly Tenant-Friendly · D+22
ZIP-level market 90003
- Rents YoY
- 0.1%
- Active inventory
- 161
- Price-to-rent
- 23.9×
Monthly cashflow live
- Estimated rent
- $4,364 high interval (Pro) →
- Mortgage (P&I)
- −$3,277
- Tax from tax record
- −$877 /mo · $10,527/yr
- Insurance
- −$260
- HOA
- −$0
- Vacancy / Maint / Mgmt
- −$916
- Net cashflow
- $-967
Break-even live
Sensitivity live
| Price | -10% $-613 | -5% $-790 | +0% $-967 | +5% $-1,144 | +10% $-1,321 |
|---|---|---|---|---|---|
| Rent | -10% $-1,312 | -5% $-1,139 | +0% $-967 | +5% $-795 | +10% $-622 |
| Rate | -1.0pp $-652 | -0.5pp $-808 | base $-967 | +0.5pp $-1,129 | +1.0pp $-1,294 |
2-unit breakdown (identical units grouped — click to expand)
| Units | Beds | Baths | Est. rent |
|---|---|---|---|
| 2× units | 1 | — | $4,364 |
| #1 | 1 | — | $2,182 |
| #2 | 1 | — | $2,182 |
| Total (2 units) | $4,364 | ||
UW: 25.0% down · 7.5% · 30yr · 1.5% tax · 5.0% vac · 8.0% maint · 8.0% mgmt
Financing live
Cash to close
- Down payment
- $156,225
- Closing costs
- $18,747
- Reserves months
- —
- Total cash needed
- —
Loan-product check · same deal, 3 products live
Conventional
25% down · 7.5% · 30yr
- Down + closing
- —
- Monthly P&I
- —
- Monthly cashflow
- —
- DSCR
- —
- Eligible?
- —
Personal DTI + credit; lowest rate.
DSCR
20% down · 8.5% · 30yr
- Down + closing
- —
- Monthly P&I
- —
- Monthly cashflow
- —
- DSCR
- —
- Eligible?
- —
No personal income docs; deal must DSCR.
Hard money
10% down · 12.0% · 12mo
- Down + closing
- —
- Monthly P&I
- —
- Monthly cashflow
- —
- DSCR
- —
- Eligible?
- —
Short-term bridge; refi at stabilization.
Rent comps 40 comps
| Address | Beds | Baths | Sqft | Rent | $/sqft | DOM | Units | Dist |
|---|---|---|---|---|---|---|---|---|
| 606 E 99th St Los Angeles, CA | 3.0 | 2.0 | 1798 | $3,650 | $2.03 | 0d | 1 | 0.08mi |
| 245 E 102nd St Los Angeles, CA | 3.0 | 2.0 | 1074 | $2,900 | $2.70 | 44d | 1 | 0.31mi |
| 10218 S San Pedro St Los Angeles, CA | 3.0 | 3.0 | 1284 | $2,950 | $2.30 | 8d | 1 | 0.32mi |
| 218 E 95th St Unit 1/2 Los Angeles, CA | 3.0 | 2.0 | 991 | $3,350 | $3.38 | 44d | 1 | 0.35mi |
| 130 E Colden Ave Unit 1 Los Angeles, CA | 2.0 | 1.0 | 890 | $2,650 | $2.98 | 6d | 1 | 0.40mi |
| 151 E 95th St Los Angeles, CA | 2.0 | 1.0 | 1050 | $2,800 | $2.67 | 44d | 1 | 0.42mi |
| 109 E 95th St Unit 4 Los Angeles, CA | 3.0 | 1.0 | 1000 | $2,887 | $2.89 | 44d | 1 | 0.48mi |
| 9017 Avalon Blvd Los Angeles, CA | 3.0 | 2.0 | 1234 | $3,000 | $2.43 | 44d | 1 | 0.50mi |
| 146 E 104th St Los Angeles, CA | 3.0 | 1.0 | 1100 | $3,452 | $3.14 | 8d | 1 | 0.51mi |
| 9197 Wall St Los Angeles, CA | 3.0 | 2.0 | 1250 | $3,500 | $2.80 | 44d | 1 | 0.52mi |
| 239 E 90th St Los Angeles, CA | 3.0 | 2.0 | 1260 | $3,295 | $2.62 | 12d | 1 | 0.60mi |
| 138 W 93rd St Los Angeles, CA | 3.0 | 2.0 | 1000 | $3,250 | $3.25 | 23d | 1 | 0.63mi |
| 10616 S Main St Los Angeles, CA | 3.0 | 2.0 | 1450 | $3,395 | $2.34 | 8d | 1 | 0.67mi |
| 915 E 91st St Unit 915 Los Angeles, CA | 3.0 | 1.0 | 1800 | $3,200 | $1.78 | 44d | 1 | 0.67mi |
| 9715 S Broadway Unit 1 Los Angeles, CA | 3.0 | 1.0 | 950 | $2,990 | $3.15 | 44d | 1 | 0.73mi |
| 123 E 88th St Unit 1/2 Los Angeles, CA | 3.0 | 2.0 | 1156 | $3,550 | $3.07 | 44d | 1 | 0.82mi |
| 9310 Pace Ave Los Angeles, CA | 3.0 | 1.0 | 1254 | $3,200 | $2.55 | 44d | 1 | 0.83mi |
| 10972 McKinley Ave Unit 1/4 Los Angeles, CA | 3.0 | 2.0 | 1050 | $3,500 | $3.33 | 15d | 1 | 0.84mi |
| 118 W 109th St Unit 3/4 Los Angeles, CA | 3.0 | 2.0 | 1000 | $2,850 | $2.85 | 25d | 1 | 0.84mi |
| 639 E 87th St Los Angeles, CA | 3.0 | 1.0 | 900 | $3,650 | $4.06 | 6d | 1 | 0.87mi |
| 10527 Pace Ave Los Angeles, CA | 3.0 | 1.0 | 992 | $3,400 | $3.43 | 44d | 1 | 0.87mi |
| 924 E Lanzit Ave Los Angeles, CA | 1.0 | 1.0 | 1184 | $2,200 | $1.86 | 44d | 1 | 0.99mi |
| 229 E 85th St Unit 231 12 Los Angeles, CA | 3.0 | 1.0 | 950 | $2,750 | $2.89 | 44d | 1 | 1.02mi |
| 8715 Hooper Ave Unit 87195 Los Angeles, CA | 3.0 | 2.0 | 1050 | $3,490 | $3.32 | 44d | 1 | 1.05mi |
| 263 E 84th Pl Los Angeles, CA | 3.0 | 1.0 | 1450 | $2,950 | $2.03 | 16d | 1 | 1.06mi |
| 400 W 109th St Unit 2 Los Angeles, CA | 3.0 | 2.0 | 1368 | $2,900 | $2.12 | 44d | 1 | 1.08mi |
| 400 W 109th St Unit 2 Los Angeles, CA | 3.0 | 2.0 | 1300 | $2,700 | $2.08 | 25d | 1 | 1.08mi |
| 607 W 101st St Los Angeles, CA | 2.0 | 1.0 | 995 | $2,800 | $2.81 | 25d | 1 | 1.11mi |
| 636 E Imperial Hwy Los Angeles, CA | 3.0 | 2.0 | 1100 | $3,250 | $2.95 | 44d | 1 | 1.12mi |
| 1317 E 110th St Los Angeles, CA | 1.0 | 1.0 | 907 | $2,300 | $2.54 | 16d | 1 | 1.12mi |
| 10705 S Figueroa St Unit 7 Los Angeles, CA | 3.0 | 2.0 | 1600 | $2,750 | $1.72 | 16d | 1 | 1.13mi |
| 10705 S Figueroa St Unit 10 Los Angeles, CA | 3.0 | 2.0 | 1600 | $2,700 | $1.69 | 16d | 1 | 1.13mi |
| 8418 Main St Unit 8418 Los Angeles, CA | 3.0 | 3.0 | 977 | $2,695 | $2.76 | 44d | 1 | 1.14mi |
| 411 E 115th St Los Angeles, CA | 2.0 | 2.0 | 1391 | $3,800 | $2.73 | 25d | 1 | 1.15mi |
| 8738 S Figueroa St Unit 3 Los Angeles, CA | 3.0 | 2.0 | 1100 | $2,300 | $2.09 | 44d | 1 | 1.19mi |
| 676 E 115th St Los Angeles, CA | 2.0 | 1.0 | 1050 | $2,600 | $2.48 | 44d | 1 | 1.19mi |
| 9220 Compton Ave Los Angeles, CA | 1.0 | 1.0 | 889 | $2,500 | $2.81 | 5d | 1 | 1.23mi |
| 212 W 84th St Los Angeles, CA | 2.0 | 1.0 | 990 | $3,100 | $3.13 | 44d | 1 | 1.26mi |
| 735 E 82nd St Los Angeles, CA | 3.0 | 2.0 | 913 | $3,400 | $3.72 | 44d | 1 | 1.26mi |
| 1101 E 115th St Los Angeles, CA | 3.0 | 1.0 | 968 | $2,995 | $3.09 | 44d | 1 | 1.28mi |
Listing history 37 events
-
2026-06-21remarks 597-char remark
-
2026-06-21days on market $624,900 Active 24 DOM
-
2026-06-18days on market $624,900 Active 21 DOM
-
2026-06-17remarks 528-char remark
-
2026-06-17days on market $624,900 Active 20 DOM
-
2026-06-16days on market $624,900 Active 19 DOM
-
2026-06-15days on market $624,900 Active 18 DOM
-
2026-06-13days on market $624,900 Active 16 DOM
-
2026-06-09days on market $624,900 Active 12 DOM
-
2026-06-08days on market $624,900 Active 11 DOM
-
2026-06-07days on market $624,900 Active 10 DOM
-
2026-06-04days on market $624,900 Active 7 DOM
-
2026-06-03days on market $624,900 Active 6 DOM
-
2026-06-02days on market $624,900 Active 5 DOM
-
2026-06-01days on market $624,900 Active 4 DOM
-
2026-05-31days on market $624,900 Active 3 DOM
-
2026-04-15price $624,900 1132-char remark
-
2026-03-17historical
-
2026-02-19$689,000 Active 1132-char remark
-
2026-02-18status Active
-
2026-02-17historical
-
2025-12-17price $725,000
-
2025-10-06$762,000 Active
-
2020-08-31soldstatus $730,000 Closed Sale
-
2020-08-28soldstatus $730,000
-
2020-08-10historical Active Under Contract
-
2020-06-01price $730,000
-
2020-05-26$699,900 Active
-
2013-12-27soldstatus $350,000
-
2013-12-24soldstatus $350,000 Closed
-
2013-11-22status Pending
-
2013-10-10$350,000 Active
-
2004-08-20soldstatus $310,000
-
2004-08-18soldstatus $310,000
-
2004-06-10historical
-
2004-06-06$240,000
-
1987-10-13soldstatus $122,000
ⓘ Source: listings_history table (triggers on properties + properties_extension) + one-shot
backfill from property_details.listing_events for pre-trigger history.
Tax reassessment forecast CA · Resets to sale price
- Current annual tax
- $10,527 · $877/mo
- Projected year-2 tax
- $10,527 · $877/mo
- Expected delta
- $0/yr ($0/mo · 0.0%)
ⓘ Screening estimate from a state-policy table — verify with the county assessor before closing.
Climate risk First Street
- Flood 1/10 Low FEMA zone X (unshaded) · 0% chance over 30 yrs
- Wildfire 1/10 Low
- Heat 5/10 Major 7 d/yr ≥90°F today · 22 d/yr by 30 yrs out
- Wind 1/10 Low
- Air quality 5/10 Major 7 unhealthy d/yr today · 7 by 30 yrs out
Nearby sold comps map
Loading sold comps map…
Walkable amenities ~0.75 mi
Loading nearby amenities…
Taxation est. · year 1
- Rental income
- $52,368
- − Mortgage interest
- −$35,004
- − Property taxes
- −$10,527
- − Insurance
- −$3,124
- − Repairs & maintenance
- −$4,189
- − Management
- −$4,189
- − Depreciation
- −$18,179
- Taxable loss
- −$22,845
- Est. tax savings @ 24.0%
- +$5,483
- After-tax cash flow
- $-6,122/yr
For passive investors: Depreciation is non-cash, so a rental often shows a tax loss while cash-flowing — sheltering income. Rental losses are passive: they offset passive income freely, and up to $25,000/yr can offset ordinary (W-2) income if you actively participate and your MAGI is under $100k (phasing out to $0 by $150k); unused losses carry forward. On sale, claimed depreciation is recaptured at up to 25%, and gains may owe capital-gains tax (a 1031 exchange can defer both). Figures are a year-1 estimate at your 24.0% rate — not tax advice; consult a CPA.
Schools (NCES district)
- District
- Los Angeles Unified
- NCES district ID
- 0622710
- Math proficiency
- 29% ▼ -4.00%
- Reading proficiency
- 54% ▲ 10.00%
- Median HH income
- $50,403
- Composite
- 35.67/100
- National rank
- #4875
- State rank
- #223 of 517 in CA
Livability — Los Angeles
- Score
- 68/100
- State rank
- #273
- US rank
- #9237
Category grades
Schools grade is shown separately in the Schools card above.
Census & demographics
- Census place
- Los Angeles, CA
- County
- Los Angeles County · 9,444,647 people
- City population
- 3,838,149
- Metro
- Los Angeles-Long Beach-Anaheim, CA
- Population (ZIP)
- 70,065
- Household income
- $56,030
- Rent vs Own
- Severe rent burden
- 4550.0
Population outlook (Los Angeles County) Hauer SSP2
- Today (2025)
- 10,940,515 people
- By 2030
- 11,256,481 · +2.9%
- By 2040
- 11,729,929 · +7.2%
- By 2050
- 11,948,407 · +9.2%
- By 2075
- 11,818,114 · +8.0%
- By 2100
- 10,842,928 · -0.9%
Race, ethnicity, and origin ACS 2023
- Neighborhood character
- Predominantly Hispanic (81%)
- Race & ethnicity
- Hispanic / Latino 81% Two or more races 20% Black 16% Native American 1%
- Hispanic origin (detail)
- Mexican 51%
- Common ancestry
- British 1%
- Foreign-born
- 40% · Canada
- Languages at home
- 24% English-only · Spanish 75%
Political lean MEDSL · Los Angeles
- 2024 margin
- Solid D (+32.9) · D 64.8% · R 31.9% · Other 3.3%
- 2008→2024 swing
- -7.4pp toward R · 2008: 40.4pp · 2024: 32.9pp
- All cycles
- 2024: D+32.9 2020: D+44.2 2016: D+48.0 2012: D+40.0 2008: D+40.4
Not yet ingested
- Civics
- —
Market trends
- HPI YoY
- ▼ -785.95%
- Current HPI
- 512.5667
- Rent YoY
- ▲ 0.11%
- Metro
- Los Angeles-Long Beach-Anaheim, CA
- State GDP YoY
- ▲ 3.21%
- F500 in state
- 116
Industry mix (Fortune 500 HQ in CA)
| Industry | F500 HQs | Revenue |
|---|---|---|
| Technology | 27 | $1,492B |
|
||
| Financial Services | 3 | $174B |
|
||
| Retail | 3 | $44B |
|
||
| Insurance | 3 | $26B |
|
||
| Media / Entertainment | 2 | $115B |
|
||
| Pharmaceuticals / Biotech | 2 | $62B |
|
||
Price history
+412.2% since first listed23 events — show timeline
- 2026-05-28 Listed $624,900 CRMLS
- 2026-05-27 Listing Removed — CRMLS
- 2026-04-15 Price Changed $624,900 CRMLS
- 2026-03-17 Listing Removed — CRMLS
- 2026-02-19 Listed $689,000 CRMLS
- 2026-02-18 Relisted — CRMLS
- 2026-02-17 Listing Removed — CRMLS
- 2025-12-17 Price Changed $725,000 CRMLS
- 2025-10-06 Listed $762,000 CRMLS
- 2020-08-31 Sold (MLS) $730,000 CRMLS
- 2020-08-28 Sold (Public Records) $730,000 Public Records
- 2020-08-10 Contingent — CRMLS
- 2020-06-01 Price Changed $730,000 CRMLS
- 2020-05-26 Listed $699,900 CRMLS
- 2013-12-27 Sold (Public Records) $350,000 Public Records
- 2013-12-24 Sold (MLS) $350,000 CRMLS
- 2013-11-22 Pending — CRMLS
- 2013-10-10 Listed $350,000 CRMLS
- 2004-08-20 Sold (MLS) $310,000 TheMLS
- 2004-08-18 Sold (Public Records) $310,000 Public Records
- 2004-06-10 Delisted — TheMLS
- 2004-06-06 Listed $240,000 TheMLS
- 1987-10-13 Sold (Public Records) $122,000 Public Records
Property tax history
+4.8%/yrLatest (2025): $10,527 · +1.2% YoY. Source: county tax records.
Cash-flow waterfall
monthlySold comps — $/sqft
last 12 mo · ≤1 miLoading sold comps…