 🏷️ Likely Rental
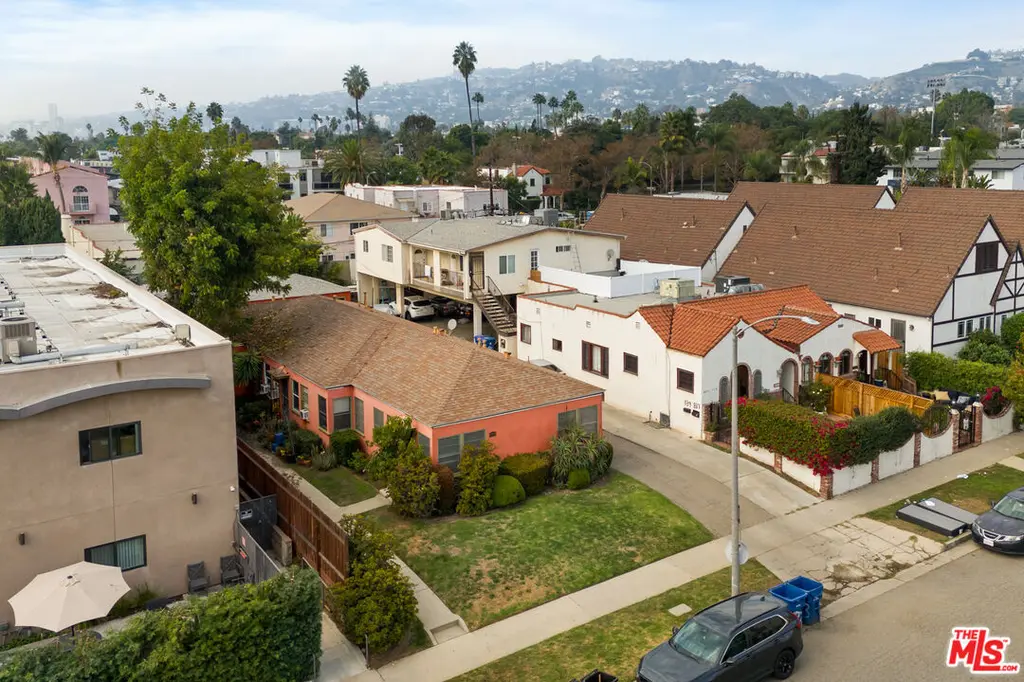
833 N Poinsettia Pl · Los Angeles, CA
Flood risk 1/10 · Minimal
- FEMA flood zone
- X (unshaded)
- Chance of flooding over 30 yrs
- 0.0%
- Est. flood insurance / yr
- $507 – $1,088
Fire risk 1/10 · Minimal
- Est. fire insurance / yr
- $659 – $1,223
Heat risk 6/10 · Moderate
- Hot days now (above 90°F)
- 7 days/yr
- Hot days in 30 yrs
- 22 days/yr
Wind risk 1/10 · Minimal
- Chance of severe wind over 30 yrs
- —
Air-quality risk 5/10 · Moderate
- Unhealthy air days now
- 8 days/yr
- Unhealthy air days in 30 yrs
- 8 days/yr
Risk factors via First Street. Map © Google.
Why this score? — see what drove the D grade
The composite is a weighted blend of 9 inputs, each scored 0–100. Each bar is that input's sub-score; the figure is the points it added to the 100-point composite (weight × sub-score).
- ARV discount +15.0/15.0
- Cash flow +10.7/30.0
- Schools +3.6/10.0
- Livability +3.4/5.0
- DSCR +3.1/10.0
- Condition / age +2.5/5.0
- 1% rule +2.2/10.0
- Rent growth +2.1/5.0
- Appreciation +0.0/10.0
$1,300,000
🖨 Deal sheet 📄 Offer letter ✓ Due diligence
Multi-family units
County records classify this as Multi-Family (2-4 Unit). Listing-text estimate: 4 units. confirmed
Listing remarks MLS
We are pleased to present a very rare opportunity to acquire 833 N Poinsettia Pl, a West Hollywood-adjacent 4-Unit multifamily building. Available for the first time since 1988, the property is ideally situated between Santa Monica Blvd and Melrose Ave, within close distance to some of Los Angeles' most iconic dining, nightlife, and shopping destinations. 833 N Poinsettia Pl boasts a prime location with exceptionally high tenant demand and easy access to other coveted employer hubs including Beverly Hills, Century City, Hollywood, and the Miracle Mile. This property sits on a 7,349 Square Foot lot with 2,374 Square Feet of gross building area. The property consists of Four (1) One-Bedroom Units that are each individually metered for utilities. Tenants also benefit from Six (6) on-site private parking spots, Four (4) garage spots and Two (2)along the driveway, as well as dedicated storage areas. This is a rare opportunity to acquire a coveted asset in one of the most competitive rental submarkets in Los Angeles. With current rents approximately 58% below market, the property provides clear value-add potential for investors, while also offering significant existing cash flow and strong long-term appreciation potential.
Key facts
- Easy access
- Value add potential
- Prime location
Tags
Neighborhood map
What this means for you Summary
Snapshot
- This is a 4 × 1-bed/1-bath units multifamily listed at $1.30M.
Deal economics
- At list price, monthly cash flow is $-623 ($-7k/yr) — negative. Per door: $-156/mo.
- To cash-flow at today's rent, offer at most $1.19M (8.5% below list).
- To meet the 1% rule (rent ≥ 1% of price), the offer needs to be $936k (28.0% below list).
- Recommended offer: $936k (28.0% below list) — sets the bar for 1% rule.
- Cap rate 5.7% vs local median 2.1% in Los Angeles — top-decile yield for the area; either an underpriced asset or a hidden risk that comps aren't pricing in. Stress-test before assuming the spread holds.
Location & tenants
- Location reads 68/100 on livability (#273 in CA) — a middle-class / working-renter tenant base. Strengths: amenities A+, commute A+, employment B; Watch: health & safety C-, schools D+, crime F.
- Los Angeles Unified (urban): math 29% / reading 54% proficiency, ranked #223 of 517 in CA (top 43%) — families likely to look elsewhere, expect single-tenant / working-renter base with shorter leases; 67% free/reduced lunch — lower-income household profile, screen leases tightly.
- Market conditions: Rents soft (-1.5%/yr); 334 active listings in the ZIP; 40 comparable units currently listed for rent nearby; rentals at typical pace (median 25d on market — plan ~3-4 weeks tenant-placement turnaround); 40% of comp listings sitting > 30 days — soft ceiling on asking rent; solid renter incomes; 19,697 units permitted in Los Angeles County in 2024 (9,426 in 5+ unit buildings).
- At $9,360/mo this rent would consume 117% of the median local household income ($96k/yr) (locally 5563% of renters already pay >50% of income on rent) — very limited rent-growth headroom before tenants either downsize or default.
Forward outlook
- Local home prices are declining (-3.0%/yr); year-one equity from $9k of loan paydown is wiped out by about $39k of value loss. Plan a longer hold.
- Los Angeles County population projected at +9% by 2050 — modest demand growth; plan on rents tracking national, not racing it.
Negotiation context
- It's been on market 142 days — a 12% lower offer ($1.14M) is reasonable based on typical stale-listing flexibility.
- Current owner paid $330k; list at $1.30M implies a 294% gain — meaningful room to come down on a strong offer.
Risks & watch-outs
- Watch-outs: built in 1940 — expect roof / HVAC / electrical / plumbing capex.
- Climate carrying-cost: extreme-heat days projected 7→22/yr by 2055 (HVAC capex compounding) — expect insurance premiums to compound above CPI over the hold.
Questions for the listing agent
- What do current leases actually rent for vs. the listed asking? Can we see a recent rent roll and the last 12 months of T-12 income?
- It's been on market 142 days. Have you received any prior offers? Is the seller open to a 28% concession, seller financing, or rate buy-down credit?
- Can we see the unit-by-unit rent roll, current vacancy, and any below-market leases? What's the average tenancy length?
- What capital expenditures (roof, boiler, parking lot, exteriors) have been made in the last 5 years, and what's planned in the next 2?
- Built in 1940 — when were the roof, HVAC, electrical panel, plumbing, and water heater last replaced?
- Why hasn't it sold? Are there any deal-killer items the seller is aware of (foundation, flood, title, zoning, code violations)?
- Is there a deadline driving the sale (1031 exchange, divorce, estate, relocation)? That informs how much negotiation room exists.
- Schools are D-rated, which usually means shorter tenancies and higher turnover. Who's the typical renter profile here, and what's been the actual vacancy rate?
- Crime grade is F in this area — have there been break-ins, vandalism, or insurance claims at this property in the last 3 years? What carrier currently insures it and at what premium?
- The area grade is low — what's the realistic commute time and amenity access for the typical tenant pool here? Any planned neighborhood developments (good or bad) we should know about?
- What's the average days-on-market for RENTAL listings here right now (not sales)? A rising rental-DOM trend means longer vacancies and softer asking-rent achievability than the comps imply.
- What's the recent tenant-quality profile in this submarket — average credit score on applications, eviction rate, late-payment / NSF rate, and stable-employment percentage? A property-management company in the area should have these aggregated.
- How much new apartment / multifamily construction is in the pipeline within 1–3 miles? Heavy new supply (>2% of stock underway) typically softens rents 12–24 months out; light construction supports rent growth.
Investment metrics
- 1% rule
- 0.72% ✗
- Cap rate
- 5.72%
- Cash-on-cash
- -2.05%
- DSCR
- 0.91
- GRM
- 11.6
CMA / ARV
- ARV (median comp)
- $1,654,304
- List price
- $1,300,000
- Delta
- -21.42%
- Verdict
- UNDERPRICED
- Comps
- 20 within 1.0 mi
Show comp detail 12 sales within ~0.75 mi
| Address | Dist | Beds/Ba | Sqft | Sold | Price | $/sf | Match |
|---|---|---|---|---|---|---|---|
| 822-824 N Stanley | 0.41mi | 4/4.0 | 2,451 (+3%) | 4mo | $2,100,000 | $857 | 72 |
| 7621 Norton Ave | 0.56mi | 5/4.0 (+1) | 2,353 (-1%) | 2mo | $1,982,500 | $843 | 66 |
| 506 N Poinsettia Pl | 0.40mi | 3/2.0 (-1) | 2,303 (-3%) | 3mo | $1,700,000 | $738 | 61 |
| 616 N Vista St | 0.32mi | 4/2.0 | 2,277 (-4%) | 14mo | $1,380,000 | $606 | 59 |
| 828 N Sycamore Ave | 0.37mi | 4/2.0 | 2,388 (+1%) | 19mo | $1,380,000 | $578 | 58 |
| 539 N Poinsettia Pl | 0.33mi | 5/3.0 (+1) | 2,602 (+10%) | 9mo | $1,750,000 | $673 | 52 |
| 812 N Genesee Ave | 0.53mi | 4/2.0 | 2,212 (-7%) | 9mo | $1,520,000 | $687 | 49 |
| 859 N Mansfield Ave | 0.47mi | 5/5.0 (+1) | 2,419 (+2%) | 21mo | $1,550,000 | $641 | 49 |
| 812 N Mccadden Pl | 0.68mi | 4/2.0 | 2,437 (+3%) | 10mo | $1,385,000 | $568 | 47 |
| 951 N Martel Ave | 0.21mi | 4/2.0 | 2,058 (-13%) | 18mo | $1,400,000 | $680 | 45 |
| 7317 Fountain Ave | 0.57mi | 4/3.5 | 2,107 (-11%) | 14mo | $3,300,000 | $1,566 | 40 |
| 1301 N Orange Dr | 0.70mi | 5/3.0 (+1) | 2,623 (+10%) | 12mo | $1,046,000 | $399 | 30 |
Match score weights: distance 35% · size 25% · config 20% · recency 20%. Top-matched comps best support the ARV.
Projected returns pro-forma
-3.0% appreciation · 0.0% rent growth · sell at horizon
- IRR
- -22.8%
- Equity multiple
- 0.24×
- Total profit
- $-278,206
- Equity at exit
- $193,834
- IRR
- -26.0%
- Equity multiple
- -0.10×
- Total profit
- $-401,182
- Equity at exit
- $112,400
Cash invested: $364,000 (down + closing). Projections, not guarantees.
Landlord ↔ Tenant lean methodology
- Overall (CITY)
- 0 Strongly Tenant-Friendly
- State California
- 18 Strongly Tenant-Friendly · D+13
- County
- — inherits STATE
- City Los Angeles
- 0 Strongly Tenant-Friendly · D+22
ZIP-level market 90046
- Rents YoY
- -1.5%
- Active inventory
- 334
- Price-to-rent
- 46.3×
Monthly cashflow live
- Estimated rent
- $9,360 high interval (Pro) →
- Mortgage (P&I)
- −$6,817
- Tax from tax record
- −$658 /mo · $7,898/yr
- Insurance
- −$542
- HOA
- −$0
- Vacancy / Maint / Mgmt
- −$1,966
- Net cashflow
- $-623
Break-even live
4-unit breakdown (identical units grouped — click to expand)
| Units | Beds | Baths | Est. rent |
|---|---|---|---|
| 4× units | 1 | 1 | $9,360 |
| #1 | 1 | 1 | $2,340 |
| #2 | 1 | 1 | $2,340 |
| #3 | 1 | 1 | $2,340 |
| #4 | 1 | 1 | $2,340 |
| Total (4 units) | $9,360 | ||
UW: 25.0% down · 7.5% · 30yr · 1.5% tax · 5.0% vac · 8.0% maint · 8.0% mgmt
Financing live
Cash to close
- Down payment
- $325,000
- Closing costs
- $39,000
- Reserves months
- —
- Total cash needed
- —
Loan-product check · same deal, 3 products live
Conventional
25% down · 7.5% · 30yr
- Down + closing
- —
- Monthly P&I
- —
- Monthly cashflow
- —
- DSCR
- —
- Eligible?
- —
Personal DTI + credit; lowest rate.
DSCR
20% down · 8.5% · 30yr
- Down + closing
- —
- Monthly P&I
- —
- Monthly cashflow
- —
- DSCR
- —
- Eligible?
- —
No personal income docs; deal must DSCR.
Hard money
10% down · 12.0% · 12mo
- Down + closing
- —
- Monthly P&I
- —
- Monthly cashflow
- —
- DSCR
- —
- Eligible?
- —
Short-term bridge; refi at stabilization.
Rent comps 40 comps
| Address | Beds | Baths | Sqft | Rent | $/sqft | DOM | Units | Dist |
|---|---|---|---|---|---|---|---|---|
| 850 N Poinsettia Pl #2 Los Angeles, CA | 3.0 | 3.0 | 1623 | $4,495 | $2.77 | 43d | 1 | 0.06mi |
| 849 N Alta Vista Blvd Los Angeles, CA | 4.0 | 3.5 | 2000 | $7,500 | $3.75 | 15d | 1 | 0.08mi |
| 846 N Alta Vista Blvd #106 Los Angeles, CA | 3.0 | 2.5 | 2030 | $6,495 | $3.20 | 43d | 1 | 0.11mi |
| 846 N Alta Vista Blvd #105 Los Angeles, CA | 3.0 | 3.0 | 1660 | $6,250 | $3.77 | 43d | 1 | 0.11mi |
| 712 N Vista St Los Angeles, CA | 3.0 | 2.0 | 1608 | $7,500 | $4.66 | 19d | 1 | 0.21mi |
| 620 N Poinsettia Pl Los Angeles, CA | 4.0 | 3.0 | 2000 | $7,500 | $3.75 | 43d | 1 | 0.24mi |
| 616 N Formosa Ave Los Angeles, CA | 5.0 | 4.0 | 2898 | $10,750 | $3.71 | 22d | 1 | 0.30mi |
| 616 N Formosa Ave Los Angeles, CA | 5.0 | 4.0 | 2898 | $10,750 | $3.71 | 24d | 1 | 0.30mi |
| 7316 Santa Monica Blvd West Hollywood, CA | 3.0 | 1.0–3.0 | 1235 | $4,550 | $3.68 | 2d | 1 | 0.31mi |
| 835 N Sycamore Ave Los Angeles, CA | 3.0 | 4.0 | 2172 | $7,495 | $3.45 | 43d | 1 | 0.34mi |
| 835 N Sycamore Ave Los Angeles, CA | 3.0 | 4.0 | 2172 | $6,750 | $3.11 | 7d | 1 | 0.34mi |
| 521 N Martel Ave Los Angeles, CA | 4.0 | 4.0 | 2100 | $8,500 | $4.05 | 43d | 1 | 0.38mi |
| 1123 Formosa Ave #3 West Hollywood, CA | 3.0 | 3.0 | 1700 | $5,795 | $3.41 | 20d | 1 | 0.40mi |
| 542 N Sierra Bonita Ave Los Angeles, CA | 5.0 | 4.0 | 2474 | $7,500 | $3.03 | 43d | 1 | 0.42mi |
| 923 N Stanley Ave Unit A+B West Hollywood, CA | 5.0 | 3.0 | 2500 | $8,395 | $3.36 | 15d | 1 | 0.46mi |
| 923 N Stanley Ave Unit A+B West Hollywood, CA | 5.0 | 3.0 | 2500 | $5,695 | $2.28 | 7d | 1 | 0.46mi |
| 1207 Greenacre Ave West Hollywood, CA | 3.0 | 3.0 | 2000 | $10,950 | $5.47 | 16d | 1 | 0.47mi |
| 1144 N Detroit St #7 West Hollywood, CA | 3.0 | 3.5 | 1690 | $7,000 | $4.14 | 43d | 1 | 0.48mi |
| 7621 Norton Ave West Hollywood, CA | 3.0 | 2.5 | 1900 | $6,200 | $3.26 | 3d | 1 | 0.57mi |
| 450 N Orange Dr Unit U Los Angeles, CA | 3.0 | 3.0 | 2140 | $6,975 | $3.26 | 7d | 1 | 0.60mi |
| 1214 N Sycamore Ave Los Angeles, CA | 3.0 | 3.5 | 2000 | $5,495 | $2.75 | 43d | 1 | 0.62mi |
| 1228 N Sycamore Ave Los Angeles, CA | 3.0 | 3.5 | 2000 | $5,995 | $3.00 | 24d | 1 | 0.63mi |
| 1318 N Vista St Los Angeles, CA | 3.0 | 3.5 | 1741 | $5,995 | $3.44 | 43d | 1 | 0.63mi |
| 822 N Orange Grove Ave Los Angeles, CA | 4.0 | 3.5 | 1938 | $8,500 | $4.39 | 24d | 1 | 0.65mi |
| 824 N Orange Grove Ave Los Angeles, CA | 4.0 | 3.5 | 1938 | $8,500 | $4.39 | 24d | 1 | 0.65mi |
| 634 N Highland Ave Los Angeles, CA | 3.0 | 3.0 | 2242 | $9,500 | $4.24 | 22d | 1 | 0.65mi |
| 1239 N Orange Dr Unit 1237 1/2 Los Angeles, CA | 4.0 | 4.5 | 1933 | $5,495 | $2.84 | 43d | 1 | 0.66mi |
| 1239 N Orange Dr Unit 1237 Los Angeles, CA | 4.0 | 4.5 | 1776 | $5,729 | $3.23 | 43d | 1 | 0.66mi |
| 1239 N Orange Dr Unit 1237 3/4 Los Angeles, CA | 4.0 | 4.5 | 1600 | $5,271 | $3.29 | 43d | 1 | 0.66mi |
| 1237 N Orange Dr Unit B Los Angeles, CA | 4.0 | 4.5 | 1933 | $5,404 | $2.80 | 7d | 1 | 0.67mi |
| 836 N McCadden Pl Los Angeles, CA | 3.0 | 1.5 | 1966 | $7,000 | $3.56 | 15d | 1 | 0.67mi |
| 1400 N Fuller Ave #8 Los Angeles, CA | 3.0 | 4.0 | 2195 | $6,250 | $2.85 | 16d | 1 | 0.69mi |
| 419 N Spaulding Ave Unit 427 Los Angeles, CA | 3.0 | 2.0 | 1800 | $4,250 | $2.36 | 24d | 1 | 0.70mi |
| 1410 N Poinsettia Pl Los Angeles, CA | 3.0 | 3.5 | 1837 | $6,500 | $3.54 | 4d | 1 | 0.70mi |
| 455 N Highland Ave Los Angeles, CA | 5.0 | 4.0 | 2950 | $13,695 | $4.64 | 18d | 1 | 0.71mi |
| 342 N Orange Dr Los Angeles, CA | 3.0 | 2.0 | 2323 | $6,575 | $2.83 | 43d | 1 | 0.72mi |
| 743 N Las Palmas Ave Los Angeles, CA | 3.0 | 2.0 | 1910 | $5,794 | $3.03 | 44d | 1 | 0.72mi |
| 743 N Las Palmas Ave Los Angeles, CA | 3.0 | 2.0 | 1910 | $5,494 | $2.88 | 43d | 1 | 0.72mi |
| 809 N Cherokee Ave Unit 1/2 Los Angeles, CA | 4.0 | 4.0 | 2000 | $5,495 | $2.75 | 11d | 1 | 0.78mi |
| 137 N Poinsettia Pl Los Angeles, CA | 4.0 | 4.0 | 2503 | $9,000 | $3.60 | 24d | 1 | 0.78mi |
Listing history 16 events
-
2026-06-18days on market $1,300,000 Active 142 DOM
-
2026-06-17days on market $1,300,000 Active 141 DOM
-
2026-06-16days on market $1,300,000 Active 140 DOM
-
2026-06-15days on market $1,300,000 Active 139 DOM
-
2026-06-13days on market $1,300,000 Active 137 DOM
-
2026-06-09days on market $1,300,000 Active 133 DOM
-
2026-06-08days on market $1,300,000 Active 132 DOM
-
2026-06-07days on market $1,300,000 Active 131 DOM
-
2026-06-04days on market $1,300,000 Active 128 DOM
-
2026-06-03days on market $1,300,000 Active 127 DOM
-
2026-06-02days on market $1,300,000 Active 126 DOM
-
2026-06-01days on market $1,300,000 Active 125 DOM
-
2026-05-31days on market $1,300,000 Active 124 DOM
-
2026-01-27$1,300,000 Active 1236-char remark
Show marketing remark (1236 chars)
We are pleased to present a very rare opportunity to acquire 833 N Poinsettia Pl, a West Hollywood-adjacent 4-Unit multifamily building. Available for the first time since 1988, the property is ideally situated between Santa Monica Blvd and Melrose Ave, within close distance to some of Los Angeles' most iconic dining, nightlife, and shopping destinations. 833 N Poinsettia Pl boasts a prime location with exceptionally high tenant demand and easy access to other coveted employer hubs including Beverly Hills, Century City, Hollywood, and the Miracle Mile. This property sits on a 7,349 Square Foot lot with 2,374 Square Feet of gross building area. The property consists of Four (1) One-Bedroom Units that are each individually metered for utilities. Tenants also benefit from Six (6) on-site private parking spots, Four (4) garage spots and Two (2)along the driveway, as well as dedicated storage areas. This is a rare opportunity to acquire a coveted asset in one of the most competitive rental submarkets in Los Angeles. With current rents approximately 58% below market, the property provides clear value-add potential for investors, while also offering significant existing cash flow and strong long-term appreciation potential.
-
1988-11-18soldstatus $330,000
-
1988-11-18soldstatus $330,000
ⓘ Source: listings_history table (triggers on properties + properties_extension) + one-shot
backfill from property_details.listing_events for pre-trigger history.
Tax reassessment forecast CA · Resets to sale price
- Current annual tax
- $7,898 · $658/mo
- Projected year-2 tax
- $9,880 · $823/mo
- Expected delta
- +$1,982/yr (+$165/mo · 25.1%)
ⓘ Screening estimate from a state-policy table — verify with the county assessor before closing.
Climate risk First Street
- Flood 1/10 Low FEMA zone X (unshaded) · 0% chance over 30 yrs
- Wildfire 1/10 Low
- Heat 6/10 Major 7 d/yr ≥90°F today · 22 d/yr by 30 yrs out
- Wind 1/10 Low
- Air quality 5/10 Major 8 unhealthy d/yr today · 8 by 30 yrs out
Nearby sold comps map
Loading sold comps map…
Walkable amenities ~0.75 mi
Loading nearby amenities…
Taxation est. · year 1
- Rental income
- $112,320
- − Mortgage interest
- −$72,820
- − Property taxes
- −$7,898
- − Insurance
- −$6,500
- − Repairs & maintenance
- −$8,986
- − Management
- −$8,986
- − Depreciation
- −$37,818
- Taxable loss
- −$30,688
- Est. tax savings @ 24.0%
- +$7,365
- After-tax cash flow
- $-109/yr
For passive investors: Depreciation is non-cash, so a rental often shows a tax loss while cash-flowing — sheltering income. Rental losses are passive: they offset passive income freely, and up to $25,000/yr can offset ordinary (W-2) income if you actively participate and your MAGI is under $100k (phasing out to $0 by $150k); unused losses carry forward. On sale, claimed depreciation is recaptured at up to 25%, and gains may owe capital-gains tax (a 1031 exchange can defer both). Figures are a year-1 estimate at your 24.0% rate — not tax advice; consult a CPA.
Schools (NCES district)
- District
- Los Angeles Unified
- NCES district ID
- 0622710
- Math proficiency
- 29% ▼ -4.00%
- Reading proficiency
- 54% ▲ 10.00%
- Median HH income
- $50,403
- Composite
- 35.67/100
- National rank
- #4875
- State rank
- #223 of 517 in CA
Livability — Los Angeles
- Score
- 68/100
- State rank
- #273
- US rank
- #9237
Category grades
Schools grade is shown separately in the Schools card above.
Census & demographics
- Census place
- Los Angeles, CA
- County
- Los Angeles County · 9,444,647 people
- City population
- 3,838,149
- Metro
- Los Angeles-Long Beach-Anaheim, CA
- Population (ZIP)
- 48,296
- Household income
- $96,250
- Rent vs Own
- Severe rent burden
- 5563.0
Population outlook (Los Angeles County) Hauer SSP2
- Today (2025)
- 10,940,515 people
- By 2030
- 11,256,481 · +2.9%
- By 2040
- 11,729,929 · +7.2%
- By 2050
- 11,948,407 · +9.2%
- By 2075
- 11,818,114 · +8.0%
- By 2100
- 10,842,928 · -0.9%
Race, ethnicity, and origin ACS 2023
- Neighborhood character
- Majority White (65%)
- Race & ethnicity
- White 65% Hispanic / Latino 16% Two or more races 13% Asian 7% Black 5%
- Hispanic origin (detail)
- Mexican 8% Puerto Rican 1%
- Common ancestry
- Scotch-Irish 6% Lithuanian 4% Romanian 4%
- Foreign-born
- 26% · Canada, China, South Korea
- Languages at home
- 71% English-only · Spanish 9% Russian/Polish/Slavic 8% Other Indo-European 3%
Political lean MEDSL · Los Angeles
- 2024 margin
- Solid D (+32.9) · D 64.8% · R 31.9% · Other 3.3%
- 2008→2024 swing
- -7.4pp toward R · 2008: 40.4pp · 2024: 32.9pp
- All cycles
- 2024: D+32.9 2020: D+44.2 2016: D+48.0 2012: D+40.0 2008: D+40.4
Not yet ingested
- Civics
- —
Market trends
- HPI YoY
- ▼ -571.28%
- Current HPI
- 365.8036
- Rent YoY
- ▼ -1.48%
- Metro
- Los Angeles-Long Beach-Anaheim, CA
- State GDP YoY
- ▲ 3.21%
- F500 in state
- 116
Industry mix (Fortune 500 HQ in CA)
| Industry | F500 HQs | Revenue |
|---|---|---|
| Technology | 27 | $1,492B |
|
||
| Financial Services | 3 | $174B |
|
||
| Retail | 3 | $44B |
|
||
| Insurance | 3 | $26B |
|
||
| Media / Entertainment | 2 | $115B |
|
||
| Pharmaceuticals / Biotech | 2 | $62B |
|
||
Price history
+293.9% since first listed3 events — show timeline
- 2026-01-27 Listed $1,300,000 TheMLS
- 1988-11-18 Sold (Public Records) $330,000 Public Records
- 1988-11-18 Sold (Public Records) $330,000 Public Records
Property tax history
+1.6%/yrLatest (2025): $7,898 · +1.0% YoY. Source: county tax records.
Cash-flow waterfall
monthlySold comps — $/sqft
last 12 mo · ≤1 miLoading sold comps…