 Duplex
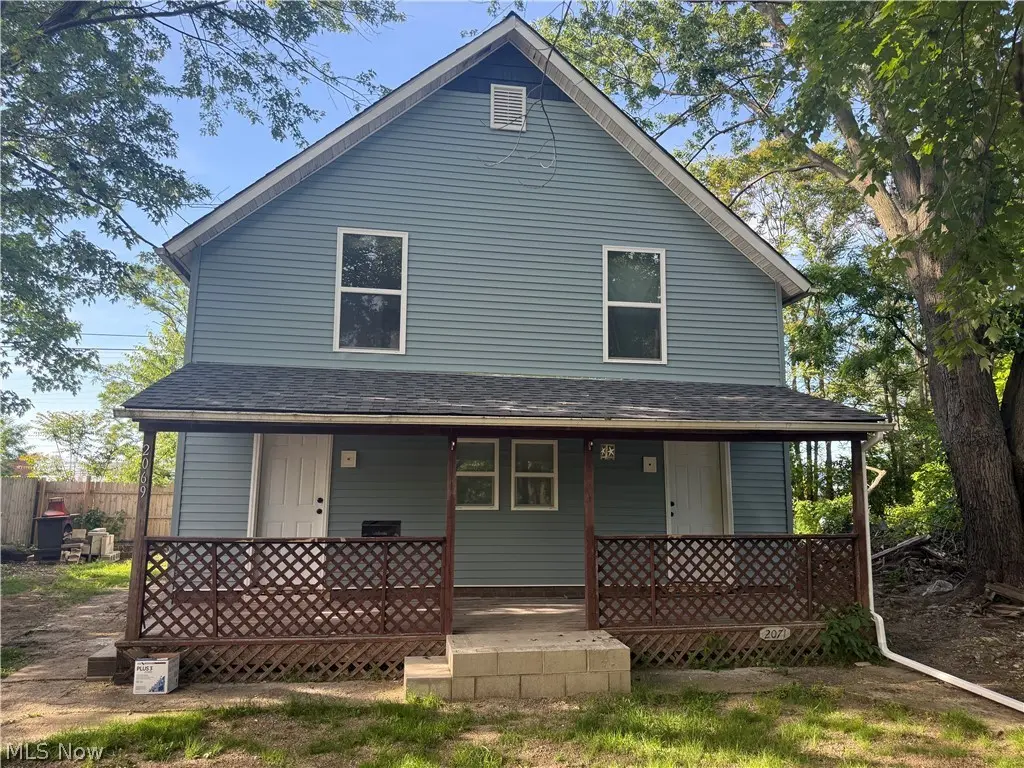
2069 E 29th St · Lorain, OH
Flood risk No data
- FEMA flood zone
- —
- Chance of flooding over 30 yrs
- —
- Est. flood insurance / yr
- —
Fire risk No data
- Est. fire insurance / yr
- —
Heat risk No data
- Hot days now (above threshold)
- —
- Hot days in 30 yrs
- —
Wind risk No data
- Chance of severe wind over 30 yrs
- —
Air-quality risk No data
- Unhealthy air days now
- —
- Unhealthy air days in 30 yrs
- —
Risk factors via First Street. Map © Google.
Why this score? — see what drove the C grade
The composite is a weighted blend of 9 inputs, each scored 0–100. Each bar is that input's sub-score; the figure is the points it added to the 100-point composite (weight × sub-score).
- Cash flow +28.6/30.0
- DSCR +10.0/10.0
- 1% rule +7.2/10.0
- Livability +3.4/5.0
- Rent growth +2.5/5.0
- Condition / age +2.5/5.0
- Schools +1.6/10.0
- ARV discount +0.0/15.0
- Appreciation +0.0/10.0
$170,000
🖨 Deal sheet 📄 Offer letter ✓ Due diligence
Multi-family units
County records classify this as Multi-Family (2-4 Unit). Listing-text estimate: 2 units. confirmed
Listing remarks
Discover a classic 2-story duplex with updated appeal in Lorain. This side-by-side opportunity offers a total of 4 bedrooms and 2 bathrooms across approximately 1,664 sq ft on a manageable lot. The property is in the finishing stages of a thoughtful renovation. Each unit features comfortable living spaces, natural light, and functional layouts. Exterior updates and interior refreshes are in progress, aiming to provide a clean move in opportunity for investors looking to add to their portfolio or someone looking to live on one side and rent out the other.
Key facts
- Natural light
- Classic duplex
- Functional layouts
Tags
Property features AI
Finance
- Financial info: Annual tax amount listed (2025)
Exterior
- Parking: Driveway
- Utilities: Public water; Public sewer
- Home design: 2-story home; Above-grade finished area approximately 1,664
- Construction: Vinyl siding; Asphalt and fiberglass roof; Block foundation; Built per public records
- Exterior features: Lot of approximately 0.17 acres; Public records lot information
Interior
- Bathrooms: 2 full bathrooms
- Heating & cooling: Gas heating
- Interior features: Unfinished basement; Total of 8 rooms; One building on the property
Neighborhood map
What this means for you Summary
Snapshot
- This is a 2 × 2-bed/1.0-bath units multifamily listed at $170k.
Deal economics
- At list price, monthly cash flow is $561 ($7k/yr) — positive. Per door: $280/mo.
- The deal already cash-flows at list — no discount required.
- Meets the 1% rule at list price ($2k rent vs $170k).
- Cap rate 10.3% vs local median 5.9% in Lorain — top-decile yield for the area; either an underpriced asset or a hidden risk that comps aren't pricing in. Stress-test before assuming the spread holds.
Location & tenants
- Location reads 67/100 on livability (#595 in OH) — a middle-class / working-renter tenant base. Strengths: cost of living A+, housing A+; Watch: schools C-, amenities D, health & safety D.
- Lorain City (suburban): math 13% / reading 26% proficiency, ranked #633 of 656 in OH (top 96%) — low school quality limits family demand, transient renter base, plan for 1-2y turnover; 80% free/reduced lunch — lower-income household profile, screen leases tightly.
- Market conditions: 81 active listings in the ZIP; 9 comparable units currently listed for rent nearby; rentals lingering (median 44d on market — plan ~5-8 weeks vacancy on turnover, expect pricing pressure); 67% of comp listings sitting > 30 days — soft ceiling on asking rent; lower-income renter base — watch delinquency; 1,098 units permitted in Lorain County in 2024 (20 in 5+ unit buildings).
- At $2,066/mo this rent would consume 61% of the median local household income ($41k/yr) (locally 1140% of renters already pay >50% of income on rent) — very limited rent-growth headroom before tenants either downsize or default.
Forward outlook
- Local home prices are declining (-3.0%/yr); year-one equity from $1k of loan paydown is wiped out by about $5k of value loss. Plan a longer hold.
- At projected returns (-3.0% appreciation + 3.0% rent growth), your $48k cash investment doubles in ~9 years — after that, you're playing with house money.
Negotiation context
- Only 14 days on market — expect competitive offers; lowballing is unlikely to land.
- Current owner paid $31k; list at $170k implies a 448% gain — meaningful room to come down on a strong offer.
Risks & watch-outs
- Watch-outs: built in 1900 — expect roof / HVAC / electrical / plumbing capex.
Questions for the listing agent
- Can we see the unit-by-unit rent roll, current vacancy, and any below-market leases? What's the average tenancy length?
- What capital expenditures (roof, boiler, parking lot, exteriors) have been made in the last 5 years, and what's planned in the next 2?
- Built in 1900 — when were the roof, HVAC, electrical panel, plumbing, and water heater last replaced?
- Is there a deadline driving the sale (1031 exchange, divorce, estate, relocation)? That informs how much negotiation room exists.
- Crime grade is F in this area — have there been break-ins, vandalism, or insurance claims at this property in the last 3 years? What carrier currently insures it and at what premium?
- What's the average days-on-market for RENTAL listings here right now (not sales)? A rising rental-DOM trend means longer vacancies and softer asking-rent achievability than the comps imply.
- What's the recent tenant-quality profile in this submarket — average credit score on applications, eviction rate, late-payment / NSF rate, and stable-employment percentage? A property-management company in the area should have these aggregated.
- How much new apartment / multifamily construction is in the pipeline within 1–3 miles? Heavy new supply (>2% of stock underway) typically softens rents 12–24 months out; light construction supports rent growth.
Investment metrics
- 1% rule
- 1.22% ✓
- Cap rate
- 10.25%
- Cash-on-cash
- 14.14%
- DSCR
- 1.63
- GRM
- 6.9
CMA / ARV
- ARV (on-the-fly)
- $134,784
- Comps found
- 8
Show comp detail 8 sales within ~0.75 mi
| Address | Dist | Beds/Ba | Sqft | Sold | Price | $/sf | Match |
|---|---|---|---|---|---|---|---|
| 1923 E 34th St | 0.49mi | 4/2.0 | 1,680 (+1%) | 21mo | $145,000 | $86 | 58 |
| 2224 E 31st St | 0.36mi | 3/2.0 (-1) | 1,569 (-6%) | 18mo | $100,000 | $64 | 54 |
| 1877-1879 E 34th St | 0.57mi | 4/2.0 | 1,780 (+7%) | 11mo | $132,500 | $74 | 52 |
| 2323/2325 Homewood Dr | 0.71mi | 4/2.0 | 1,792 (+8%) | 4mo | $135,000 | $75 | 50 |
| 2315/2317 Homewood Dr | 0.70mi | 4/2.0 | 1,792 (+8%) | 6mo | $125,000 | $70 | 49 |
| 2374 E 37th St | 0.71mi | 4/2.0 | 1,792 (+8%) | 6mo | $145,000 | $81 | 49 |
| 3884 Gary Ave | 0.74mi | 4/2.0 | 1,792 (+8%) | 9mo | $145,000 | $81 | 45 |
| 1829-1831 E 34th St | 0.66mi | 4/2.0 | 1,440 (-14%) | 18mo | $125,000 | $87 | 32 |
Match score weights: distance 35% · size 25% · config 20% · recency 20%. Top-matched comps best support the ARV.
Projected returns pro-forma
-3.0% appreciation · 3.0% rent growth · sell at horizon
- IRR
- 4.4%
- Equity multiple
- 1.17×
- Total profit
- $8,141
- Equity at exit
- $25,348
- IRR
- 13.9%
- Equity multiple
- 2.11×
- Total profit
- $52,954
- Equity at exit
- $14,698
Cash invested: $47,600 (down + closing). Projections, not guarantees.
Landlord ↔ Tenant lean methodology
- Overall (STATE)
- 73 Landlord-Friendly
- State Ohio
- 73 Landlord-Friendly · R+6
- County
- — inherits STATE
- City
- — inherits STATE
ZIP-level market 44055
- Home prices YoY
- -30.5%
- Active inventory
- 81
- Price-to-rent
- 13.7×
Monthly cashflow live
- Estimated rent
- $2,066 high interval (Pro) →
- Mortgage (P&I)
- −$891
- Tax from tax record
- −$109 /mo · $1,307/yr
- Insurance
- −$71
- HOA
- −$0
- Vacancy / Maint / Mgmt
- −$434
- Net cashflow
- $561
Break-even live
2-unit breakdown (identical units grouped — click to expand)
| Units | Beds | Baths | Est. rent |
|---|---|---|---|
| 2× units | 2 | 1 | $2,066 |
| #1 | 2 | 1 | $1,033 |
| #2 | 2 | 1 | $1,033 |
| Total (2 units) | $2,066 | ||
UW: 25.0% down · 7.5% · 30yr · 1.5% tax · 5.0% vac · 8.0% maint · 8.0% mgmt
Financing live
Cash to close
- Down payment
- $42,500
- Closing costs
- $5,100
- Reserves months
- —
- Total cash needed
- —
Loan-product check · same deal, 3 products live
Conventional
25% down · 7.5% · 30yr
- Down + closing
- —
- Monthly P&I
- —
- Monthly cashflow
- —
- DSCR
- —
- Eligible?
- —
Personal DTI + credit; lowest rate.
DSCR
20% down · 8.5% · 30yr
- Down + closing
- —
- Monthly P&I
- —
- Monthly cashflow
- —
- DSCR
- —
- Eligible?
- —
No personal income docs; deal must DSCR.
Hard money
10% down · 12.0% · 12mo
- Down + closing
- —
- Monthly P&I
- —
- Monthly cashflow
- —
- DSCR
- —
- Eligible?
- —
Short-term bridge; refi at stabilization.
Rent comps 9 comps
| Address | Beds | Baths | Sqft | Rent | $/sqft | DOM | Units | Dist |
|---|---|---|---|---|---|---|---|---|
| 3237 Grove Ave Unit 3235 Lorain, OH | 3.0 | 1.0 | 1080 | $950 | $0.88 | 21d | 1 | 0.39mi |
| 3235 Grove Ave Unit 3235 Lorain, OH | 3.0 | 1.0 | 1080 | $950 | $0.88 | 21d | 1 | 0.40mi |
| 1818 E 29th St Unit 1816 Lorain, OH | 3.0 | 1.0 | 1098 | $1,195 | $1.09 | 43d | 1 | 0.56mi |
| 1813 E 30th St Lorain, OH | 4.0 | 1.0 | 1344 | $1,450 | $1.08 | 43d | 1 | 0.57mi |
| 1730 E 30th St Unit 1730 Lorain, OH | 3.0 | 1.0 | 1120 | $1,250 | $1.12 | 43d | 1 | 0.78mi |
| 1763 E 36th St Lorain, OH | 5.0 | 1.5 | 2000 | $1,895 | $0.95 | 1d | 1 | 0.82mi |
| 3251 Camden Ave Lorain, OH | 3.0 | 1.0 | 1090 | $995 | $0.91 | 43d | 1 | 0.87mi |
| 2484 E 38th St Lorain, OH | 3.0 | 1.5 | 1101 | $1,295 | $1.18 | 43d | 1 | 0.89mi |
| 1639 E 31st St Unit 1637 Lorain, OH | 3.0 | 1.0 | 1500 | $1,200 | $0.80 | 43d | 1 | 1.01mi |
Listing history 10 events
-
2026-06-15status $170,000 Pending 14 DOM
-
2026-06-15days on market $170,000 Active 14 DOM
-
2026-06-13days on market $170,000 Active 12 DOM
-
2026-06-13days on market $170,000 Active 11 DOM
-
2026-06-09days on market $170,000 Active 8 DOM
-
2026-06-08days on market $170,000 Active 7 DOM
-
2026-06-07days on market $170,000 Active 6 DOM
-
2026-06-03days on market $170,000 Active 2 DOM
-
2026-06-02remarks 560-char remark
-
2026-06-02$170,000 Active 1 DOM
ⓘ Source: listings_history table (triggers on properties + properties_extension) + one-shot
backfill from property_details.listing_events for pre-trigger history.
Tax reassessment forecast OH · Partial reset (capped growth)
- Current annual tax
- $1,307 · $109/mo
- Projected year-2 tax
- $1,980 · $165/mo
- Expected delta
- +$672/yr (+$56/mo · 51.4%)
ⓘ Screening estimate from a state-policy table — verify with the county assessor before closing.
Nearby sold comps map
Loading sold comps map…
Walkable amenities ~0.75 mi
Loading nearby amenities…
Taxation est. · year 1
- Rental income
- $24,792
- − Mortgage interest
- −$9,523
- − Property taxes
- −$1,307
- − Insurance
- −$850
- − Repairs & maintenance
- −$1,983
- − Management
- −$1,983
- − Depreciation
- −$4,945
- Taxable income
- $4,200
- Est. tax owed @ 24.0%
- −$1,008
- After-tax cash flow
- $5,722/yr
For passive investors: Depreciation is non-cash, so a rental often shows a tax loss while cash-flowing — sheltering income. Rental losses are passive: they offset passive income freely, and up to $25,000/yr can offset ordinary (W-2) income if you actively participate and your MAGI is under $100k (phasing out to $0 by $150k); unused losses carry forward. On sale, claimed depreciation is recaptured at up to 25%, and gains may owe capital-gains tax (a 1031 exchange can defer both). Figures are a year-1 estimate at your 24.0% rate — not tax advice; consult a CPA.
Schools (NCES district)
- District
- Lorain City
- NCES district ID
- 3904426
- Math proficiency
- 13% ▼ -24.00%
- Reading proficiency
- 26% ▼ -10.00%
- Median HH income
- $32,823
- Composite
- 15.81/100
- National rank
- #9266
- State rank
- #633 of 656 in OH
Livability — Lorain
- Score
- 67/100
- State rank
- #595
- US rank
- #10183
Category grades
Schools grade is shown separately in the Schools card above.
Census & demographics
- Census place
- Lorain, OH
- County
- Lorain County · 219,437 people
- City population
- 69,409
- Metro
- Cleveland-Elyria, OH
- Population (ZIP)
- 20,043
- Household income
- $40,636
- Rent vs Own
- Severe rent burden
- 1140.0
Population outlook (Lorain County) Hauer SSP2
- Today (2025)
- 314,924 people
- By 2030
- 317,546 · +0.8%
- By 2040
- 317,962 · +1.0%
- By 2050
- 312,872 · -0.7%
- By 2075
- 301,806 · -4.2%
- By 2100
- 278,271 · -11.6%
Race, ethnicity, and origin ACS 2023
- Neighborhood character
- Diverse neighborhood (Simpson 0.68)
- Race & ethnicity
- White 41% Hispanic / Latino 37% Two or more races 24% Black 14%
- Hispanic origin (detail)
- Mexican 7% Puerto Rican 27%
- Common ancestry
- Romanian 5% Slovak 1%
- Foreign-born
- 4% · Canada, Guatemala
- Languages at home
- 75% English-only · Spanish 23%
Political lean MEDSL · Lorain
- 2024 margin
- Lean R (+5.7) · D 46.7% · R 52.4%
- 2008→2024 swing
- -23.6pp toward R · 2008: 17.9pp · 2024: -5.7pp
- All cycles
- 2024: R+5.7 2020: R+2.5 2016: R+0.3 2012: D+14.4 2008: D+17.9
Not yet ingested
- Civics
- —
Market trends
- HPI YoY
- ▼ -79.26%
- Current HPI
- 180.9309
- Rent YoY
- —
- Metro
- Cleveland-Elyria, OH
- State GDP YoY
- ▲ 1.98%
- F500 in state
- 48
Industry mix (Fortune 500 HQ in OH)
| Industry | F500 HQs | Revenue |
|---|---|---|
| Insurance | 3 | $145B |
|
||
| Industrial Machinery | 3 | $49B |
|
||
| Financial Services | 3 | $24B |
|
||
| Consumer Goods | 2 | $93B |
|
||
| Aerospace / Defense | 2 | $47B |
|
||
| Utilities | 2 | $33B |
|
||
Price history
+448.4% since first listed2 events — show timeline
- 2026-06-01 Listed $170,000 MLSNOW
- 1999-07-26 Sold (Public Records) $31,000 Public Records
Property tax history
+4.5%/yrLatest (2025): $1,307 · -4.9% YoY. Source: county tax records.
Cash-flow waterfall
monthlySold comps — $/sqft
last 12 mo · ≤1 miLoading sold comps…