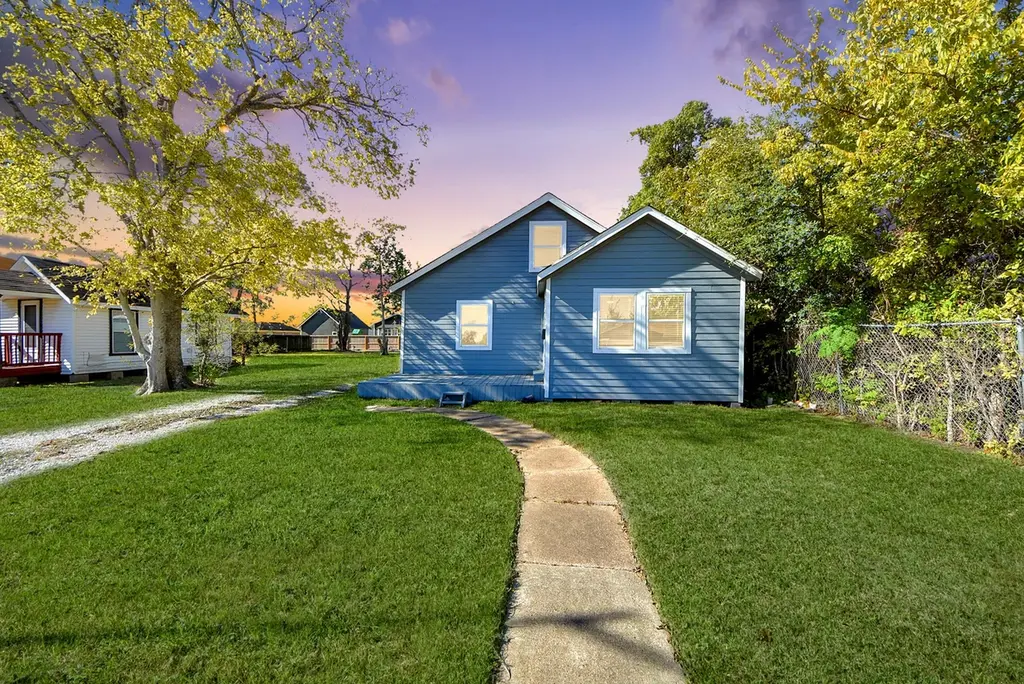
210 S 6th St · La Porte, TX
Flood risk 4/10 · Minor
- FEMA flood zone
- X (unshaded)
- Chance of flooding over 30 yrs
- 0.13%
- Est. flood insurance / yr
- $507 – $1,088
Fire risk 1/10 · Minimal
- Est. fire insurance / yr
- $1,222 – $2,270
Heat risk 9/10 · Severe
- Hot days now (above 108°F)
- 7 days/yr
- Hot days in 30 yrs
- 25 days/yr
Wind risk 9/10 · Severe
- Chance of severe wind over 30 yrs
- 99.0%
Air-quality risk 2/10 · Minimal
- Unhealthy air days now
- 1 days/yr
- Unhealthy air days in 30 yrs
- 2 days/yr
Risk factors via First Street. Map © Google.
Why this score? — see what drove the C- grade
The composite is a weighted blend of 9 inputs, each scored 0–100. Each bar is that input's sub-score; the figure is the points it added to the 100-point composite (weight × sub-score).
- Cash flow +15.5/30.0
- ARV discount +15.0/15.0
- 1% rule +5.4/10.0
- DSCR +4.8/10.0
- Schools +3.9/10.0
- Livability +3.5/5.0
- Rent growth +3.2/5.0
- Condition / age +2.5/5.0
- Appreciation +0.0/10.0
$189,000
🖨 Deal sheet (PDF) 📄 Offer letter ✓ Due diligence
Listing remarks MLS
This gorgeous gem with 3 bedrooms and 1 full bath is minutes away from the refineries and is looking for its next owner to come enjoy every square foot of it. Open living room with rustic laminate flooring. Beautiful white cabinetry throughout the kitchen with a refrigerator, dishwasher, and stove to go along with it. Washer and dryer connections in a separate area to make a laundry space. Standing shower for the bathroom. Comfortable carpet in the bedrooms and upstairs. Spacious backyard for all the family gatherings. Easy access to N Hwy 146. Schedule your private tour now, this one won't last!!
Key facts
- Spacious backyard
- Standing shower
- White cabinetry
Tags
Neighborhood map
What this means for you Summary
Snapshot
- This is a 3-bed/2.0-bath single-family listed at $189k.
Deal economics
- At list price, monthly cash flow is $77 ($925/yr) — positive.
- The deal already cash-flows at list — no discount required.
- Meets the 1% rule at list price ($2k rent vs $189k).
- Recommended offer: $166k (12.0% below list) — sets the bar for market timing.
- Cap rate 6.8% vs local median 3.4% in La Porte — top-decile yield for the area; either an underpriced asset or a hidden risk that comps aren't pricing in. Stress-test before assuming the spread holds.
Location & tenants
- Location reads 70/100 on livability (#360 in TX) — a middle-class / working-renter tenant base. Strengths: cost of living A+, housing A+, crime A-; Watch: schools D+, amenities F, commute F.
- La Porte ISD (suburban): math 41% / reading 44% proficiency, ranked #260 of 826 in TX (top 32%) — families likely to look elsewhere, expect single-tenant / working-renter base with shorter leases.
- Market conditions: Rents rising (+2.8%/yr); 337 active listings in the ZIP; 5 comparable units currently listed for rent nearby; rentals leasing fast (median 6d on market — plan ~1-2 weeks tenant-placement turnaround); solid renter incomes; 29,883 units permitted in Harris County in 2024 (8,621 in 5+ unit buildings).
Forward outlook
- Local home prices are declining (-3.0%/yr); year-one equity from $1k of loan paydown is wiped out by about $6k of value loss. Plan a longer hold.
- Harris County population projected at +47% by 2050 — long-run rental-demand tailwind backs the buy-and-hold thesis.
Negotiation context
- It's been on market 184 days — a 12% lower offer ($166k) is reasonable based on typical stale-listing flexibility.
- 5 sale attempts since 17y ago; this cycle's ask has dropped $11k (5%) from the opening price — seller is motivated, your offer sets the floor, not the list.
Risks & watch-outs
- Watch-outs: property tax is 2.6% of price; built in 1935 — expect roof / HVAC / electrical / plumbing capex.
- Climate carrying-cost: severe wind risk, 99% chance of damaging wind over 30y; extreme-heat days projected 7→25/yr by 2055 (HVAC capex compounding) — expect insurance premiums to compound above CPI over the hold.
Questions for the listing agent
- It's been on market 184 days. Have you received any prior offers? Is the seller open to a 12% concession, seller financing, or rate buy-down credit?
- Built in 1935 — when were the roof, HVAC, electrical panel, plumbing, and water heater last replaced?
- Property tax is high relative to price — has the assessment been appealed recently, and will the sale trigger a re-assessment?
- Why hasn't it sold? Are there any deal-killer items the seller is aware of (foundation, flood, title, zoning, code violations)?
- Is there a deadline driving the sale (1031 exchange, divorce, estate, relocation)? That informs how much negotiation room exists.
- Schools are D-rated, which usually means shorter tenancies and higher turnover. Who's the typical renter profile here, and what's been the actual vacancy rate?
- What's the average days-on-market for RENTAL listings here right now (not sales)? A rising rental-DOM trend means longer vacancies and softer asking-rent achievability than the comps imply.
- What's the recent tenant-quality profile in this submarket — average credit score on applications, eviction rate, late-payment / NSF rate, and stable-employment percentage? A property-management company in the area should have these aggregated.
- How much new for-sale + rental construction is in the pipeline within 1–3 miles? Heavy new supply typically softens prices + rents 12–24 months out; constrained supply supports both.
Investment metrics
- 1% rule
- 1.04% ✓
- Cap rate
- 6.78%
- Cash-on-cash
- 1.75%
- DSCR
- 1.08
- GRM
- 8.0
CMA / ARV
- ARV (median comp)
- $294,775
- List price
- $189,000
- Delta
- -35.88%
- Verdict
- UNDERPRICED
- Comps
- 20 within 1.0 mi
Show comp detail 12 sales within ~0.75 mi
| Address | Dist | Beds/Ba | Sqft | Sold | Price | $/sf | Match |
|---|---|---|---|---|---|---|---|
| 114 Dr Martin Luther King Jr Dr | 0.22mi | 3/2.0 | 1,752 (-7%) | 8mo | $315,000 | $180 | 71 |
| 302 Dr Martin Luther King Jr Dr | 0.34mi | 3/2.5 | 1,759 (-7%) | 5mo | $329,900 | $188 | 67 |
| 819 S 4th St | 0.57mi | 3/2.0 | 1,965 (+4%) | 4mo | $289,800 | $147 | 64 |
| 800 S 1st St | 0.59mi | 4/2.0 (+1) | 1,849 (-2%) | 1mo | $339,000 | $183 | 63 |
| 921 S 6th St | 0.65mi | 3/2.5 | 1,851 (-2%) | 3mo | $225,000 | $122 | 62 |
| 531 S 2nd St | 0.42mi | 3/2.0 | 1,720 (-9%) | 5mo | $250,000 | $145 | 61 |
| 416 S 1st St | 0.55mi | 4/2.0 (+1) | 1,800 (-5%) | 2mo | $323,900 | $180 | 59 |
| 407 San Jacinto St | 0.56mi | 4/2.0 (+1) | 1,849 (-2%) | 7mo | $339,000 | $183 | 59 |
| 422 N 7th Ave | 0.45mi | 3/2.5 | 1,720 (-9%) | 4mo | $264,000 | $153 | 59 |
| 135 S Virginia Ave | 0.51mi | 3/2.5 | 1,720 (-9%) | 3mo | $249,000 | $145 | 57 |
| 406 S Iowa St | 0.63mi | 4/2.0 (+1) | 1,800 (-5%) | 2mo | $323,900 | $180 | 55 |
| 403 Arizona St | 0.50mi | 3/2.5 | 1,650 (-13%) | 3mo | $320,000 | $194 | 51 |
Match score weights: distance 35% · size 25% · config 20% · recency 20%. Top-matched comps best support the ARV.
Projected returns pro-forma
-3.0% appreciation · 2.81% rent growth · sell at horizon
- IRR
- -13.7%
- Equity multiple
- 0.51×
- Total profit
- $-25,960
- Equity at exit
- $28,181
- IRR
- -5.0%
- Equity multiple
- 0.67×
- Total profit
- $-17,280
- Equity at exit
- $16,341
Cash invested: $52,920 (down + closing). Projections, not guarantees.
Landlord ↔ Tenant lean methodology
- Overall (STATE)
- 87 Strongly Landlord-Friendly
- State Texas
- 87 Strongly Landlord-Friendly · R+5
- County
- — inherits STATE
- City
- — inherits STATE
ZIP-level market 77571
- Home prices YoY
- -28.9%
- Rents YoY
- 2.8%
- Active inventory
- 337
- Price-to-rent
- 8.0×
Monthly cashflow live
- Estimated rent
- $1,961 medium interval (Pro) →
- Mortgage (P&I)
- −$991
- Tax from tax record
- −$402 /mo · $4,826/yr
- Insurance
- −$79
- HOA
- −$0
- Vacancy / Maint / Mgmt
- −$412
- Net cashflow
- $77
Break-even live
Sensitivity live
| Price | -10% $184 | -5% $131 | +0% $77 | +5% $24 | +10% $-30 |
|---|---|---|---|---|---|
| Rent | -10% $-78 | -5% $0 | +0% $77 | +5% $155 | +10% $232 |
| Rate | -1.0pp $172 | -0.5pp $125 | base $77 | +0.5pp $28 | +1.0pp $-22 |
UW: 25.0% down · 7.5% · 30yr · 1.5% tax · 5.0% vac · 8.0% maint · 8.0% mgmt
Financing live
Cash to close
- Down payment
- $47,250
- Closing costs
- $5,670
- Reserves months
- —
- Total cash needed
- —
Loan-product check · same deal, 3 products live
Conventional
25% down · 7.5% · 30yr
- Down + closing
- —
- Monthly P&I
- —
- Monthly cashflow
- —
- DSCR
- —
- Eligible?
- —
Personal DTI + credit; lowest rate.
DSCR
20% down · 8.5% · 30yr
- Down + closing
- —
- Monthly P&I
- —
- Monthly cashflow
- —
- DSCR
- —
- Eligible?
- —
No personal income docs; deal must DSCR.
Hard money
10% down · 12.0% · 12mo
- Down + closing
- —
- Monthly P&I
- —
- Monthly cashflow
- —
- DSCR
- —
- Eligible?
- —
Short-term bridge; refi at stabilization.
Rent comps 5 comps
| Address | Beds | Baths | Sqft | Rent | $/sqft | DOM | Units | Dist |
|---|---|---|---|---|---|---|---|---|
| 218 S 6th St La Porte, TX | 3.0 | 2.0 | 1500 | $1,925 | $1.28 | 44d | 1 | 0.06mi |
| 319 S 6th St La Porte, TX | 4.0 | 2.0 | 1812 | $1,795 | $0.99 | 25d | 1 | 0.16mi |
| 803 S 4th St La Porte, TX | 4.0 | 1.5 | 1688 | $1,700 | $1.01 | 6d | 1 | 0.57mi |
| 3300 Bay Area Blvd La Porte, TX | 1.0–3.0 | 1.0–2.0 | 1060 | $2,722 | $2.57 | 2d | 47 | 1.35mi |
| 1831 Texas 146 Unit 1864 La Porte, TX | 3.0 | 2.0 | 1271 | $1,980 | $1.56 | 3d | 1 | 1.49mi |
Listing history 35 events
-
2026-06-18days on market $189,000 Active 184 DOM
-
2026-06-17days on market $189,000 Active 183 DOM
-
2026-06-16pricedays on market $189,000 Active 182 DOM
-
2026-06-15days on market $195,000 Active 181 DOM
-
2026-06-13days on market $195,000 Active 179 DOM
-
2026-06-09days on market $195,000 Active 175 DOM
-
2026-06-08days on market $195,000 Active 174 DOM
-
2026-06-07days on market $195,000 Active 173 DOM
-
2026-06-04days on market $195,000 Active 170 DOM
-
2026-06-03days on market $195,000 Active 169 DOM
-
2026-06-02days on market $195,000 Active 168 DOM
-
2026-06-01days on market $195,000 Active 167 DOM
-
2026-05-31days on market $195,000 Active 166 DOM
-
2026-02-16price $195,000 604-char remark
Show marketing remark (604 chars)
This gorgeous gem with 3 bedrooms and 1 full bath is minutes away from the refineries and is looking for its next owner to come enjoy every square foot of it. Open living room with rustic laminate flooring. Beautiful white cabinetry throughout the kitchen with a refrigerator, dishwasher, and stove to go along with it. Washer and dryer connections in a separate area to make a laundry space. Standing shower for the bathroom. Comfortable carpet in the bedrooms and upstairs. Spacious backyard for all the family gatherings. Easy access to N Hwy 146. Schedule your private tour now, this one won't last!!
-
2025-12-16$199,900 Active 604-char remark
Show marketing remark (604 chars)
This gorgeous gem with 3 bedrooms and 1 full bath is minutes away from the refineries and is looking for its next owner to come enjoy every square foot of it. Open living room with rustic laminate flooring. Beautiful white cabinetry throughout the kitchen with a refrigerator, dishwasher, and stove to go along with it. Washer and dryer connections in a separate area to make a laundry space. Standing shower for the bathroom. Comfortable carpet in the bedrooms and upstairs. Spacious backyard for all the family gatherings. Easy access to N Hwy 146. Schedule your private tour now, this one won't last!!
-
2024-07-18historical
-
2024-03-14$220,000 Active
-
2022-03-31status Pending, Continue to Show
-
2022-02-23status Pending
-
2022-02-15status Option Pending
-
2022-02-15historical
-
2022-01-21price $165,000
-
2021-11-30price $175,000
-
2021-11-24price $185,000
-
2021-11-05price $190,000
-
2021-10-26price $200,000
-
2021-08-26$210,000 Active
-
2021-01-21soldstatus
-
2011-12-16soldstatus
-
2011-05-20historical
-
2011-01-09$84,900
-
2010-03-29soldstatus
-
2010-03-10historical
-
2009-09-25$29,000
-
1988-12-11soldstatus
ⓘ Source: listings_history table (triggers on properties + properties_extension) + one-shot
backfill from property_details.listing_events for pre-trigger history.
Tax reassessment forecast TX · Resets to sale price
- Current annual tax
- $4,826 · $402/mo
- Projected year-2 tax
- $4,826 · $402/mo
- Expected delta
- $0/yr ($0/mo · 0.0%)
ⓘ Screening estimate from a state-policy table — verify with the county assessor before closing.
Climate risk First Street
- Flood 4/10 Moderate FEMA zone X (unshaded) · 13% chance over 30 yrs
- Wildfire 1/10 Low
- Heat 9/10 Extreme 7 d/yr ≥108°F today · 25 d/yr by 30 yrs out
- Wind 9/10 Extreme 99% chance of damaging wind over 30 yrs
- Air quality 2/10 Low 1 unhealthy d/yr today · 2 by 30 yrs out
Nearby sold comps map
Loading sold comps map…
Walkable amenities ~0.75 mi
Loading nearby amenities…
Taxation est. · year 1
- Rental income
- $23,531
- − Mortgage interest
- −$10,587
- − Property taxes
- −$4,826
- − Insurance
- −$945
- − Repairs & maintenance
- −$1,882
- − Management
- −$1,882
- − Depreciation
- −$5,498
- Taxable loss
- −$2,090
- Est. tax savings @ 24.0%
- +$502
- After-tax cash flow
- $1,426/yr
For passive investors: Depreciation is non-cash, so a rental often shows a tax loss while cash-flowing — sheltering income. Rental losses are passive: they offset passive income freely, and up to $25,000/yr can offset ordinary (W-2) income if you actively participate and your MAGI is under $100k (phasing out to $0 by $150k); unused losses carry forward. On sale, claimed depreciation is recaptured at up to 25%, and gains may owe capital-gains tax (a 1031 exchange can defer both). Figures are a year-1 estimate at your 24.0% rate — not tax advice; consult a CPA.
Schools (NCES district)
- District
- La Porte ISD
- NCES district ID
- 4826190
- Math proficiency
- 41% ▼ -10.00%
- Reading proficiency
- 44% ▼ -4.00%
- Median HH income
- $71,841
- Composite
- 38.65/100
- National rank
- #4151
- State rank
- #260 of 826 in TX
Livability — La Porte
- Score
- 70/100
- State rank
- #360
- US rank
- #7754
Category grades
Schools grade is shown separately in the Schools card above.
Census & demographics
- Census place
- La Porte, TX
- County
- Harris County · 4,702,590 people
- City population
- 38,543
- Metro
- Houston-The Woodlands-Sugar Land, TX
- Population (ZIP)
- 38,543
- Household income
- $81,850
- Rent vs Own
- Severe rent burden
- 1176.0
Population outlook (Harris County) Hauer SSP2
- Today (2025)
- 5,571,493 people
- By 2030
- 6,089,821 · +9.3%
- By 2040
- 7,142,806 · +28.2%
- By 2050
- 8,185,864 · +46.9%
- By 2075
- 10,574,329 · +89.8%
- By 2100
- 12,109,958 · +117.4%
Race, ethnicity, and origin ACS 2023
- Neighborhood character
- Diverse neighborhood (Simpson 0.60)
- Race & ethnicity
- White 51% Hispanic / Latino 36% Two or more races 20% Black 8% Asian 1%
- Hispanic origin (detail)
- Mexican 31%
- Common ancestry
- Italian 4% Lithuanian 3% Iranian 1%
- Foreign-born
- 10% · Canada, Vietnam
- Languages at home
- 77% English-only · Spanish 21% Other Indo-European 1%
Political lean MEDSL · Harris
- 2024 margin
- Lean D (+5.5) · D 52.0% · R 46.4% · Other 1.6%
- 2008→2024 swing
- +3.9pp toward D · 2008: 1.6pp · 2024: 5.5pp
- All cycles
- 2024: D+5.5 2020: D+13.3 2016: D+12.4 2012: D+0.1 2008: D+1.6
Not yet ingested
- Civics
- —
Market trends
- HPI YoY
- ▼ -103.81%
- Current HPI
- 255.0768
- Rent YoY
- ▲ 2.81%
- Metro
- Houston-The Woodlands-Sugar Land, TX
- State GDP YoY
- ▲ 3.95%
- F500 in state
- 110
Industry mix (Fortune 500 HQ in TX)
| Industry | F500 HQs | Revenue |
|---|---|---|
| Energy | 16 | $1,198B |
|
||
| Technology | 5 | $198B |
|
||
| Engineering / Construction | 4 | $72B |
|
||
| Energy Services | 3 | $60B |
|
||
| Utilities | 3 | $41B |
|
||
| Healthcare | 2 | $330B |
|
||
Price history
+572.4% since first listed22 events — show timeline
- 2026-02-16 Price Changed $195,000 HARMLS
- 2025-12-16 Listed $199,900 HARMLS
- 2024-07-18 Listing Removed — HARMLS
- 2024-03-14 Listed $220,000 HARMLS
- 2022-03-31 Pending — HARMLS
- 2022-02-23 Pending — HARMLS
- 2022-02-15 Pending — HARMLS
- 2022-02-15 Listing Removed — HARMLS
- 2022-01-21 Price Changed $165,000 HARMLS
- 2021-11-30 Price Changed $175,000 HARMLS
- 2021-11-24 Price Changed $185,000 HARMLS
- 2021-11-05 Price Changed $190,000 HARMLS
- 2021-10-26 Price Changed $200,000 HARMLS
- 2021-08-26 Listed $210,000 HARMLS
- 2021-01-21 Sold (Public Records) — Public Records
- 2011-12-16 Sold (Public Records) — Public Records
- 2011-05-20 Listing Removed — HARMLS
- 2011-01-09 Listed $84,900 HARMLS
- 2010-03-29 Sold (MLS) — HARMLS
- 2010-03-10 Listing Removed — HARMLS
- 2009-09-25 Listed $29,000 HARMLS
- 1988-12-11 Sold (Public Records) — Public Records
Property tax history
+9.1%/yrLatest (2025): $4,826 · +9.3% YoY. Source: county tax records.
Cash-flow waterfall
monthlySold comps — $/sqft
last 12 mo · ≤1 miLoading sold comps…