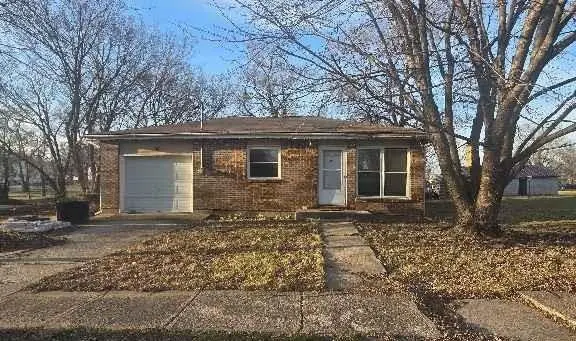
202 Grasshopper Rd · Winchester, KS
Flood risk 1/10 · Minimal
- FEMA flood zone
- X (unshaded)
- Chance of flooding over 30 yrs
- 0.0%
- Est. flood insurance / yr
- $507 – $1,088
Fire risk 2/10 · Minimal
- Est. fire insurance / yr
- $1,154 – $2,142
Heat risk 4/10 · Minor
- Hot days now (above 107°F)
- 7 days/yr
- Hot days in 30 yrs
- 17 days/yr
Wind risk 2/10 · Minimal
- Chance of severe wind over 30 yrs
- —
Air-quality risk 2/10 · Minimal
- Unhealthy air days now
- 1 days/yr
- Unhealthy air days in 30 yrs
- 1 days/yr
Risk factors via First Street. Map © Google.
Why this score? — see what drove the C+ grade
The composite is a weighted blend of 9 inputs, each scored 0–100. Each bar is that input's sub-score; the figure is the points it added to the 100-point composite (weight × sub-score).
- Cash flow +16.1/30.0
- ARV discount +15.0/15.0
- Appreciation +8.7/10.0
- DSCR +5.0/10.0
- 1% rule +4.9/10.0
- Schools +4.0/10.0
- Livability +3.5/5.0
- Rent growth +2.5/5.0
- Condition / age +2.5/5.0
$105,000
🖨 Deal sheet 📄 Offer letter ✓ Due diligence
Listing remarks
Welcome to small-town charm in the heart of Winchester! This inviting home at 202 Grasshopper Road offers the perfect blend of comfort, functionality, and peaceful living. Step inside to find a warm and welcoming interior with spacious living areas, ideal both for relaxing and entertaining. The home features natural light, a practical layout, and comfortable bedrooms designed to suit a variety of lifestyles. Outside, enjoy a sizable yard with plenty of room for outdoor activities, gardening, or simply soaking in the quiet surroundings. Whether you're a first-time homebuyer, downsizing, or looking for an investment opportunity, this property offers incredible potential. Located in a friendly
Key facts
- Sizable yard
- Convenient access
- 9,583 sq ft lot
Tags
Property features AI
Finance
- Other: Property inside city limits
- HOA & community: No association; no HOA fees
Exterior
- Parking: Attached garage (1 car)
- Utilities: City/Public water (verify); Public sewer; Cable, fiber, high-speed internet available
- Home design: Single-family residence; Ranch floor plan/model; 1 story (ranch)
- Construction: Board & batten siding; Composition roof; Crawl space foundation; Built approximately 41–50 years ago
- Exterior features: Metal fencing; Level city lot; Paved road with public maintenance
Interior
- Bedrooms: 3 bedrooms
- Flooring: Carpet; Wood
- Bathrooms: 1 full bathroom
- Heating & cooling: Electric heating; No central cooling
- Interior features: Ceiling fan(s); Storm windows
- Laundry & utility: Laundry closet on bedroom level
Neighborhood map
What this means for you Summary
Snapshot
- This is a 3-bed/1.0-bath single-family listed at $105k.
Deal economics
- At list price, monthly cash flow is $54 ($642/yr) — positive.
- The deal already cash-flows at list — no discount required.
- To meet the 1% rule (rent ≥ 1% of price), the offer needs to be $104k (1.0% below list).
- Recommended offer: $99k (6.0% below list) — sets the bar for market timing.
Location & tenants
- Location reads 70/100 on livability (#169 in KS) — a middle-class / working-renter tenant base. Strengths: crime A+, cost of living A+, housing A+; Watch: amenities F, commute F, employment D-.
- Jefferson County North (rural): math 42% / reading 44% proficiency, ranked #34 of 280 in KS (top 12%) — families likely to look elsewhere, expect single-tenant / working-renter base with shorter leases.
- Zoned schools: Jefferson County North Elem/Middle (math 37% / reading 32%, grade F, #388 of 684 statewide, top 61%, 325 students, 34% FRL); Jefferson Co North High (math 30% / reading 50%, grade F, #20 of 327 statewide, top 6%, 115 students, 35% FRL).
- Market conditions: 5 active listings in the ZIP; 61 units permitted in Jefferson County in 2024 (0 in 5+ unit buildings).
Forward outlook
- In year one you build about $8k of equity ($726 loan paydown + $8k appreciation (7.3% local appreciation)).
- Jefferson County population projected at -12% by 2050 — secular population decline; favor cash flow + early exit over multi-decade hold.
- At projected returns (7.3% appreciation + 3.0% rent growth), your $29k cash investment doubles in ~3 years — after that, you're playing with house money.
- By year 5, paydown + projected appreciation supports a ~$38k cash-out refi (75% LTV) — recoverable capital for the next deal without selling this one.
Negotiation context
- It's been on market 84 days — a 6% lower offer ($99k) is reasonable based on typical stale-listing flexibility.
- Current owner paid $73k; 44% above their basis — modest negotiation headroom, anchor on the comps not their cost.
Questions for the listing agent
- It's been on market 84 days. Have you received any prior offers? Is the seller open to a 6% concession, seller financing, or rate buy-down credit?
- Why hasn't it sold? Are there any deal-killer items the seller is aware of (foundation, flood, title, zoning, code violations)?
- Is there a deadline driving the sale (1031 exchange, divorce, estate, relocation)? That informs how much negotiation room exists.
- Schools are D-rated, which usually means shorter tenancies and higher turnover. Who's the typical renter profile here, and what's been the actual vacancy rate?
- What's the average days-on-market for RENTAL listings here right now (not sales)? A rising rental-DOM trend means longer vacancies and softer asking-rent achievability than the comps imply.
- What's the recent tenant-quality profile in this submarket — average credit score on applications, eviction rate, late-payment / NSF rate, and stable-employment percentage? A property-management company in the area should have these aggregated.
- How much new for-sale + rental construction is in the pipeline within 1–3 miles? Heavy new supply typically softens prices + rents 12–24 months out; constrained supply supports both.
Investment metrics
- 1% rule
- 0.99% ✗
- Cap rate
- 6.90%
- Cash-on-cash
- 2.18%
- DSCR
- 1.10
- GRM
- 8.4
CMA / ARV
- ARV (on-the-fly)
- $148,176
- Comps found
- 3
Show comp detail 3 sales within ~0.75 mi
| Address | Dist | Beds/Ba | Sqft | Sold | Price | $/sf | Match |
|---|---|---|---|---|---|---|---|
| 81 Winchester St | 0.17mi | 3/2.0 | 1,120 (+11%) | 12mo | $165,000 | $147 | 59 |
| 403 Osage St | 0.44mi | 2/1.0 (-1) | 896 (-11%) | 12mo | $144,000 | $161 | 46 |
| 516 Sixth St | 0.39mi | 2/1.0 (-1) | 1,148 (+14%) | 17mo | $139,000 | $121 | 39 |
Match score weights: distance 35% · size 25% · config 20% · recency 20%. Top-matched comps best support the ARV.
Projected returns pro-forma
7.32% appreciation · 3.0% rent growth · sell at horizon
- IRR
- 20.2%
- Equity multiple
- 2.44×
- Total profit
- $42,200
- Equity at exit
- $74,979
- IRR
- 18.9%
- Equity multiple
- 5.08×
- Total profit
- $120,025
- Equity at exit
- $144,481
Cash invested: $29,400 (down + closing). Projections, not guarantees.
Landlord ↔ Tenant lean methodology
- Overall (STATE)
- 83 Strongly Landlord-Friendly
- State Kansas
- 83 Strongly Landlord-Friendly · R+10
- County
- — inherits STATE
- City
- — inherits STATE
ZIP-level market 66097
- Home prices YoY
- 2.7%
- Active inventory
- 5
- Price-to-rent
- 8.4×
Monthly cashflow live
- Estimated rent
- $1,040 medium interval (Pro) →
- Mortgage (P&I)
- −$551
- Tax from tax record
- −$173 /mo · $2,080/yr
- Insurance
- −$44
- HOA
- −$0
- Vacancy / Maint / Mgmt
- −$218
- Net cashflow
- $54
Break-even live
UW: 25.0% down · 7.5% · 30yr · 1.5% tax · 5.0% vac · 8.0% maint · 8.0% mgmt
Financing live
Cash to close
- Down payment
- $26,250
- Closing costs
- $3,150
- Reserves months
- —
- Total cash needed
- —
Loan-product check · same deal, 3 products live
Conventional
25% down · 7.5% · 30yr
- Down + closing
- —
- Monthly P&I
- —
- Monthly cashflow
- —
- DSCR
- —
- Eligible?
- —
Personal DTI + credit; lowest rate.
DSCR
20% down · 8.5% · 30yr
- Down + closing
- —
- Monthly P&I
- —
- Monthly cashflow
- —
- DSCR
- —
- Eligible?
- —
No personal income docs; deal must DSCR.
Hard money
10% down · 12.0% · 12mo
- Down + closing
- —
- Monthly P&I
- —
- Monthly cashflow
- —
- DSCR
- —
- Eligible?
- —
Short-term bridge; refi at stabilization.
Listing history 19 events
-
2026-06-19days on market $105,000 Active 84 DOM
-
2026-06-18days on market $105,000 Active 83 DOM
-
2026-06-17days on market $105,000 Active 82 DOM
-
2026-06-16days on market $105,000 Active 81 DOM
-
2026-06-15days on market $105,000 Active 80 DOM
-
2026-06-14days on market $105,000 Active 78 DOM
-
2026-06-12days on market $105,000 Active 77 DOM
-
2026-06-09days on market $105,000 Active 74 DOM
-
2026-06-08days on market $105,000 Active 73 DOM
-
2026-06-07days on market $105,000 Active 72 DOM
-
2026-06-05days on market $105,000 Active 70 DOM
-
2026-06-04days on market $105,000 Active 68 DOM
-
2026-06-02days on market $105,000 Active 67 DOM
-
2026-06-01days on market $105,000 Active 66 DOM
-
2026-05-31days on market $105,000 Active 65 DOM
-
2026-05-31days on market $105,000 Active 64 DOM
-
2026-03-27$105,000 Active
-
2008-01-01soldstatus $73,000
-
1993-03-01soldstatus $34,000
ⓘ Source: listings_history table (triggers on properties + properties_extension) + one-shot
backfill from property_details.listing_events for pre-trigger history.
Tax reassessment forecast KS · Resets to sale price
- Current annual tax
- $2,080 · $173/mo
- Projected year-2 tax
- $2,080 · $173/mo
- Expected delta
- $0/yr ($0/mo · 0.0%)
ⓘ Screening estimate from a state-policy table — verify with the county assessor before closing.
Climate risk First Street
- Flood 1/10 Low FEMA zone X (unshaded) · 0% chance over 30 yrs
- Wildfire 2/10 Low
- Heat 4/10 Moderate 7 d/yr ≥107°F today · 17 d/yr by 30 yrs out
- Wind 2/10 Low
- Air quality 2/10 Low 1 unhealthy d/yr today · 1 by 30 yrs out
Nearby sold comps map
Loading sold comps map…
Walkable amenities ~0.75 mi
Loading nearby amenities…
Taxation est. · year 1
- Rental income
- $12,475
- − Mortgage interest
- −$5,882
- − Property taxes
- −$2,080
- − Insurance
- −$525
- − Repairs & maintenance
- −$998
- − Management
- −$998
- − Depreciation
- −$3,055
- Taxable loss
- −$1,063
- Est. tax savings @ 24.0%
- +$255
- After-tax cash flow
- $897/yr
For passive investors: Depreciation is non-cash, so a rental often shows a tax loss while cash-flowing — sheltering income. Rental losses are passive: they offset passive income freely, and up to $25,000/yr can offset ordinary (W-2) income if you actively participate and your MAGI is under $100k (phasing out to $0 by $150k); unused losses carry forward. On sale, claimed depreciation is recaptured at up to 25%, and gains may owe capital-gains tax (a 1031 exchange can defer both). Figures are a year-1 estimate at your 24.0% rate — not tax advice; consult a CPA.
Schools (NCES district)
- District
- Jefferson County North
- NCES district ID
- 2013020
- Math proficiency
- 42% ▼ -4.00%
- Reading proficiency
- 44% ▬ 0.00%
- Median HH income
- $54,710
- Composite
- 39.73/100
- National rank
- #8001
- State rank
- #34 of 280 in KS
Livability — Winchester
- Score
- 70/100
- State rank
- #169
- US rank
- #7943
Category grades
Schools grade is shown separately in the Schools card above.
Census & demographics
- Census place
- Winchester, KS
- Population (ZIP)
- 939
Population outlook (Jefferson County) Hauer SSP2
- Today (2025)
- 18,534 people
- By 2030
- 18,165 · -2.0%
- By 2040
- 17,247 · -6.9%
- By 2050
- 16,257 · -12.3%
- By 2075
- 14,493 · -21.8%
- By 2100
- 12,298 · -33.6%
Race, ethnicity, and origin ACS 2023
- Neighborhood character
- Predominantly White (98%)
- Race & ethnicity
- White 98% Two or more races 2% Hispanic / Latino 2%
- Common ancestry
- Italian 4% Portuguese 3% Lithuanian 2%
Political lean MEDSL · Jefferson
- 2024 margin
- Solid R (+36.9) · D 30.5% · R 67.4% · Other 2.0%
- 2008→2024 swing
- -18.2pp toward R · 2008: -18.7pp · 2024: -36.9pp
- All cycles
- 2024: R+36.9 2020: R+32.2 2016: R+32.3 2012: R+22.8 2008: R+18.7
Not yet ingested
- Civics
- —
Market trends
- HPI YoY
- ▲ 7.32%
- Current HPI
- 275.6528
- Rent YoY
- —
- Metro
- —
- State GDP YoY
- —
- F500 in state
- 0
Price history
+208.8% since first listed3 events — show timeline
- 2026-03-27 Listed $105,000 Heartland MLS as Distributed by MLS Grid
- 2008-01-01 Sold (Public Records) $73,000 Public Records
- 1993-03-01 Sold (Public Records) $34,000 Public Records
Property tax history
+3.5%/yrLatest (2025): $2,080 · +0.1% YoY. Source: county tax records.
Cash-flow waterfall
monthlySold comps — $/sqft
last 12 mo · ≤1 miLoading sold comps…