435 N 35th Ave #167 · Greeley, CO
Flood risk No data
- FEMA flood zone
- —
- Chance of flooding over 30 yrs
- —
- Est. flood insurance / yr
- —
Fire risk No data
- Est. fire insurance / yr
- —
Heat risk No data
- Hot days now (above threshold)
- —
- Hot days in 30 yrs
- —
Wind risk No data
- Chance of severe wind over 30 yrs
- —
Air-quality risk No data
- Unhealthy air days now
- —
- Unhealthy air days in 30 yrs
- —
Risk factors via First Street. Map © Google.
Why this score? — see what drove the C- grade
The composite is a weighted blend of 9 inputs, each scored 0–100. Each bar is that input's sub-score; the figure is the points it added to the 100-point composite (weight × sub-score).
- Cash flow +26.2/30.0
- DSCR +8.9/10.0
- 1% rule +5.7/10.0
- Livability +3.4/5.0
- ARV discount +3.3/15.0
- Condition / age +2.5/5.0
- Rent growth +2.3/5.0
- Schools +2.0/10.0
- Appreciation +0.0/10.0
$129,000
🖨 Deal sheet 📄 Offer letter ✓ Due diligence
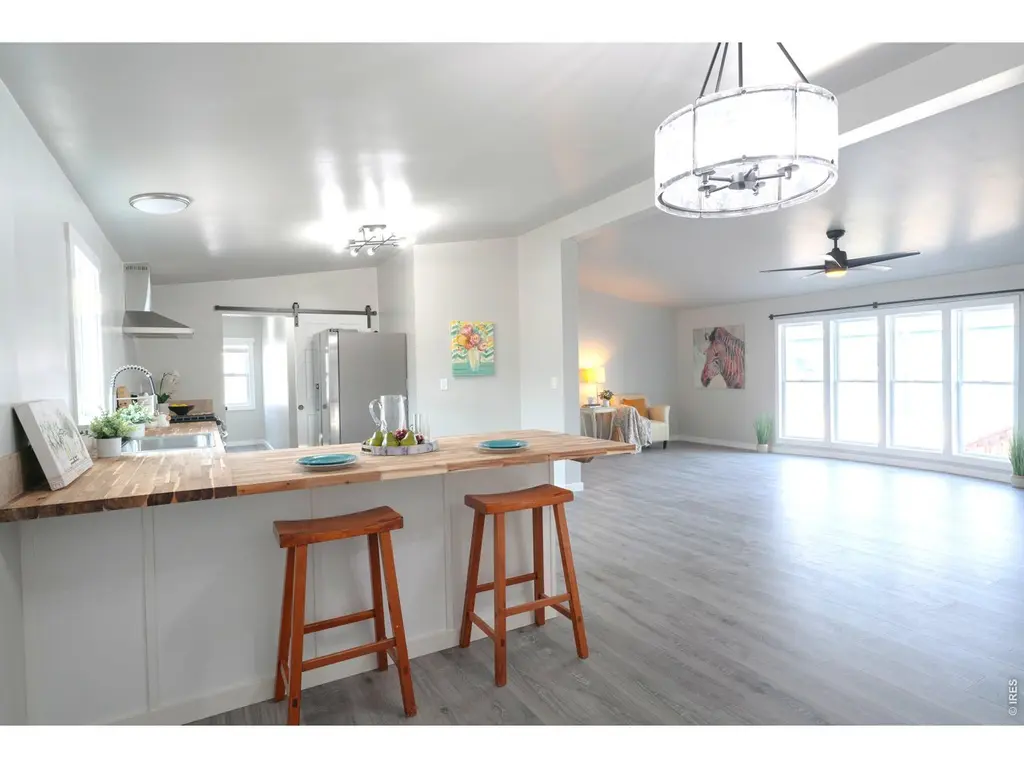
Listing remarks
Seller is offering a $5,000 Seller Concession with a full price offer! This home features a NEW CLASS 4 HIGH IMPACT ROOF, FURNACE, AC UNIT, FLOORING, SIDING, INTERIOR PAINT, APPLIANCES AND FIXTURES! Hurry and schedule a tour so you can get into see this meticulously updated home with 3 spacious bedrooms, 2 bathrooms and an inviting, open floorplan. Enjoy the eat-in kitchen next to the large family room that is great for entertaining. You will also love the commodities available in Stoneybrook, like the pool, clubhouse, parks and beautiful community pond. Just minutes from shopping, dining and a wonderful dog park. This home won't last long.
Key facts
- Flooring
- Interior paint
- Ac unit
Tags
Property features AI
Finance
- Other: 500-year floodplain (B or X rating); Windows listed as energy-efficient feature
Exterior
- Parking: No garage; No designated parking features
- Utilities: City water (meter installed); Public sewer; Natural gas available; Electricity available
- Home design: Manufactured in park; Mobile home
- Construction: Composition construction materials; Composition roof
- Exterior features: Deck; Land lease; Property faces west; Paved lot; Asphalt road frontage; City street frontage; Level lot; Level drive; Stall shower (accessibility)
Interior
- Kitchen: Gas range; Dishwasher; Refrigerator; Microwave; Garbage disposal
- Bedrooms: 3 bedrooms
- Bathrooms: 2 full bathrooms
- Heating & cooling: Forced air heating; Central air conditioning; Ceiling fans
- Interior features: Eat-in kitchen; Cathedral ceilings; Open floor plan; Walk-in closets; Fire alarm
Neighborhood map
What this means for you Summary
Snapshot
- This is a 3-bed/2.0-bath manufactured listed at $129k.
Deal economics
- At list price, monthly cash flow is $329 ($4k/yr) — positive.
- The deal already cash-flows at list — no discount required.
- Meets the 1% rule at list price ($1k rent vs $129k).
- Recommended offer: $121k (6.0% below list) — sets the bar for market timing.
- Cap rate 9.4% vs local median 3.3% in Greeley — top-decile yield for the area; either an underpriced asset or a hidden risk that comps aren't pricing in. Stress-test before assuming the spread holds.
Location & tenants
- Location reads 68/100 on livability (#115 in CO) — a middle-class / working-renter tenant base. Strengths: commute A+, housing A+, health & safety A; Watch: cost of living C-, schools D, crime F.
- Greeleyschool District No. 6 In The County Of Weld And Sta (urban): math 15% / reading 31% proficiency, ranked #71 of 86 in CO (top 83%) — low school quality limits family demand, transient renter base, plan for 1-2y turnover.
- Market conditions: Rents soft (-0.7%/yr); 180 active listings in the ZIP; 10 comparable units currently listed for rent nearby; rentals at typical pace (median 23d on market — plan ~3-4 weeks tenant-placement turnaround); 3,170 units permitted in Weld County in 2024 (278 in 5+ unit buildings).
- This rent runs 30% of the median local income ($55k/yr) — at the standard rent-burdened threshold; future hikes will face affordability resistance.
Forward outlook
- Local home prices are declining (-3.0%/yr); year-one equity from $892 of loan paydown is wiped out by about $4k of value loss. Plan a longer hold.
- Weld County population projected at +46% by 2050 — long-run rental-demand tailwind backs the buy-and-hold thesis.
Negotiation context
- It's been on market 90 days — a 6% lower offer ($121k) is reasonable based on typical stale-listing flexibility.
- 2 sale attempts; this cycle's ask has dropped $16k (11%) from the opening price — seller is motivated, your offer sets the floor, not the list.
Questions for the listing agent
- It's been on market 90 days. Have you received any prior offers? Is the seller open to a 6% concession, seller financing, or rate buy-down credit?
- Why hasn't it sold? Are there any deal-killer items the seller is aware of (foundation, flood, title, zoning, code violations)?
- Is there a deadline driving the sale (1031 exchange, divorce, estate, relocation)? That informs how much negotiation room exists.
- Schools are D-rated, which usually means shorter tenancies and higher turnover. Who's the typical renter profile here, and what's been the actual vacancy rate?
- Crime grade is F in this area — have there been break-ins, vandalism, or insurance claims at this property in the last 3 years? What carrier currently insures it and at what premium?
- What's the average days-on-market for RENTAL listings here right now (not sales)? A rising rental-DOM trend means longer vacancies and softer asking-rent achievability than the comps imply.
- What's the recent tenant-quality profile in this submarket — average credit score on applications, eviction rate, late-payment / NSF rate, and stable-employment percentage? A property-management company in the area should have these aggregated.
- How much new for-sale + rental construction is in the pipeline within 1–3 miles? Heavy new supply typically softens prices + rents 12–24 months out; constrained supply supports both.
Investment metrics
- 1% rule
- 1.07% ✓
- Cap rate
- 9.36%
- Cash-on-cash
- 10.94%
- DSCR
- 1.49
- GRM
- 7.8
CMA / ARV
- ARV (on-the-fly)
- $117,936
- Comps found
- 12
Show comp detail 12 sales within ~0.75 mi
| Address | Dist | Beds/Ba | Sqft | Sold | Price | $/sf | Match |
|---|---|---|---|---|---|---|---|
| 435 N 35th Ave #316 | 0.00mi | 3/2.0 | 1,456 (0%) | 4mo | $66,000 | $45 | 96 |
| 435 N 35th Ave #421 | 0.00mi | 4/2.0 (+1) | 1,456 (0%) | 12mo | $95,000 | $65 | 85 |
| 200 N 35th Ave #103 | 0.22mi | 3/2.0 | 1,456 (0%) | 7mo | $120,000 | $82 | 84 |
| 435 N 35th Ave #327 | 0.00mi | 3/2.0 | 1,566 (+8%) | 7mo | $134,000 | $86 | 82 |
| 435 N 35th Ave #360 | 0.00mi | 3/2.0 | 1,280 (-12%) | 4mo | $75,000 | $59 | 76 |
| 435 N 35th Ave #309 | 0.00mi | 3/2.0 | 1,280 (-12%) | 6mo | $73,000 | $57 | 75 |
| 435 N 35th Ave #132 | 0.00mi | 4/2.0 (+1) | 1,568 (+8%) | 13mo | $105,000 | $67 | 71 |
| 435 N 35th Ave #446 | 0.00mi | 4/2.0 (+1) | 1,568 (+8%) | 13mo | $130,000 | $83 | 71 |
| 200 N 35th Ave Lot 57 | 0.34mi | 4/2.0 (+1) | 1,440 (-1%) | 8mo | $120,000 | $83 | 70 |
| 435 N 35th Ave #190 | 0.00mi | 4/3.0 (+1) | 1,568 (+8%) | 9mo | $127,500 | $81 | 70 |
| 435 N 35th Ave #124 | 0.00mi | 3/2.0 | 1,280 (-12%) | 12mo | $75,000 | $59 | 70 |
| 200 N 35th Ave #178 | 0.46mi | 3/2.0 | 1,344 (-8%) | 4mo | $115,000 | $86 | 63 |
Match score weights: distance 35% · size 25% · config 20% · recency 20%. Top-matched comps best support the ARV.
Projected returns pro-forma
-3.0% appreciation · 0.0% rent growth · sell at horizon
- IRR
- -3.1%
- Equity multiple
- 0.89×
- Total profit
- $-4,031
- Equity at exit
- $19,234
- IRR
- 3.3%
- Equity multiple
- 1.21×
- Total profit
- $7,618
- Equity at exit
- $11,154
Cash invested: $36,120 (down + closing). Projections, not guarantees.
Landlord ↔ Tenant lean methodology
- Overall (STATE)
- 38 Tenant-Leaning
- State Colorado
- 38 Tenant-Leaning · D+4
- County
- — inherits STATE
- City
- — inherits STATE
ZIP-level market 80631
- Rents YoY
- -0.7%
- Active inventory
- 180
- Price-to-rent
- 7.8×
Monthly cashflow live
- Estimated rent
- $1,382 high interval (Pro) →
- Mortgage (P&I)
- −$676
- Tax from tax record
- −$32 /mo · $384/yr
- Insurance
- −$54
- HOA
- −$0
- Vacancy / Maint / Mgmt
- −$290
- Net cashflow
- $329
Break-even live
UW: 25.0% down · 7.5% · 30yr · 1.5% tax · 5.0% vac · 8.0% maint · 8.0% mgmt
Financing live
Cash to close
- Down payment
- $32,250
- Closing costs
- $3,870
- Reserves months
- —
- Total cash needed
- —
Loan-product check · same deal, 3 products live
Conventional
25% down · 7.5% · 30yr
- Down + closing
- —
- Monthly P&I
- —
- Monthly cashflow
- —
- DSCR
- —
- Eligible?
- —
Personal DTI + credit; lowest rate.
DSCR
20% down · 8.5% · 30yr
- Down + closing
- —
- Monthly P&I
- —
- Monthly cashflow
- —
- DSCR
- —
- Eligible?
- —
No personal income docs; deal must DSCR.
Hard money
10% down · 12.0% · 12mo
- Down + closing
- —
- Monthly P&I
- —
- Monthly cashflow
- —
- DSCR
- —
- Eligible?
- —
Short-term bridge; refi at stabilization.
Rent comps 10 comps
| Address | Beds | Baths | Sqft | Rent | $/sqft | DOM | Units | Dist |
|---|---|---|---|---|---|---|---|---|
| 613 N 30th Ave Unit Basement 2br Greeley, CO | 2.0 | 1.0 | 1100 | $800 | $0.73 | 23d | 1 | 0.26mi |
| 3208 W 7th St Greeley, CO | 2.0–3.0 | 1.0–2.0 | 957 | $1,672 | $1.75 | 13d | 5 | 0.99mi |
| 709 37th Ave Unit 3 Greeley, CO | 2.0 | 1.5 | 1000 | $1,195 | $1.20 | 23d | 1 | 0.99mi |
| 804 37th Avenue Ct Unit 4 Greeley, CO | 2.0 | 1.5 | 975 | $995 | $1.02 | 23d | 1 | 1.08mi |
| 808 37th Ave Unit A Greeley, CO | 2.0 | 1.5 | 900 | $1,250 | $1.39 | 23d | 1 | 1.08mi |
| 821 35th Avenue Ct Greeley, CO | 2.0 | 1.0 | 950 | $1,530 | $1.61 | 13d | 1 | 1.10mi |
| 724 27th Ave Greeley, CO | 3.0 | 2.0 | 1248 | $1,700 | $1.36 | 13d | 1 | 1.17mi |
| 2306 W 7th St Greeley, CO | 3.0 | 1.0 | 897 | $1,850 | $2.06 | 21d | 1 | 1.38mi |
| 4323 9th St Rd Greeley, CO | 3.0 | 3.0 | 1436 | $1,800 | $1.25 | 23d | 1 | 1.40mi |
| 3950 W 12th St #3 Greeley, CO | 2.0 | 2.0 | 1194 | $2,100 | $1.76 | 23d | 1 | 1.48mi |
Listing history 19 events
-
2026-06-18days on market $129,000 Active 90 DOM
-
2026-06-17days on market $129,000 Active 89 DOM
-
2026-06-16days on market $129,000 Active 88 DOM
-
2026-06-15days on market $129,000 Active 87 DOM
-
2026-06-14remarks 648-char remark
-
2026-06-14days on market $129,000 Active 85 DOM
-
2026-06-09days on market $129,000 Active 83 DOM
-
2026-06-08days on market $129,000 Active 82 DOM
-
2026-06-07days on market $129,000 Active 81 DOM
-
2026-06-03days on market $129,000 Active 77 DOM
-
2026-06-02days on market $129,000 Active 76 DOM
-
2026-06-01days on market $129,000 Active 75 DOM
-
2026-05-31days on market $129,000 Active 74 DOM
-
2026-05-30days on market $129,000 Active 73 DOM
-
2026-04-30price $129,000
-
2026-04-15status Active
-
2026-04-13historical Active Under Contract
-
2026-04-01price $135,000
-
2026-03-15$145,000 Active
ⓘ Source: listings_history table (triggers on properties + properties_extension) + one-shot
backfill from property_details.listing_events for pre-trigger history.
Tax reassessment forecast CO · Resets to sale price
- Current annual tax
- $384 · $32/mo
- Projected year-2 tax
- $710 · $59/mo
- Expected delta
- +$326/yr (+$27/mo · 85.0%)
ⓘ Screening estimate from a state-policy table — verify with the county assessor before closing.
Nearby sold comps map
Loading sold comps map…
Walkable amenities ~0.75 mi
Loading nearby amenities…
Taxation est. · year 1
- Rental income
- $16,582
- − Mortgage interest
- −$7,226
- − Property taxes
- −$384
- − Insurance
- −$645
- − Repairs & maintenance
- −$1,327
- − Management
- −$1,327
- − Depreciation
- −$3,753
- Taxable income
- $1,921
- Est. tax owed @ 24.0%
- −$461
- After-tax cash flow
- $3,492/yr
For passive investors: Depreciation is non-cash, so a rental often shows a tax loss while cash-flowing — sheltering income. Rental losses are passive: they offset passive income freely, and up to $25,000/yr can offset ordinary (W-2) income if you actively participate and your MAGI is under $100k (phasing out to $0 by $150k); unused losses carry forward. On sale, claimed depreciation is recaptured at up to 25%, and gains may owe capital-gains tax (a 1031 exchange can defer both). Figures are a year-1 estimate at your 24.0% rate — not tax advice; consult a CPA.
Schools (NCES district)
- District
- Greeleyschool District No. 6 In The County Of Weld And Sta
- NCES district ID
- 0804410
- Math proficiency
- 15% ▼ -7.00%
- Reading proficiency
- 31% ▼ -4.00%
- Median HH income
- $46,417
- Composite
- 19.99/100
- National rank
- #8667
- State rank
- #71 of 86 in CO
Livability — Greeley
- Score
- 68/100
- State rank
- #115
- US rank
- #9841
Category grades
Schools grade is shown separately in the Schools card above.
Census & demographics
- Census place
- Greeley, CO
- County
- Weld County · 332,652 people
- City population
- 119,344
- Metro
- Greeley, CO
- Population (ZIP)
- 53,722
- Household income
- $54,591
- Rent vs Own
- Severe rent burden
- 3061.0
Population outlook (Weld County) Hauer SSP2
- Today (2025)
- 351,957 people
- By 2030
- 385,304 · +9.5%
- By 2040
- 451,818 · +28.4%
- By 2050
- 514,478 · +46.2%
- By 2075
- 648,733 · +84.3%
- By 2100
- 720,400 · +104.7%
Race, ethnicity, and origin ACS 2023
- Neighborhood character
- Diverse neighborhood (Simpson 0.55)
- Race & ethnicity
- Hispanic / Latino 54% White 39% Two or more races 15% Black 3% Native American 2% Asian 1%
- Hispanic origin (detail)
- Mexican 45%
- Common ancestry
- Italian 2% Slovak 2% Portuguese 2%
- Foreign-born
- 19% · Canada, Philippines
- Languages at home
- 65% English-only · Spanish 33%
Political lean MEDSL · Weld
- 2024 margin
- Strong R (+21.0) · D 38.2% · R 59.2% · Other 2.6%
- 2008→2024 swing
- -12.2pp toward R · 2008: -8.7pp · 2024: -21.0pp
- All cycles
- 2024: R+21.0 2020: R+18.0 2016: R+22.4 2012: R+13.2 2008: R+8.7
Not yet ingested
- Civics
- —
Market trends
- HPI YoY
- ▼ -329.59%
- Current HPI
- 295.4309
- Rent YoY
- ▼ -0.65%
- Metro
- Greeley, CO
- State GDP YoY
- ▲ 1.95%
- F500 in state
- 14
Industry mix (Fortune 500 HQ in CO)
| Industry | F500 HQs | Revenue |
|---|---|---|
| Technology Distribution | 1 | $31B |
|
||
| Food / Agriculture | 1 | $18B |
|
||
| Packaging | 1 | $14B |
|
||
| Healthcare | 1 | $13B |
|
||
| Energy | 1 | $10B |
|
||
| Technology | 1 | $4B |
|
||
Price history
-11.0% since first listed5 events — show timeline
- 2026-04-30 Price Changed $129,000 IRES
- 2026-04-15 Relisted — IRES
- 2026-04-13 Contingent — IRES
- 2026-04-01 Price Changed $135,000 IRES
- 2026-03-15 Listed $145,000 IRES
Property tax history
+7.4%/yrLatest (2025): $384 · +350.1% YoY. Source: county tax records.
Cash-flow waterfall
monthlySold comps — $/sqft
last 12 mo · ≤1 miLoading sold comps…