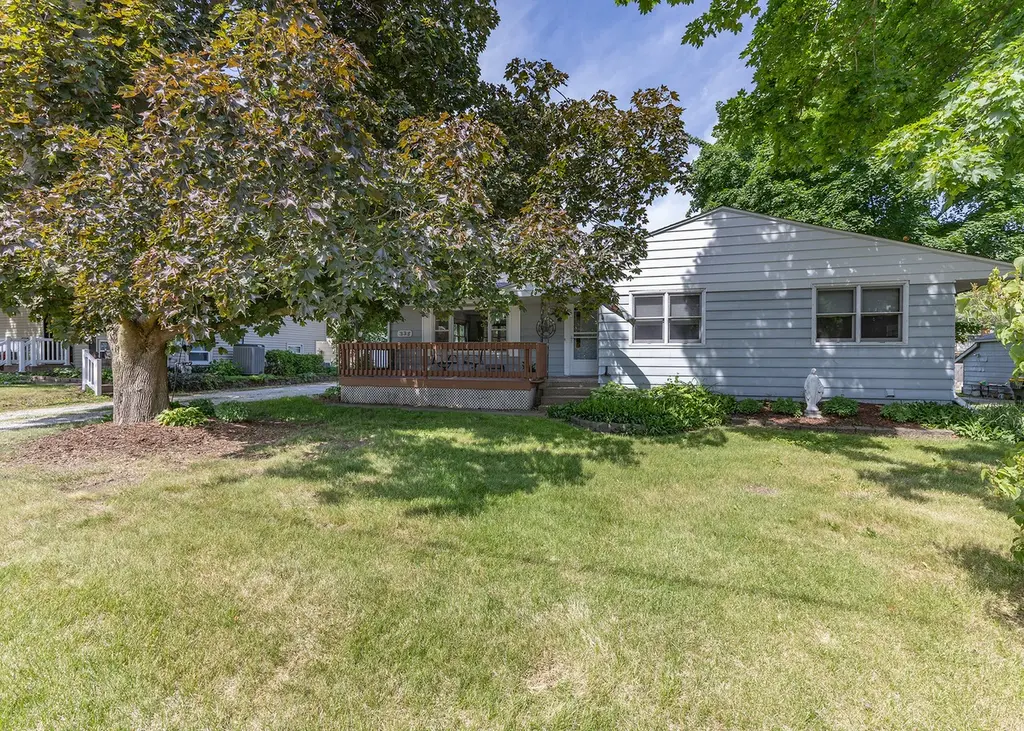
335 N Chicago St · Geneseo, IL
Flood risk 1/10 · Minimal
- FEMA flood zone
- X (unshaded)
- Chance of flooding over 30 yrs
- 0.0%
- Est. flood insurance / yr
- $473 – $860
Fire risk 1/10 · Minimal
- Est. fire insurance / yr
- $804 – $1,492
Heat risk 3/10 · Minor
- Hot days now (above 104°F)
- 7 days/yr
- Hot days in 30 yrs
- 17 days/yr
Wind risk 2/10 · Minimal
- Chance of severe wind over 30 yrs
- —
Air-quality risk 3/10 · Minor
- Unhealthy air days now
- 2 days/yr
- Unhealthy air days in 30 yrs
- 3 days/yr
Risk factors via First Street. Map © Google.
Why this score? — see what drove the C+ grade
The composite is a weighted blend of 9 inputs, each scored 0–100. Each bar is that input's sub-score; the figure is the points it added to the 100-point composite (weight × sub-score).
- Cash flow +26.0/30.0
- ARV discount +10.3/15.0
- DSCR +8.7/10.0
- 1% rule +7.0/10.0
- Livability +4.2/5.0
- Rent growth +2.5/5.0
- Condition / age +2.5/5.0
- Schools +2.3/10.0
- Appreciation +0.0/10.0
$182,500
🖨 Deal sheet (PDF) 📄 Offer letter ✓ Due diligence
Listing remarks
Welcome home to this adorable 3-bedroom, 2-bath property located on Chicago Street. Offering the perfect blend of comfort, functionality, and small-town charm, this home features spacious living areas, comfortable bedrooms, and a layout designed for everyday living. Outside, you'll find a detached 2-car garage plus storage/workshop area-ideal for hobbyists, craftsmen, or all your seasonal equipment and tools.
Key facts
- Detached garage
- 0.31 acre lot
- 2 garage spots
Tags
Property features AI
Finance
- Other: Total finished/unfinshed area reported (approx. 2,592 total finished/unfinished); Main level finished area approx. 1,296 (assessor source); Below-grade finished area listed; Unfinished basement area noted
- HOA & community: No master association fee required
Exterior
- Parking: Detached garage (garage owned) with garage door opener; Two garage spaces (two total parking spaces); Gravel and shared driveway access
- Utilities: Public water; Public sewer
- Home design: Detached single-family home; One-story layout; Fee simple ownership; Built approximately 61–70 years ago; Asphalt roof; Facing direction not specified
- Construction: Aluminum siding; Block foundation; Built before 1978
- Exterior features: Deck; Patio; Level lot; Lot dimensions approximately 60 x 192 x 60 x 192
Interior
- Kitchen: Galley kitchen (13 x 9); Range; Dishwasher; Refrigerator
- Bedrooms: Master bedroom on main level (13 x 13) with full bath access; Second bedroom on main level (12 x 12) — carpet; Third bedroom on main level (9 x 11) — carpet; Den in basement (11 x 13)
- Flooring: Carpet in most main-level living areas and bedrooms; Vinyl in kitchen; Other flooring in finished basement areas
- Bathrooms: Two full bathrooms
- Heating & cooling: Natural gas heating; Central air conditioning
- Interior features: Open floorplan; First-floor bedroom; First-floor full bath; Partially finished, full basement
- Laundry & utility: Basement laundry room (9 x 9); Washer; Dryer
Neighborhood map
What this means for you Summary
Snapshot
- This is a 3-bed/1.0-bath single-family listed at $182k.
Deal economics
- At list price, monthly cash flow is $452 ($5k/yr) — positive.
- The deal already cash-flows at list — no discount required.
- Meets the 1% rule at list price ($2k rent vs $182k).
- Cap rate 9.3% vs local median 6.9% in Geneseo — top-decile yield for the area; either an underpriced asset or a hidden risk that comps aren't pricing in. Stress-test before assuming the spread holds.
Location & tenants
- Location reads 83/100 on livability (#45 in IL, #907 nationally) — a professional / high-income tenant draw. Strengths: crime A+, cost of living A+, housing A+; Watch: commute F.
- Geneseo CUSD 228 (town): math 23% / reading 26% proficiency, ranked #297 of 620 in IL (top 48%) — low school quality limits family demand, transient renter base, plan for 1-2y turnover; only 18% free/reduced lunch — higher-income household profile.
- Zoned schools: Geneseo Middle School (math 15% / reading 20%, grade F, #450 of 665 statewide, top 69%, 591 students, 0% FRL); Geneseo High School (math 32% / reading 42%, grade F, #107 of 693 statewide, top 17%, 809 students, 0% FRL) — zoned schools average 0% FRL vs 18% district-wide (18 pts lower); this property's tenant base skews higher-income than the district average.
- Market conditions: 73 active listings in the ZIP; 32 units permitted in Henry County in 2024 (0 in 5+ unit buildings).
Forward outlook
- Local home prices are declining (-3.0%/yr); year-one equity from $1k of loan paydown is wiped out by about $5k of value loss. Plan a longer hold.
- Henry County population projected at -16% by 2050 — secular population decline; favor cash flow + early exit over multi-decade hold.
Negotiation context
- Only 3 days on market — expect competitive offers; lowballing is unlikely to land.
Risks & watch-outs
- Watch-outs: built in 1957 — expect roof / HVAC / electrical / plumbing capex.
Questions for the listing agent
- Built in 1957 — when were the roof, HVAC, electrical panel, plumbing, and water heater last replaced?
- Is there a deadline driving the sale (1031 exchange, divorce, estate, relocation)? That informs how much negotiation room exists.
- Schools are D-rated, which usually means shorter tenancies and higher turnover. Who's the typical renter profile here, and what's been the actual vacancy rate?
- What's the average days-on-market for RENTAL listings here right now (not sales)? A rising rental-DOM trend means longer vacancies and softer asking-rent achievability than the comps imply.
- What's the recent tenant-quality profile in this submarket — average credit score on applications, eviction rate, late-payment / NSF rate, and stable-employment percentage? A property-management company in the area should have these aggregated.
- How much new for-sale + rental construction is in the pipeline within 1–3 miles? Heavy new supply typically softens prices + rents 12–24 months out; constrained supply supports both.
Investment metrics
- 1% rule
- 1.20% ✓
- Cap rate
- 9.27%
- Cash-on-cash
- 10.61%
- DSCR
- 1.47
- GRM
- 7.0
CMA / ARV
- ARV (on-the-fly)
- $194,400
- Comps found
- 12
Show comp detail 12 sales within ~0.75 mi
| Address | Dist | Beds/Ba | Sqft | Sold | Price | $/sf | Match |
|---|---|---|---|---|---|---|---|
| 521 E Park St | 0.22mi | 3/2.0 | 1,295 (-0%) | 11mo | $158,000 | $122 | 76 |
| 407 N Chicago St | 0.03mi | 3/1.0 | 1,165 (-10%) | 8mo | $165,000 | $142 | 75 |
| 510 N Meadow St | 0.31mi | 2/2.5 (-1) | 1,343 (+4%) | 6mo | $220,000 | $164 | 63 |
| 811 Hickory Dr | 0.48mi | 3/2.0 | 1,315 (+2%) | 10mo | $203,000 | $154 | 63 |
| 329 E Orange St | 0.41mi | 3/2.5 | 1,234 (-5%) | 12mo | $185,000 | $150 | 57 |
| 627 E Main St | 0.60mi | 3/2.0 | 1,420 (+10%) | 6mo | $220,000 | $155 | 47 |
| 513 E Pearl St | 0.54mi | 2/2.0 (-1) | 1,172 (-10%) | 7mo | $231,000 | $197 | 44 |
| 317 S Spring St | 0.64mi | 2/1.5 (-1) | 1,218 (-6%) | 11mo | $145,000 | $119 | 44 |
| 317 S Spring St | 0.64mi | 2/1.5 (-1) | 1,218 (-6%) | 11mo | $145,000 | $119 | 44 |
| 522 E South St | 0.74mi | 3/1.5 | 1,134 (-12%) | 1mo | $123,750 | $109 | 42 |
| 923 Cherry Dr | 0.49mi | 4/3.0 (+1) | 1,440 (+11%) | 9mo | $250,000 | $174 | 38 |
| 409 E Pearl St | 0.59mi | 2/2.0 (-1) | 1,439 (+11%) | 9mo | $160,000 | $111 | 38 |
Match score weights: distance 35% · size 25% · config 20% · recency 20%. Top-matched comps best support the ARV.
Projected returns pro-forma
-3.0% appreciation · 3.0% rent growth · sell at horizon
- IRR
- -0.4%
- Equity multiple
- 0.99×
- Total profit
- $-745
- Equity at exit
- $27,211
- IRR
- 9.3%
- Equity multiple
- 1.72×
- Total profit
- $36,580
- Equity at exit
- $15,779
Cash invested: $51,100 (down + closing). Projections, not guarantees.
Landlord ↔ Tenant lean methodology
- Overall (STATE)
- 43 Moderately Tenant-Leaning
- State Illinois
- 43 Moderately Tenant-Leaning · D+7
- County
- — inherits STATE
- City
- — inherits STATE
ZIP-level market 61254
- Home prices YoY
- -32.0%
- Active inventory
- 73
- Price-to-rent
- 7.0×
Monthly cashflow live
- Estimated rent
- $2,181 medium interval (Pro) →
- Mortgage (P&I)
- −$957
- Tax from tax record
- −$238 /mo · $2,855/yr
- Insurance
- −$76
- HOA
- −$0
- Vacancy / Maint / Mgmt
- −$458
- Net cashflow
- $452
Break-even live
Sensitivity live
| Price | -10% $555 | -5% $504 | +0% $452 | +5% $400 | +10% $349 |
|---|---|---|---|---|---|
| Rent | -10% $280 | -5% $366 | +0% $452 | +5% $538 | +10% $624 |
| Rate | -1.0pp $544 | -0.5pp $498 | base $452 | +0.5pp $405 | +1.0pp $357 |
UW: 25.0% down · 7.5% · 30yr · 1.5% tax · 5.0% vac · 8.0% maint · 8.0% mgmt
Financing live
Cash to close
- Down payment
- $45,625
- Closing costs
- $5,475
- Reserves months
- —
- Total cash needed
- —
Loan-product check · same deal, 3 products live
Conventional
25% down · 7.5% · 30yr
- Down + closing
- —
- Monthly P&I
- —
- Monthly cashflow
- —
- DSCR
- —
- Eligible?
- —
Personal DTI + credit; lowest rate.
DSCR
20% down · 8.5% · 30yr
- Down + closing
- —
- Monthly P&I
- —
- Monthly cashflow
- —
- DSCR
- —
- Eligible?
- —
No personal income docs; deal must DSCR.
Hard money
10% down · 12.0% · 12mo
- Down + closing
- —
- Monthly P&I
- —
- Monthly cashflow
- —
- DSCR
- —
- Eligible?
- —
Short-term bridge; refi at stabilization.
Listing history 3 events
-
2026-06-07statusdays on market $182,500 Pending 3 DOM
-
2026-06-03remarks 412-char remark
-
2026-06-03$182,500 Active 1 DOM
ⓘ Source: listings_history table (triggers on properties + properties_extension) + one-shot
backfill from property_details.listing_events for pre-trigger history.
Tax reassessment forecast IL · Partial reset (capped growth)
- Current annual tax
- $2,855 · $238/mo
- Projected year-2 tax
- $3,499 · $292/mo
- Expected delta
- +$644/yr (+$54/mo · 22.6%)
ⓘ Screening estimate from a state-policy table — verify with the county assessor before closing.
Climate risk First Street
- Flood 1/10 Low FEMA zone X (unshaded) · 0% chance over 30 yrs
- Wildfire 1/10 Low
- Heat 3/10 Moderate 7 d/yr ≥104°F today · 17 d/yr by 30 yrs out
- Wind 2/10 Low
- Air quality 3/10 Moderate 2 unhealthy d/yr today · 3 by 30 yrs out
Nearby sold comps map
Loading sold comps map…
Walkable amenities ~0.75 mi
Loading nearby amenities…
Taxation est. · year 1
- Rental income
- $26,172
- − Mortgage interest
- −$10,223
- − Property taxes
- −$2,855
- − Insurance
- −$912
- − Repairs & maintenance
- −$2,094
- − Management
- −$2,094
- − Depreciation
- −$5,309
- Taxable income
- $2,685
- Est. tax owed @ 24.0%
- −$645
- After-tax cash flow
- $4,780/yr
For passive investors: Depreciation is non-cash, so a rental often shows a tax loss while cash-flowing — sheltering income. Rental losses are passive: they offset passive income freely, and up to $25,000/yr can offset ordinary (W-2) income if you actively participate and your MAGI is under $100k (phasing out to $0 by $150k); unused losses carry forward. On sale, claimed depreciation is recaptured at up to 25%, and gains may owe capital-gains tax (a 1031 exchange can defer both). Figures are a year-1 estimate at your 24.0% rate — not tax advice; consult a CPA.
Schools (NCES district)
- District
- Geneseo CUSD 228
- NCES district ID
- 1716350
- Math proficiency
- 23% ▼ -10.00%
- Reading proficiency
- 26% ▼ -9.00%
- Median HH income
- $63,288
- Composite
- 22.91/100
- National rank
- #7996
- State rank
- #297 of 620 in IL
Livability — Geneseo
- Score
- 83/100
- State rank
- #45
- US rank
- #907
Category grades
Schools grade is shown separately in the Schools card above.
Census & demographics
- Census place
- Geneseo, IL
- City population
- 12,049
- Population (ZIP)
- 12,049
Population outlook (Henry County) Hauer SSP2
- Today (2025)
- 47,376 people
- By 2030
- 45,920 · -3.1%
- By 2040
- 42,829 · -9.6%
- By 2050
- 39,606 · -16.4%
- By 2075
- 31,848 · -32.8%
- By 2100
- 23,503 · -50.4%
Race, ethnicity, and origin ACS 2023
- Neighborhood character
- Predominantly White (91%)
- Race & ethnicity
- White 91% Two or more races 7% Hispanic / Latino 6%
- Hispanic origin (detail)
- Mexican 6%
- Common ancestry
- English 9% Romanian 4% Portuguese 3%
- Foreign-born
- 1% · Canada, China
- Languages at home
- 96% English-only · Spanish 3%
Political lean MEDSL · Henry
- 2024 margin
- Strong R (+24.5) · D 36.8% · R 61.3% · Other 1.9%
- 2008→2024 swing
- -32.2pp toward R · 2008: 7.7pp · 2024: -24.5pp
- All cycles
- 2024: R+24.5 2020: R+21.4 2016: R+21.2 2012: D+3.1 2008: D+7.7
Not yet ingested
- Civics
- —
Market trends
- HPI YoY
- ▼ -74.08%
- Current HPI
- 157.4041
- Rent YoY
- —
- Metro
- —
- State GDP YoY
- ▲ 1.59%
- F500 in state
- 60
Industry mix (Fortune 500 HQ in IL)
| Industry | F500 HQs | Revenue |
|---|---|---|
| Insurance | 4 | $201B |
|
||
| Consumer Goods | 4 | $87B |
|
||
| Industrial Machinery | 3 | $64B |
|
||
| Healthcare | 2 | $55B |
|
||
| Retail / Pharmacy | 1 | $148B |
|
||
| Agriculture / Food | 1 | $86B |
|
||
Price history
1 event — show timeline
- 2026-06-02 Listed $182,500 MRED as Distributed by MLS Grid
Property tax history
+3.9%/yrLatest (2024): $2,855 · +16.1% YoY. Source: county tax records.
Cash-flow waterfall
monthlySold comps — $/sqft
last 12 mo · ≤1 miLoading sold comps…