1804 Maury St · Richmond, VA
Flood risk No data
- FEMA flood zone
- —
- Chance of flooding over 30 yrs
- —
- Est. flood insurance / yr
- —
Fire risk No data
- Est. fire insurance / yr
- —
Heat risk No data
- Hot days now (above threshold)
- —
- Hot days in 30 yrs
- —
Wind risk No data
- Chance of severe wind over 30 yrs
- —
Air-quality risk No data
- Unhealthy air days now
- —
- Unhealthy air days in 30 yrs
- —
Risk factors via First Street. Map © Google.
Why this score? — see what drove the C grade
The composite is a weighted blend of 9 inputs, each scored 0–100. Each bar is that input's sub-score; the figure is the points it added to the 100-point composite (weight × sub-score).
- Cash flow +16.6/30.0
- ARV discount +15.0/15.0
- DSCR +5.1/10.0
- 1% rule +4.5/10.0
- Livability +4.2/5.0
- Condition / age +4.0/5.0
- Rent growth +3.6/5.0
- Schools +3.3/10.0
- Appreciation +0.0/10.0
$235,000
🖨 Deal sheet (PDF) 📄 Offer letter ✓ Due diligence
Listing remarks
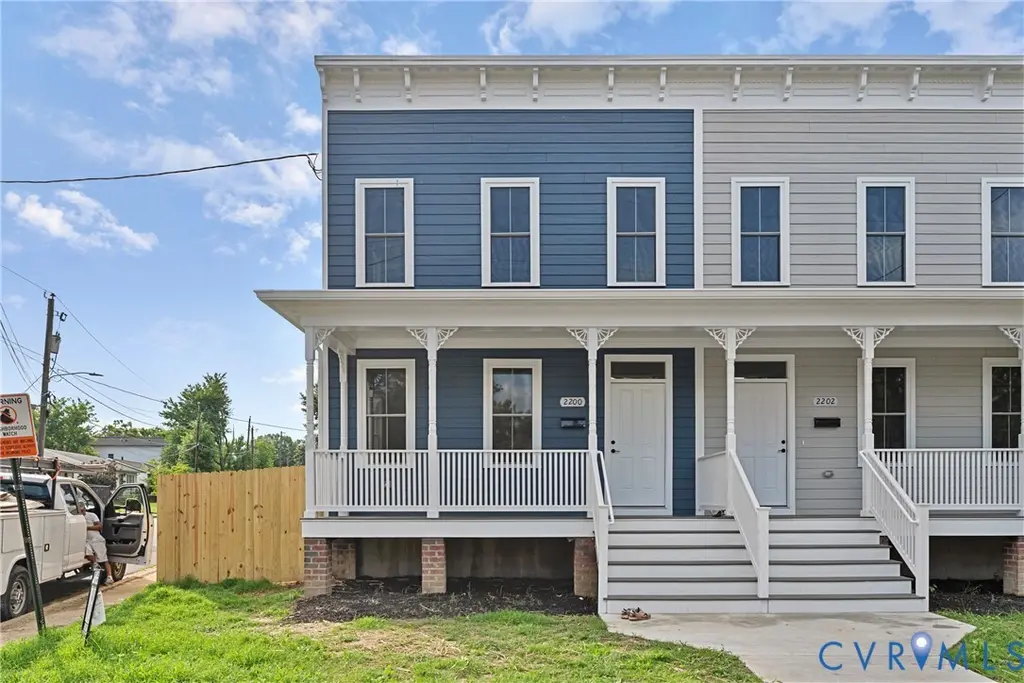
Minutes from downtown Richmond in blossoming Blackwell enjoy this gorgeously constructed 4 bedrooms, 2.5 bath featuring 1,720 SF with a 1st floor bedroom, nice open living space and boasting 3 covered porches, front, rear 1st floor and 2nd floor for great outdoor living! Loaded with upgrades and features some include hardwoods throughout, recessed lights, tiled bathrooms and more! Walk onto a full covered front porch featuring Trex Decking overlooking the tree lined street. Spacious living room with sight line into the kitchen and out onto the covered side porch features hardwoods and recessed lights! Nice sized kitchen with classic white shaker style cabinets, SS Appliances, hardwoods and
Key facts
- Double closet
- 3 covered porches
- 1st floor bedroom
Tags
Neighborhood map
What this means for you Summary
Snapshot
- This is a 4-bed/2.5-bath single-family listed at $235k. Condition is rated good.
Deal economics
- At list price, monthly cash flow is $140 ($2k/yr) — positive.
- The deal already cash-flows at list — no discount required.
- To meet the 1% rule (rent ≥ 1% of price), the offer needs to be $223k (5.0% below list).
- Recommended offer: $223k (5.0% below list) — sets the bar for 1% rule.
- Cap rate 7.0% vs local median 3.3% in Richmond — top-decile yield for the area; either an underpriced asset or a hidden risk that comps aren't pricing in. Stress-test before assuming the spread holds.
Location & tenants
- Location reads 84/100 on livability (#33 in VA, #793 nationally) — a professional / high-income tenant draw. Strengths: amenities A+, commute A+, health & safety A+; Watch: crime D-.
- Richmond City Public School District (urban): math 32% / reading 47% proficiency, ranked #123 of 131 in VA (top 94%) — families likely to look elsewhere, expect single-tenant / working-renter base with shorter leases; 74% free/reduced lunch — lower-income household profile, screen leases tightly.
- Market conditions: Rents rising fast (+4.5%/yr); 173 active listings in the ZIP; 21 comparable units currently listed for rent nearby; rentals at typical pace (median 20d on market — plan ~3-4 weeks tenant-placement turnaround); 2,540 units permitted in Richmond city in 2024 (2,077 in 5+ unit buildings).
- At $2,233/mo this rent would consume 53% of the median local household income ($50k/yr) (locally 3584% of renters already pay >50% of income on rent) — very limited rent-growth headroom before tenants either downsize or default.
Forward outlook
- Local home prices are declining (-3.0%/yr); year-one equity from $2k of loan paydown is wiped out by about $7k of value loss. Plan a longer hold.
- Richmond County population projected at +40% by 2050 — long-run rental-demand tailwind backs the buy-and-hold thesis.
Negotiation context
- Only 3 days on market — expect competitive offers; lowballing is unlikely to land.
Questions for the listing agent
- Is there a deadline driving the sale (1031 exchange, divorce, estate, relocation)? That informs how much negotiation room exists.
- Schools are A-rated — typically a magnet for longer-tenancy family renters. What's the average tenant stay here, and is there a school-zone premium baked into asking?
- Crime grade is D in this area — have there been break-ins, vandalism, or insurance claims at this property in the last 3 years? What carrier currently insures it and at what premium?
- What's the average days-on-market for RENTAL listings here right now (not sales)? A rising rental-DOM trend means longer vacancies and softer asking-rent achievability than the comps imply.
- What's the recent tenant-quality profile in this submarket — average credit score on applications, eviction rate, late-payment / NSF rate, and stable-employment percentage? A property-management company in the area should have these aggregated.
- How much new for-sale + rental construction is in the pipeline within 1–3 miles? Heavy new supply typically softens prices + rents 12–24 months out; constrained supply supports both.
Investment metrics
- 1% rule
- 0.95% ✗
- Cap rate
- 7.01%
- Cash-on-cash
- 2.56%
- DSCR
- 1.11
- GRM
- 8.8
CMA / ARV
- ARV (on-the-fly)
- $392,160
- Comps found
- 12
Show comp detail 12 sales within ~0.75 mi
| Address | Dist | Beds/Ba | Sqft | Sold | Price | $/sf | Match |
|---|---|---|---|---|---|---|---|
| 1804 Maury St | 0.00mi | 4/2.5 | 1,720 (0%) | 1mo | $300,000 | $174 | 99 |
| 1806 Maury St | 0.01mi | 4/2.5 | 1,720 (0%) | 1mo | $300,000 | $174 | 99 |
| 210 E 18th St | 0.12mi | 3/2.5 (-1) | 1,826 (+6%) | 2mo | $348,500 | $191 | 77 |
| 2118 Chicago Ave | 0.28mi | 3/2.5 (-1) | 1,678 (-2%) | 1mo | $305,000 | $182 | 76 |
| 1800 Maury St | 0.01mi | 3/2.5 (-1) | 1,487 (-14%) | 1mo | $285,000 | $192 | 71 |
| 2500 Hargrove St | 0.69mi | 3/2.5 (-1) | 1,728 (+0%) | 0mo | $397,500 | $230 | 62 |
| 2019 Dinwiddie Ave | 0.26mi | 3/2.5 (-1) | 1,490 (-13%) | 1mo | $340,000 | $228 | 60 |
| 1813 Fairfax Ave | 0.35mi | 3/2.5 (-1) | 1,522 (-12%) | 1mo | $355,000 | $233 | 59 |
| 2004 Ingram Ave | 0.59mi | 4/2.0 | 1,554 (-10%) | 1mo | $280,100 | $180 | 54 |
| 2222 1/2 Perry St | 0.64mi | 3/2.5 (-1) | 1,906 (+11%) | 1mo | $435,000 | $228 | 46 |
| 1110 Perry St | 0.63mi | 3/2.0 (-1) | 1,503 (-13%) | 2mo | $360,000 | $240 | 41 |
| 1101 Porter St | 0.62mi | 3/3.0 (-1) | 1,964 (+14%) | 1mo | $500,000 | $255 | 40 |
Match score weights: distance 35% · size 25% · config 20% · recency 20%. Top-matched comps best support the ARV.
Projected returns pro-forma
-3.0% appreciation · 4.55% rent growth · sell at horizon
- IRR
- -10.5%
- Equity multiple
- 0.61×
- Total profit
- $-25,566
- Equity at exit
- $35,039
- IRR
- 0.9%
- Equity multiple
- 1.07×
- Total profit
- $4,370
- Equity at exit
- $20,319
Cash invested: $65,800 (down + closing). Projections, not guarantees.
Landlord ↔ Tenant lean methodology
- Overall (STATE)
- 55 Moderately Landlord-Leaning
- State Virginia
- 55 Moderately Landlord-Leaning · D+2
- County
- — inherits STATE
- City
- — inherits STATE
ZIP-level market 23224
- Rents YoY
- 4.5%
- Active inventory
- 173
- Price-to-rent
- 8.8×
Monthly cashflow live
- Estimated rent
- $2,233 high interval (Pro) →
- Mortgage (P&I)
- −$1,232
- Tax est. 1.5%
- −$294 /mo · $3,525/yr
- Insurance
- −$98
- HOA
- −$0
- Vacancy / Maint / Mgmt
- −$469
- Net cashflow
- $140
Break-even live
Sensitivity live
| Price | -10% $303 | -5% $222 | +0% $140 | +5% $59 | +10% $-22 |
|---|---|---|---|---|---|
| Rent | -10% $-36 | -5% $52 | +0% $140 | +5% $229 | +10% $317 |
| Rate | -1.0pp $259 | -0.5pp $200 | base $140 | +0.5pp $80 | +1.0pp $18 |
UW: 25.0% down · 7.5% · 30yr · 1.5% tax · 5.0% vac · 8.0% maint · 8.0% mgmt
Financing live
Cash to close
- Down payment
- $58,750
- Closing costs
- $7,050
- Reserves months
- —
- Total cash needed
- —
Loan-product check · same deal, 3 products live
Conventional
25% down · 7.5% · 30yr
- Down + closing
- —
- Monthly P&I
- —
- Monthly cashflow
- —
- DSCR
- —
- Eligible?
- —
Personal DTI + credit; lowest rate.
DSCR
20% down · 8.5% · 30yr
- Down + closing
- —
- Monthly P&I
- —
- Monthly cashflow
- —
- DSCR
- —
- Eligible?
- —
No personal income docs; deal must DSCR.
Hard money
10% down · 12.0% · 12mo
- Down + closing
- —
- Monthly P&I
- —
- Monthly cashflow
- —
- DSCR
- —
- Eligible?
- —
Short-term bridge; refi at stabilization.
Rent comps 21 comps
| Address | Beds | Baths | Sqft | Rent | $/sqft | DOM | Units | Dist |
|---|---|---|---|---|---|---|---|---|
| 1719 Everett St Richmond, VA | 3.0 | 2.5 | 1748 | $2,255 | $1.29 | 44d | 1 | 0.11mi |
| 1709 Everett St Richmond, VA | 4.0 | 1.5 | 1460 | $1,995 | $1.37 | 44d | 1 | 0.12mi |
| 107 E 16th St Richmond, VA | 4.0 | 2.5 | 1608 | $2,350 | $1.46 | 11d | 1 | 0.23mi |
| 116 E 15th St Richmond, VA | 4.0 | 2.0 | 1452 | $2,250 | $1.55 | 24d | 1 | 0.27mi |
| 1912 Porter St Richmond, VA | 3.0 | 1.5 | 1415 | $1,950 | $1.38 | 24d | 1 | 0.46mi |
| 1529 Porter St Unit A Richmond, VA | 3.0 | 2.5 | 1711 | $2,400 | $1.40 | 24d | 1 | 0.49mi |
| 1112 E 16th St Richmond, VA | 4.0 | 1.0 | 1206 | $1,595 | $1.32 | 44d | 1 | 0.50mi |
| 1411 Porter St Unit B Richmond, VA | 3.0 | 3.0 | 1500 | $2,145 | $1.43 | 5d | 1 | 0.53mi |
| 1212 Porter St Unit B Richmond, VA | 3.0 | 2.5 | 1837 | $2,300 | $1.25 | 44d | 1 | 0.57mi |
| 1211 Porter St Richmond, VA | 3.0 | 3.0 | 1571 | $2,495 | $1.59 | 20d | 1 | 0.59mi |
| 2117 Old Manchester St Richmond, VA | 3.0 | 4.0 | 1960 | $2,695 | $1.38 | 11d | 1 | 0.62mi |
| 1100 Richmond Hwy Richmond, VA | 1.0–3.0 | 1.0–2.0 | 1062 | $2,345 | $2.21 | 2d | 16 | 0.62mi |
| 1429 McDonough St Richmond, VA | 1.0–3.0 | 1.0–2.0 | 826 | $2,469 | $2.99 | 2d | 15 | 0.66mi |
| 2522 Porter St Richmond, VA | 3.0 | 2.5 | 1390 | $1,800 | $1.29 | 44d | 1 | 0.66mi |
| 2104 Boro Ridge St Richmond, VA | 3.0 | 2.5 | 1916 | $2,775 | $1.45 | 44d | 1 | 0.67mi |
| 15 W 7th St Richmond, VA | 1.0–3.0 | 1.0–2.5 | 881 | $3,031 | $3.44 | 2d | 6 | 0.76mi |
| 815 Perry St Richmond, VA | 1.0–3.0 | 1.0–2.0 | 1004 | $1,800 | $1.79 | 2d | 10 | 0.80mi |
| 84 W 6th St Richmond, VA | 3.0 | 2.0 | 1493 | $2,715 | $1.82 | 4d | 1 | 0.80mi |
| 403 Stockton St Richmond, VA | 1.0–3.0 | 1.0–2.0 | 882 | $2,140 | $2.42 | 4d | 22 | 0.83mi |
| 3154 Stockton St Richmond, VA | 3.0 | 1.0 | 1169 | $1,600 | $1.37 | 44d | 1 | 1.09mi |
| 3 E Blake Ln Richmond, VA | 3.0 | 1.5 | 2065 | $2,000 | $0.97 | 4d | 1 | 1.10mi |
Listing history 2 events
-
2026-04-09status Pending
-
2026-04-03$235,000 Active
ⓘ Source: listings_history table (triggers on properties + properties_extension) + one-shot
backfill from property_details.listing_events for pre-trigger history.
Nearby sold comps map
Loading sold comps map…
Walkable amenities ~0.75 mi
Loading nearby amenities…
Taxation est. · year 1
- Rental income
- $26,802
- − Mortgage interest
- −$13,164
- − Property taxes
- −$3,525
- − Insurance
- −$1,175
- − Repairs & maintenance
- −$2,144
- − Management
- −$2,144
- − Depreciation
- −$6,836
- Taxable loss
- −$2,187
- Est. tax savings @ 24.0%
- +$525
- After-tax cash flow
- $2,210/yr
For passive investors: Depreciation is non-cash, so a rental often shows a tax loss while cash-flowing — sheltering income. Rental losses are passive: they offset passive income freely, and up to $25,000/yr can offset ordinary (W-2) income if you actively participate and your MAGI is under $100k (phasing out to $0 by $150k); unused losses carry forward. On sale, claimed depreciation is recaptured at up to 25%, and gains may owe capital-gains tax (a 1031 exchange can defer both). Figures are a year-1 estimate at your 24.0% rate — not tax advice; consult a CPA.
Condition & rehab AI · 12 photos
This home is in excellent condition with modern updates and a great location. It's move-in ready and would benefit from some exterior enhancements to maximize its value.
Value-add opportunities
- Resale Paint exterior trim and siding — Enhances curb appeal and can add value
- Both Install smart home devices — Improves convenience and can attract tech-savvy buyers
- Both Add outdoor lighting — Enhances safety and curb appeal
Renovation cost estimate screening
Value-add ROI direction
- Resale Paint exterior trim and siding — Enhances curb appeal and can add value ↑
- Both Install smart home devices — Improves convenience and can attract tech-savvy buyers ↑
- Both Add outdoor lighting — Enhances safety and curb appeal ↑
ⓘ Cost ranges are severity-bucket heuristics (US national rule-of-thumb). Get contractor quotes + a written scope before underwriting a rehab budget.
Schools (NCES district)
- District
- Richmond City Public School District
- NCES district ID
- 5103240
- Math proficiency
- 32% ▼ -24.00%
- Reading proficiency
- 47% ▼ -9.00%
- Median HH income
- $40,276
- Composite
- 33.09/100
- National rank
- #5564
- State rank
- #123 of 131 in VA
Livability — Richmond
- Score
- 84/100
- State rank
- #33
- US rank
- #793
Category grades
Schools grade is shown separately in the Schools card above.
Census & demographics
- Census place
- Richmond, VA
- County
- Richmond City · 178,280 people
- City population
- 287,109
- Metro
- Richmond, VA
- Population (ZIP)
- 40,575
- Household income
- $50,475
- Rent vs Own
- Severe rent burden
- 3584.0
Population outlook (Richmond County) Hauer SSP2
- Today (2025)
- 262,263 people
- By 2030
- 284,503 · +8.5%
- By 2040
- 327,353 · +24.8%
- By 2050
- 367,946 · +40.3%
- By 2075
- 449,560 · +71.4%
- By 2100
- 500,301 · +90.8%
Race, ethnicity, and origin ACS 2023
- Neighborhood character
- Diverse neighborhood (Simpson 0.58)
- Race & ethnicity
- Black 59% Hispanic / Latino 22% White 15% Two or more races 6%
- Hispanic origin (detail)
- Mexican 5% Puerto Rican 2%
- Common ancestry
- Romanian 1% Lithuanian 1% Serbian 1%
- Foreign-born
- 17% · Canada
- Languages at home
- 78% English-only · Spanish 19% French/Haitian/Cajun 1%
Political lean MEDSL · Richmond
- 2024 margin
- Solid D (+66.3) · D 82.0% · R 15.8% · Other 2.2%
- 2008→2024 swing
- +7.2pp toward D · 2008: 59.1pp · 2024: 66.3pp
- All cycles
- 2024: D+66.3 2020: D+68.0 2016: D+63.8 2012: D+55.7 2008: D+59.1
Not yet ingested
- Civics
- —
Market trends
- HPI YoY
- ▼ -283.99%
- Current HPI
- 336.9345
- Rent YoY
- ▲ 4.55%
- Metro
- Richmond, VA
- State GDP YoY
- ▲ 2.40%
- F500 in state
- 50
Industry mix (Fortune 500 HQ in VA)
| Industry | F500 HQs | Revenue |
|---|---|---|
| Aerospace / Defense | 4 | $236B |
|
||
| Technology / Defense | 3 | $32B |
|
||
| Financial Services | 2 | $176B |
|
||
| Utilities | 2 | $27B |
|
||
| Insurance | 2 | $25B |
|
||
| Technology | 2 | $15B |
|
||
Price history
2 events — show timeline
- 2026-04-09 Pending — CVRMLS
- 2026-04-03 Listed $235,000 CVRMLS
Cash-flow waterfall
monthlySold comps — $/sqft
last 12 mo · ≤1 miLoading sold comps…