118 Tall Cedar Way · Wylie, TX
Flood risk No data
- FEMA flood zone
- —
- Chance of flooding over 30 yrs
- —
- Est. flood insurance / yr
- —
Fire risk No data
- Est. fire insurance / yr
- —
Heat risk No data
- Hot days now (above threshold)
- —
- Hot days in 30 yrs
- —
Wind risk No data
- Chance of severe wind over 30 yrs
- —
Air-quality risk No data
- Unhealthy air days now
- —
- Unhealthy air days in 30 yrs
- —
Risk factors via First Street. Map © Google.
Why this score? — see what drove the D+ grade
The composite is a weighted blend of 9 inputs, each scored 0–100. Each bar is that input's sub-score; the figure is the points it added to the 100-point composite (weight × sub-score).
- Cash flow +14.1/30.0
- ARV discount +11.9/15.0
- DSCR +4.3/10.0
- 1% rule +4.2/10.0
- Schools +4.2/10.0
- Condition / age +4.0/5.0
- Livability +3.5/5.0
- Rent growth +2.2/5.0
- Appreciation +0.0/10.0
$226,990
🖨 Deal sheet 📄 Offer letter ✓ Due diligence
Listing remarks MLS
New homes in Princeton, TX! Welcome to Arbor Trails! This gorgeous new Express homes community is located in Collin County, Branch ,Princeton area off CR 437. DR Horton, your new home builder, we offer 3 different plans in Arbor Trails ranging from a 2 2.5 1 1,130 sq ft to a 4 2.5 1 that's 1,549 sq ft.
Key facts
- 6,050 sq ft lot
- Garage
- Built 2026
Neighborhood map
What this means for you Summary
Snapshot
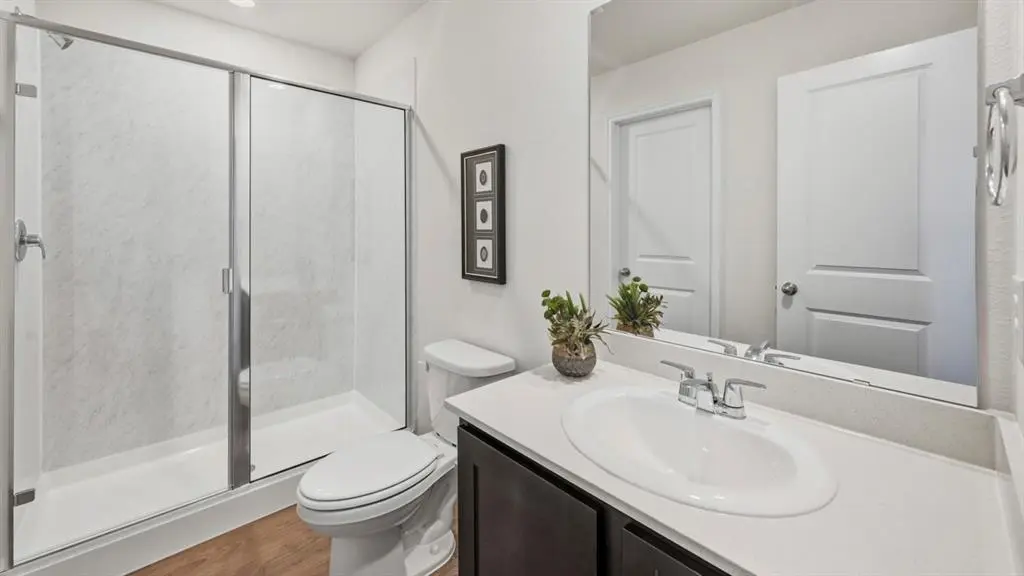
- This is a 4-bed/2.5-bath single-family listed at $227k. Condition is rated good.
Deal economics
- At list price, monthly cash flow is $34 ($408/yr) — positive.
- The deal already cash-flows at list — no discount required.
- To meet the 1% rule (rent ≥ 1% of price), the offer needs to be $208k (8.3% below list).
- Recommended offer: $208k (8.3% below list) — sets the bar for 1% rule.
- Cap rate 6.5% vs local median 4.0% in Wylie — top-decile yield for the area; either an underpriced asset or a hidden risk that comps aren't pricing in. Stress-test before assuming the spread holds.
Location & tenants
- Location reads 69/100 on livability (#419 in TX) — a middle-class / working-renter tenant base. Strengths: crime A+, employment A+, housing A+; Watch: amenities F, commute F, health & safety F.
- Princeton ISD (suburban): math 51% / reading 47% proficiency, ranked #188 of 826 in TX (top 23%) — families likely to look elsewhere, expect single-tenant / working-renter base with shorter leases.
- Market conditions: Rents soft (-1.0%/yr); 1404 active listings in the ZIP; 40 comparable units currently listed for rent nearby; rentals at typical pace (median 24d on market — plan ~3-4 weeks tenant-placement turnaround); solid renter incomes; 19,194 units permitted in Collin County in 2024 (3,988 in 5+ unit buildings).
Forward outlook
- Local home prices are declining (-3.0%/yr); year-one equity from $2k of loan paydown is wiped out by about $7k of value loss. Plan a longer hold.
- Collin County population projected at +60% by 2050 — long-run rental-demand tailwind backs the buy-and-hold thesis.
Negotiation context
- It's been on market 48 days — a 3% lower offer ($220k) is reasonable based on typical stale-listing flexibility.
Questions for the listing agent
- It's been on market 48 days. Have you received any prior offers? Is the seller open to a 8% concession, seller financing, or rate buy-down credit?
- What does the HOA fee cover, when was the last increase, and are there any pending special assessments or reserve-fund shortfalls?
- Is there a deadline driving the sale (1031 exchange, divorce, estate, relocation)? That informs how much negotiation room exists.
- Schools are B-rated — typically a magnet for longer-tenancy family renters. What's the average tenant stay here, and is there a school-zone premium baked into asking?
- The area grade is low — what's the realistic commute time and amenity access for the typical tenant pool here? Any planned neighborhood developments (good or bad) we should know about?
- What's the average days-on-market for RENTAL listings here right now (not sales)? A rising rental-DOM trend means longer vacancies and softer asking-rent achievability than the comps imply.
- What's the recent tenant-quality profile in this submarket — average credit score on applications, eviction rate, late-payment / NSF rate, and stable-employment percentage? A property-management company in the area should have these aggregated.
- How much new for-sale + rental construction is in the pipeline within 1–3 miles? Heavy new supply typically softens prices + rents 12–24 months out; constrained supply supports both.
Investment metrics
- 1% rule
- 0.92% ✗
- Cap rate
- 6.47%
- Cash-on-cash
- 0.64%
- DSCR
- 1.03
- GRM
- 9.1
CMA / ARV
- ARV (median comp)
- $251,740
- List price
- $226,990
- Delta
- -9.83%
- Verdict
- FAIR
- Comps
- 20 within 1.0 mi
Show comp detail 12 sales within ~0.75 mi
| Address | Dist | Beds/Ba | Sqft | Sold | Price | $/sf | Match |
|---|---|---|---|---|---|---|---|
| 123 Tall Cedar Way | 0.03mi | 4/2.5 | 1,648 (0%) | 1mo | $236,990 | $144 | 98 |
| 120 Redwood Rd | 0.09mi | 4/2.5 | 1,720 (+4%) | 0mo | $255,990 | $149 | 88 |
| 204 Redwood Rd | 0.10mi | 3/2.5 (-1) | 1,489 (-10%) | 1mo | $237,990 | $160 | 73 |
| 211 Arbor Dr | 0.09mi | 3/2.5 (-1) | 1,895 (+15%) | 0mo | $264,990 | $140 | 65 |
| 118 Redwood Dr | 0.09mi | 3/2.5 (-1) | 1,895 (+15%) | 1mo | $264,990 | $140 | 65 |
| 200 Redwood Rd | 0.10mi | 3/2.5 (-1) | 1,895 (+15%) | 1mo | $264,990 | $140 | 64 |
| 7009 Cottonseed Dr | 0.11mi | 3/2.5 (-1) | 1,895 (+15%) | 0mo | $264,990 | $140 | 64 |
| 210 Redwood Dr | 0.11mi | 3/2.5 (-1) | 1,895 (+15%) | 1mo | $270,480 | $143 | 64 |
| 6414 Willet Rd | 0.58mi | 3/2.0 (-1) | 1,402 (-15%) | 1mo | $252,999 | $180 | 40 |
| 6508 Glade St | 0.59mi | 3/2.0 (-1) | 1,402 (-15%) | 1mo | $222,999 | $159 | 40 |
| 416 Sandhill Crane Ln | 0.63mi | 3/2.0 (-1) | 1,402 (-15%) | 0mo | $221,999 | $158 | 39 |
| 6412 Longspur Ln | 0.63mi | 3/2.0 (-1) | 1,402 (-15%) | 0mo | $222,999 | $159 | 39 |
Match score weights: distance 35% · size 25% · config 20% · recency 20%. Top-matched comps best support the ARV.
Projected returns pro-forma
-3.0% appreciation · 0.0% rent growth · sell at horizon
- IRR
- -18.8%
- Equity multiple
- 0.36×
- Total profit
- $-40,662
- Equity at exit
- $33,845
- IRR
- -19.1%
- Equity multiple
- 0.12×
- Total profit
- $-55,967
- Equity at exit
- $19,626
Cash invested: $63,557 (down + closing). Projections, not guarantees.
Landlord ↔ Tenant lean methodology
- Overall (STATE)
- 87 Strongly Landlord-Friendly
- State Texas
- 87 Strongly Landlord-Friendly · R+5
- County
- — inherits STATE
- City
- — inherits STATE
ZIP-level market 75407
- Home prices YoY
- -30.3%
- Rents YoY
- -1.0%
- Active inventory
- 1404
- Price-to-rent
- 9.1×
Monthly cashflow live
- Estimated rent
- $2,082 high interval (Pro) →
- Mortgage (P&I)
- −$1,190
- Tax est. 1.5%
- −$284 /mo · $3,405/yr
- Insurance
- −$95
- HOA
- −$42
- Vacancy / Maint / Mgmt
- −$437
- Net cashflow
- $34
Break-even live
UW: 25.0% down · 7.5% · 30yr · 1.5% tax · 5.0% vac · 8.0% maint · 8.0% mgmt
Financing live
Cash to close
- Down payment
- $56,748
- Closing costs
- $6,810
- Reserves months
- —
- Total cash needed
- —
Loan-product check · same deal, 3 products live
Conventional
25% down · 7.5% · 30yr
- Down + closing
- —
- Monthly P&I
- —
- Monthly cashflow
- —
- DSCR
- —
- Eligible?
- —
Personal DTI + credit; lowest rate.
DSCR
20% down · 8.5% · 30yr
- Down + closing
- —
- Monthly P&I
- —
- Monthly cashflow
- —
- DSCR
- —
- Eligible?
- —
No personal income docs; deal must DSCR.
Hard money
10% down · 12.0% · 12mo
- Down + closing
- —
- Monthly P&I
- —
- Monthly cashflow
- —
- DSCR
- —
- Eligible?
- —
Short-term bridge; refi at stabilization.
Rent comps 40 comps
| Address | Beds | Baths | Sqft | Rent | $/sqft | DOM | Units | Dist |
|---|---|---|---|---|---|---|---|---|
| 125 Arbor Dr Unit NA Princeton, TX | 4.0 | 2.5 | 2054 | $2,097 | $1.02 | 24d | 1 | 0.05mi |
| 213 Arbor DR Princeton, TX | 4.0 | 2.5 | 1720 | $2,000 | $1.16 | 43d | 1 | 0.07mi |
| 316 Arbor DR Princeton, TX | 4.0 | 2.5 | 1648 | $1,799 | $1.09 | 24d | 1 | 0.07mi |
| 213 Arbor DR Princeton, TX | 4.0 | 2.5 | 1720 | $1,800 | $1.05 | 2d | 1 | 0.07mi |
| 120 Redwood Rd Princeton, TX | 4.0 | 2.5 | 1720 | $2,300 | $1.34 | 1d | 1 | 0.07mi |
| 151 Sesame Ln Princeton, TX | 4.0 | 2.0 | 1299 | $1,634 | $1.26 | 24d | 1 | 0.09mi |
| 7007 Cottonseed Dr Princeton, TX | 4.0 | 2.5 | 1720 | $1,995 | $1.16 | 10d | 1 | 0.11mi |
| 7007 Cottonseed Dr Princeton, TX | 4.0 | 2.5 | 1720 | $1,995 | $1.16 | 7d | 1 | 0.11mi |
| 7018 Cottonseed Dr Princeton, TX | 4.0 | 2.5 | 2131 | $2,095 | $0.98 | 24d | 1 | 0.11mi |
| 7012 Cottonseed Dr Princeton, TX | 4.0 | 2.5 | 1800 | $1,878 | $1.04 | 20d | 1 | 0.13mi |
| 101 County Road 1010 Unit 1010 Princeton, TX | 3.0 | 2.0 | 1860 | $2,295 | $1.23 | 43d | 1 | 0.16mi |
| 321 Tall Cedar Way Princeton, TX | 3.0 | 3.0 | 1468 | $1,725 | $1.18 | 43d | 1 | 0.16mi |
| 6808 Sunbeam Cir Princeton, TX | 3.0 | 2.0 | 1155 | $1,534 | $1.33 | 21d | 1 | 0.16mi |
| 252 Jethro Ln Princeton, TX | 4.0 | 2.0 | 1300 | $1,595 | $1.23 | 43d | 1 | 0.19mi |
| 119 Sunflower St Princeton, TX | 4.0 | 2.0 | 1300 | $1,999 | $1.54 | 12d | 1 | 0.20mi |
| 7016 Vining Dr Princeton, TX | 4.0 | 2.5 | 1648 | $2,000 | $1.21 | 43d | 1 | 0.21mi |
| 6739 Coulter Dr Princeton, TX | 3.0 | 2.0 | 1155 | $1,500 | $1.30 | 43d | 1 | 0.22mi |
| 7020 Vining DR Princeton, TX | 3.0 | 2.5 | 1382 | $1,850 | $1.34 | 24d | 1 | 0.22mi |
| 206 Sunflower St Princeton, TX | 3.0 | 2.0 | 1155 | $1,475 | $1.28 | 20d | 1 | 0.23mi |
| 422 Tall Cedar Way Princeton, TX | 4.0 | 3.0 | 1648 | $1,795 | $1.09 | 43d | 1 | 0.23mi |
| 230 Sunflower St Princeton, TX | 4.0 | 2.0 | 1300 | $1,560 | $1.20 | 24d | 1 | 0.23mi |
| 241 Thresher Ln Princeton, TX | 4.0 | 2.0 | 1295 | $1,850 | $1.43 | 24d | 1 | 0.26mi |
| 6751 Highlands St Princeton, TX | 3.0 | 2.0 | 1411 | $1,639 | $1.16 | 16d | 1 | 0.26mi |
| 152 Thresher Ln Princeton, TX | 4.0 | 2.0 | 1300 | $1,750 | $1.35 | 12d | 1 | 0.27mi |
| 211 Herman Ln Princeton, TX | 4.0 | 2.0 | 1295 | $1,595 | $1.23 | 43d | 1 | 0.29mi |
| 6561 Alfalfa St Princeton, TX | 3.0 | 2.0 | 1436 | $1,599 | $1.11 | 43d | 1 | 0.36mi |
| 6550 August Dr Princeton, TX | 3.0 | 2.0 | 1407 | $1,695 | $1.20 | 3d | 1 | 0.37mi |
| 6533 Middlebury Dr Princeton, TX | 4.0 | 2.0 | 1598 | $1,900 | $1.19 | 4d | 1 | 0.41mi |
| 639 Montclair Ave , TX | 4.0 | 2.0 | 1707 | $1,850 | $1.08 | 7d | 1 | 0.45mi |
| 639 Montclair Ave , TX | 4.0 | 2.0 | 1707 | $2,100 | $1.23 | 43d | 1 | 0.45mi |
| 6744 Teal Cir Princeton, TX | 3.0 | 2.0 | 1474 | $1,790 | $1.21 | 20d | 1 | 0.46mi |
| 619 Fisher Ln Princeton, TX | 3.0 | 2.0 | 1260 | $1,600 | $1.27 | 43d | 1 | 0.48mi |
| 214 Wheatgrass Ln Princeton, TX | 3.0 | 2.0 | 1407 | $1,699 | $1.21 | 43d | 1 | 0.49mi |
| 538 Montclair Ave Princeton, TX | 3.0 | 2.0 | 1260 | $1,775 | $1.41 | 10d | 1 | 0.49mi |
| 6445 Middlebury Dr Princeton, TX | 3.0 | 2.0 | 1266 | $1,649 | $1.30 | 7d | 1 | 0.49mi |
| 545 Holleman Dr Princeton, TX | 3.0 | 2.0 | 1474 | $1,750 | $1.19 | 43d | 1 | 0.50mi |
| 427 Bower DR Princeton, TX | 4.0 | 2.0 | 1600 | $1,850 | $1.16 | 24d | 1 | 0.51mi |
| 402 Harvest St Princeton, TX | 3.0 | 2.0 | 1433 | $1,665 | $1.16 | 12d | 1 | 0.53mi |
| 613 Holleman Dr , TX | 3.0 | 2.0 | 1260 | $2,000 | $1.59 | 24d | 1 | 0.55mi |
| 416 Finch CIR Princeton, TX | 3.0 | 2.0 | 1266 | $1,350 | $1.07 | 43d | 1 | 0.56mi |
HOA detail
- Monthly dues
- $42 · $504/yr
Listing history 3 events
-
2026-05-06price $226,990 304-char remark
Show marketing remark (304 chars)
New homes in Princeton, TX! Welcome to Arbor Trails! This gorgeous new Express homes community is located in Collin County, Branch ,Princeton area off CR 437. DR Horton, your new home builder, we offer 3 different plans in Arbor Trails ranging from a 2 2.5 1 1,130 sq ft to a 4 2.5 1 that's 1,549 sq ft.
-
2026-04-10price $236,990 304-char remark
Show marketing remark (304 chars)
New homes in Princeton, TX! Welcome to Arbor Trails! This gorgeous new Express homes community is located in Collin County, Branch ,Princeton area off CR 437. DR Horton, your new home builder, we offer 3 different plans in Arbor Trails ranging from a 2 2.5 1 1,130 sq ft to a 4 2.5 1 that's 1,549 sq ft.
-
2026-04-02$246,990 Active 304-char remark
Show marketing remark (304 chars)
New homes in Princeton, TX! Welcome to Arbor Trails! This gorgeous new Express homes community is located in Collin County, Branch ,Princeton area off CR 437. DR Horton, your new home builder, we offer 3 different plans in Arbor Trails ranging from a 2 2.5 1 1,130 sq ft to a 4 2.5 1 that's 1,549 sq ft.
ⓘ Source: listings_history table (triggers on properties + properties_extension) + one-shot
backfill from property_details.listing_events for pre-trigger history.
Nearby sold comps map
Loading sold comps map…
Walkable amenities ~0.75 mi
Loading nearby amenities…
Taxation est. · year 1
- Rental income
- $24,982
- − Mortgage interest
- −$12,715
- − Property taxes
- −$3,405
- − Insurance
- −$1,135
- − Repairs & maintenance
- −$1,999
- − Management
- −$1,999
- − HOA
- −$504
- − Depreciation
- −$6,603
- Taxable loss
- −$3,377
- Est. tax savings @ 24.0%
- +$811
- After-tax cash flow
- $1,218/yr
For passive investors: Depreciation is non-cash, so a rental often shows a tax loss while cash-flowing — sheltering income. Rental losses are passive: they offset passive income freely, and up to $25,000/yr can offset ordinary (W-2) income if you actively participate and your MAGI is under $100k (phasing out to $0 by $150k); unused losses carry forward. On sale, claimed depreciation is recaptured at up to 25%, and gains may owe capital-gains tax (a 1031 exchange can defer both). Figures are a year-1 estimate at your 24.0% rate — not tax advice; consult a CPA.
Condition & rehab AI · 12 photos
This home is in good condition with cosmetic updates needed. Painting the exterior and replacing the carpet would significantly increase its value.
Value-add opportunities
- Both Paint exterior — Enhances curb appeal and value
- Both Replace carpet — Freshens up the interior and adds value
Renovation cost estimate screening
Value-add ROI direction
- Both Paint exterior — Enhances curb appeal and value ↑
- Both Replace carpet — Freshens up the interior and adds value ↑
ⓘ Cost ranges are severity-bucket heuristics (US national rule-of-thumb). Get contractor quotes + a written scope before underwriting a rehab budget.
Schools (NCES district)
- District
- Princeton ISD
- NCES district ID
- 4835850
- Math proficiency
- 51% ▼ -8.00%
- Reading proficiency
- 47% ▬ 0.00%
- Median HH income
- $54,827
- Composite
- 42.44/100
- National rank
- #3226
- State rank
- #188 of 826 in TX
Livability — Wylie
- Score
- 69/100
- State rank
- #419
- US rank
- #8623
Category grades
Schools grade is shown separately in the Schools card above.
Census & demographics
- County
- Collin County · 1,159,394 people
- City population
- 69,325
- Metro
- Dallas-Fort Worth-Arlington, TX
- Population (ZIP)
- 34,171
- Household income
- $100,037
- Rent vs Own
- Severe rent burden
- 368.0
Population outlook (Collin County) Hauer SSP2
- Today (2025)
- 1,210,074 people
- By 2030
- 1,358,201 · +12.2%
- By 2040
- 1,654,061 · +36.7%
- By 2050
- 1,937,359 · +60.1%
- By 2075
- 2,567,039 · +112.1%
- By 2100
- 2,952,048 · +144.0%
Race, ethnicity, and origin ACS 2023
- Neighborhood character
- Diverse neighborhood (Simpson 0.66)
- Race & ethnicity
- White 47% Hispanic / Latino 30% Black 17% Two or more races 10% Asian 4% Native American 1%
- Hispanic origin (detail)
- Mexican 26%
- Common ancestry
- Lithuanian 2% Romanian 1% Russian 1%
- Foreign-born
- 15% · Canada, China, Mexico
- Languages at home
- 70% English-only · Spanish 22% Other Indo-European 2% Other Asian/Pacific 1%
Political lean MEDSL · Collin
- 2024 margin
- R (+11.1) · D 43.1% · R 54.3% · Other 2.6%
- 2008→2024 swing
- +14.4pp toward D · 2008: -25.6pp · 2024: -11.1pp
- All cycles
- 2024: R+11.1 2020: R+4.3 2016: R+17.0 2012: R+31.6 2008: R+25.6
Not yet ingested
- Civics
- —
Market trends
- HPI YoY
- ▼ -103.99%
- Current HPI
- 238.9373
- Rent YoY
- ▼ -1.02%
- Metro
- Dallas-Fort Worth-Arlington, TX
- State GDP YoY
- ▲ 3.95%
- F500 in state
- 110
Industry mix (Fortune 500 HQ in TX)
| Industry | F500 HQs | Revenue |
|---|---|---|
| Energy | 16 | $1,198B |
|
||
| Technology | 5 | $198B |
|
||
| Engineering / Construction | 4 | $72B |
|
||
| Energy Services | 3 | $60B |
|
||
| Utilities | 3 | $41B |
|
||
| Healthcare | 2 | $330B |
|
||
Price history
-8.1% since first listed3 events — show timeline
- 2026-05-06 Price Changed $226,990 NTREIS
- 2026-04-10 Price Changed $236,990 NTREIS
- 2026-04-02 Listed $246,990 NTREIS
Cash-flow waterfall
monthlySold comps — $/sqft
last 12 mo · ≤1 miLoading sold comps…