 Multi-family
345 Littlejohn Rd · Yuba City, CA
Flood risk 1/10 · Minimal
- FEMA flood zone
- X (unshaded)
- Chance of flooding over 30 yrs
- 0.0%
- Est. flood insurance / yr
- $507 – $1,088
Fire risk 6/10 · Moderate
- Est. fire insurance / yr
- $659 – $1,223
Heat risk 7/10 · Major
- Hot days now (above 105°F)
- 7 days/yr
- Hot days in 30 yrs
- 16 days/yr
Wind risk 1/10 · Minimal
- Chance of severe wind over 30 yrs
- —
Air-quality risk 10/10 · Severe
- Unhealthy air days now
- 26 days/yr
- Unhealthy air days in 30 yrs
- 30 days/yr
Risk factors via First Street. Map © Google.
Why this score? — see what drove the C- grade
The composite is a weighted blend of 9 inputs, each scored 0–100. Each bar is that input's sub-score; the figure is the points it added to the 100-point composite (weight × sub-score).
- Cash flow +21.5/30.0
- ARV discount +7.5/15.0
- DSCR +6.9/10.0
- 1% rule +5.3/10.0
- Livability +3.8/5.0
- Schools +3.2/10.0
- Rent growth +2.5/5.0
- Condition / age +2.5/5.0
- Appreciation +0.0/10.0
$1,400,000
🖨 Deal sheet (PDF) 📄 Offer letter ✓ Due diligence
Multi-family units
County records classify this as Multi-Family (5+ Unit). Listing-text estimate: 1 unit. estimate disagrees with records
5+ unit building — per-unit beds/baths from public records are typically unavailable; the breakdown below (if shown) is an estimate from the listing text.
Listing remarks
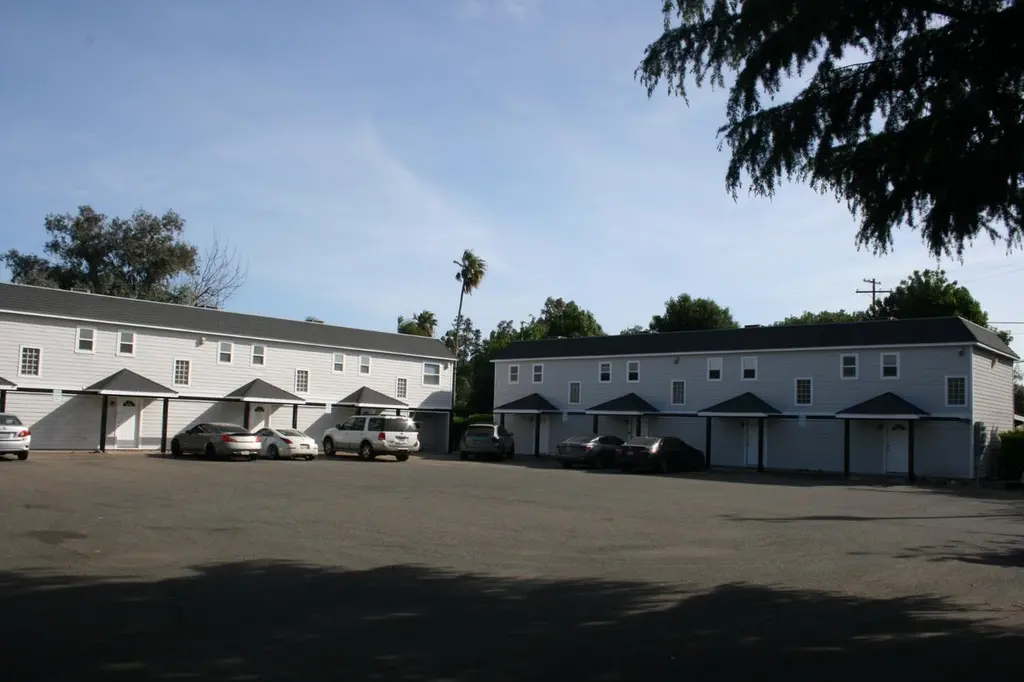
This is an opportunity to own a rare Townhouse style apartment located within a nice residential neighborhood. All 8 units have the living room, kitchen and 1/2 bath downstairs with the bedrooms & full bath upstairs. 7 units have 2 bedrooms plus one unit is a 3 bedroom. This property has been owned by the same person for over 20 years and maintained with a pride of ownership. Good tenants with a location that historicaly is in high demand for prospective tenants.
Key facts
- High demand location
- Living room kitchen
- 0.68 acre lot
Tags
Property features AI
Finance
- Other: Lot approximately 0.68 acres
- Financial info: Multi-unit property with 8 total units
- HOA & community: No association
Exterior
- Parking: Off-street parking; Guest parking available; Total of 20 parking spaces
- Utilities: Cable available; City/public water with meter on site; Public district irrigation; Natural gas connected; Separate electricity and gas meters; 220 volt electric; Septic system (septic connected)
- Home design: Residential income property; 5 or more units (apartments/townhouses); Varies by unit; original condition in places; Two stories; Building named Westgate Villa; Facing direction not specified; Entry level not specified
- Construction: Built in 1970; Shingle/composition/other roof
- Exterior features: Yard space; Private landscaped back; Other yard/lot features
Interior
- Kitchen: Free standing refrigerator; Dishwasher; Disposal; Free standing electric range
- Flooring: Carpet; Tile; Vinyl
- Heating & cooling: Central cooling; Central heating; Natural gas heating
- Interior features: Formal entry; Dual-pane full windows; Balcony/deck and enclosed patio
- Laundry & utility: In common area laundry; Washer/Dryer owned
Neighborhood map
What this means for you Summary
Snapshot
- This is a 32-bed/16.0-bath multifamily listed at $1.40M.
Deal economics
- At list price, monthly cash flow is $2k ($25k/yr) — positive.
- The deal already cash-flows at list — no discount required.
- Meets the 1% rule at list price ($14k rent vs $1.40M).
- Cap rate 8.1% vs local median 3.6% in Yuba City — top-decile yield for the area; either an underpriced asset or a hidden risk that comps aren't pricing in. Stress-test before assuming the spread holds.
Location & tenants
- Location reads 75/100 on livability (#111 in CA, #3,863 nationally) — a middle-class / working-renter tenant base. Strengths: commute A+, housing A+, health & safety A+; Watch: crime D+, schools D, cost of living F.
- Yuba City Unified (urban): math 20% / reading 53% proficiency, ranked #263 of 517 in CA (top 51%) — families likely to look elsewhere, expect single-tenant / working-renter base with shorter leases.
- Market conditions: 176 active listings in the ZIP; solid renter incomes; 73 units permitted in Sutter County in 2024 (0 in 5+ unit buildings).
- At $14,425/mo this rent would consume 185% of the median local household income ($94k/yr) (locally 738% of renters already pay >50% of income on rent) — very limited rent-growth headroom before tenants either downsize or default.
Forward outlook
- Local home prices are declining (-3.0%/yr); year-one equity from $10k of loan paydown is wiped out by about $42k of value loss. Plan a longer hold.
- Sutter County population projected to shrink 4% by 2050 — rents likely to lag national; underwrite the cash flow, not the appreciation.
Negotiation context
- Only 5 days on market — expect competitive offers; lowballing is unlikely to land.
- Current owner paid $995k; 41% above their basis — modest negotiation headroom, anchor on the comps not their cost.
Risks & watch-outs
- Climate carrying-cost: major wildfire risk; extreme-heat days projected 7→16/yr by 2055 (HVAC capex compounding) — expect insurance premiums to compound above CPI over the hold.
Questions for the listing agent
- Built in 1970 — when were the roof, HVAC, electrical panel, plumbing, and water heater last replaced?
- Is there a deadline driving the sale (1031 exchange, divorce, estate, relocation)? That informs how much negotiation room exists.
- Schools are D-rated, which usually means shorter tenancies and higher turnover. Who's the typical renter profile here, and what's been the actual vacancy rate?
- Crime grade is D in this area — have there been break-ins, vandalism, or insurance claims at this property in the last 3 years? What carrier currently insures it and at what premium?
- What's the average days-on-market for RENTAL listings here right now (not sales)? A rising rental-DOM trend means longer vacancies and softer asking-rent achievability than the comps imply.
- What's the recent tenant-quality profile in this submarket — average credit score on applications, eviction rate, late-payment / NSF rate, and stable-employment percentage? A property-management company in the area should have these aggregated.
- How much new apartment / multifamily construction is in the pipeline within 1–3 miles? Heavy new supply (>2% of stock underway) typically softens rents 12–24 months out; light construction supports rent growth.
Investment metrics
- 1% rule
- 1.03% ✓
- Cap rate
- 8.10%
- Cash-on-cash
- 6.46%
- DSCR
- 1.29
- GRM
- 8.1
CMA / ARV
No comps found within radius.
Projected returns pro-forma
-3.0% appreciation · 3.0% rent growth · sell at horizon
- IRR
- -6.4%
- Equity multiple
- 0.76×
- Total profit
- $-92,419
- Equity at exit
- $208,745
- IRR
- 3.3%
- Equity multiple
- 1.24×
- Total profit
- $92,575
- Equity at exit
- $121,046
Cash invested: $392,000 (down + closing). Projections, not guarantees.
Landlord ↔ Tenant lean methodology
- Overall (STATE)
- 18 Strongly Tenant-Friendly
- State California
- 18 Strongly Tenant-Friendly · D+13
- County
- — inherits STATE
- City
- — inherits STATE
ZIP-level market 95993
- Active inventory
- 176
- Price-to-rent
- 75.2×
Monthly cashflow live
- Estimated rent
- $14,425 high interval (Pro) →
- Mortgage (P&I)
- −$7,342
- Tax from tax record
- −$1,359 /mo · $16,314/yr
- Insurance
- −$583
- HOA
- −$0
- Vacancy / Maint / Mgmt
- −$3,029
- Net cashflow
- $2,111
Break-even live
Sensitivity live
| Price | -10% $2,904 | -5% $2,507 | +0% $2,111 | +5% $1,715 | +10% $1,319 |
|---|---|---|---|---|---|
| Rent | -10% $972 | -5% $1,541 | +0% $2,111 | +5% $2,681 | +10% $3,251 |
| Rate | -1.0pp $2,816 | -0.5pp $2,467 | base $2,111 | +0.5pp $1,748 | +1.0pp $1,379 |
9-unit breakdown (identical units grouped — click to expand)
| Units | Beds | Baths | Est. rent |
|---|---|---|---|
| 7× units | 1 | 0.5 | $10,857 |
| #1 | 1 | 0.5 | $1,551 |
| #2 | 1 | 0.5 | $1,551 |
| #3 | 1 | 0.5 | $1,551 |
| #4 | 1 | 0.5 | $1,551 |
| #5 | 1 | 0.5 | $1,551 |
| #6 | 1 | 0.5 | $1,551 |
| #7 | 1 | 0.5 | $1,551 |
| 1× unit | 2 | 1 | $1,703 |
| 1× unit | 3 | 1 | $1,863 |
| Total (9 units) | $14,425 | ||
UW: 25.0% down · 7.5% · 30yr · 1.5% tax · 5.0% vac · 8.0% maint · 8.0% mgmt
Financing live
Cash to close
- Down payment
- $350,000
- Closing costs
- $42,000
- Reserves months
- —
- Total cash needed
- —
Loan-product check · same deal, 3 products live
Conventional
25% down · 7.5% · 30yr
- Down + closing
- —
- Monthly P&I
- —
- Monthly cashflow
- —
- DSCR
- —
- Eligible?
- —
Personal DTI + credit; lowest rate.
DSCR
20% down · 8.5% · 30yr
- Down + closing
- —
- Monthly P&I
- —
- Monthly cashflow
- —
- DSCR
- —
- Eligible?
- —
No personal income docs; deal must DSCR.
Hard money
10% down · 12.0% · 12mo
- Down + closing
- —
- Monthly P&I
- —
- Monthly cashflow
- —
- DSCR
- —
- Eligible?
- —
Short-term bridge; refi at stabilization.
Listing history 2 events
-
2005-02-16soldstatus $995,000
-
1992-04-07soldstatus $100,000
ⓘ Source: listings_history table (triggers on properties + properties_extension) + one-shot
backfill from property_details.listing_events for pre-trigger history.
Tax reassessment forecast CA · Resets to sale price
- Current annual tax
- $16,314 · $1,359/mo
- Projected year-2 tax
- $16,314 · $1,359/mo
- Expected delta
- $0/yr ($0/mo · 0.0%)
ⓘ Screening estimate from a state-policy table — verify with the county assessor before closing.
Climate risk First Street
- Flood 1/10 Low FEMA zone X (unshaded) · 0% chance over 30 yrs
- Wildfire 6/10 Major
- Heat 7/10 Severe 7 d/yr ≥105°F today · 16 d/yr by 30 yrs out
- Wind 1/10 Low
- Air quality 10/10 Extreme 26 unhealthy d/yr today · 30 by 30 yrs out
Nearby sold comps map
Loading sold comps map…
Walkable amenities ~0.75 mi
Loading nearby amenities…
Taxation est. · year 1
- Rental income
- $173,100
- − Mortgage interest
- −$78,422
- − Property taxes
- −$16,314
- − Insurance
- −$7,000
- − Repairs & maintenance
- −$13,848
- − Management
- −$13,848
- − Depreciation
- −$40,727
- Taxable income
- $2,941
- Est. tax owed @ 24.0%
- −$706
- After-tax cash flow
- $24,628/yr
For passive investors: Depreciation is non-cash, so a rental often shows a tax loss while cash-flowing — sheltering income. Rental losses are passive: they offset passive income freely, and up to $25,000/yr can offset ordinary (W-2) income if you actively participate and your MAGI is under $100k (phasing out to $0 by $150k); unused losses carry forward. On sale, claimed depreciation is recaptured at up to 25%, and gains may owe capital-gains tax (a 1031 exchange can defer both). Figures are a year-1 estimate at your 24.0% rate — not tax advice; consult a CPA.
Schools (NCES district)
- District
- Yuba City Unified
- NCES district ID
- 0643470
- Math proficiency
- 20% ▼ -10.00%
- Reading proficiency
- 53% ▲ 5.00%
- Median HH income
- $50,923
- Composite
- 31.55/100
- National rank
- #5956
- State rank
- #263 of 517 in CA
Livability — Yuba City
- Score
- 75/100
- State rank
- #111
- US rank
- #3863
Category grades
Schools grade is shown separately in the Schools card above.
Census & demographics
- Census place
- Yuba City, CA
- County
- Sutter County · 81,625 people
- City population
- 81,625
- Metro
- Yuba City, CA
- Population (ZIP)
- 39,046
- Household income
- $93,763
- Rent vs Own
- Severe rent burden
- 738.0
Population outlook (Sutter County) Hauer SSP2
- Today (2025)
- 97,244 people
- By 2030
- 97,170 · -0.1%
- By 2040
- 96,137 · -1.1%
- By 2050
- 93,604 · -3.7%
- By 2075
- 85,008 · -12.6%
- By 2100
- 71,584 · -26.4%
Race, ethnicity, and origin ACS 2023
- Neighborhood character
- Diverse neighborhood (Simpson 0.68)
- Race & ethnicity
- White 45% Asian 25% Hispanic / Latino 23% Two or more races 12% Black 1%
- Hispanic origin (detail)
- Mexican 21%
- Common ancestry
- Slovak 2% Italian 1% Russian 1%
- Foreign-born
- 23% · Canada, Vietnam
- Languages at home
- 65% English-only · Other Indo-European 20% Spanish 12% Other Asian/Pacific 1%
Political lean MEDSL · Sutter
- 2024 margin
- Solid R (+31.4) · D 33.1% · R 64.5% · Other 2.4%
- 2008→2024 swing
- -14.7pp toward R · 2008: -16.7pp · 2024: -31.4pp
- All cycles
- 2024: R+31.4 2020: R+16.4 2016: R+16.3 2012: R+21.8 2008: R+16.7
Not yet ingested
- Civics
- —
Market trends
- HPI YoY
- ▼ -280.05%
- Current HPI
- 210.9131
- Rent YoY
- —
- Metro
- Yuba City, CA
- State GDP YoY
- ▲ 3.21%
- F500 in state
- 116
Industry mix (Fortune 500 HQ in CA)
| Industry | F500 HQs | Revenue |
|---|---|---|
| Technology | 27 | $1,492B |
|
||
| Financial Services | 3 | $174B |
|
||
| Retail | 3 | $44B |
|
||
| Insurance | 3 | $26B |
|
||
| Media / Entertainment | 2 | $115B |
|
||
| Pharmaceuticals / Biotech | 2 | $62B |
|
||
Price history
+895.0% since first listed2 events — show timeline
- 2005-02-16 Sold (Public Records) $995,000 Public Records
- 1992-04-07 Sold (Public Records) $100,000 Public Records
Property tax history
+8.3%/yrLatest (2025): $16,314 · +1.6% YoY. Source: county tax records.
Cash-flow waterfall
monthlySold comps — $/sqft
last 12 mo · ≤1 miLoading sold comps…