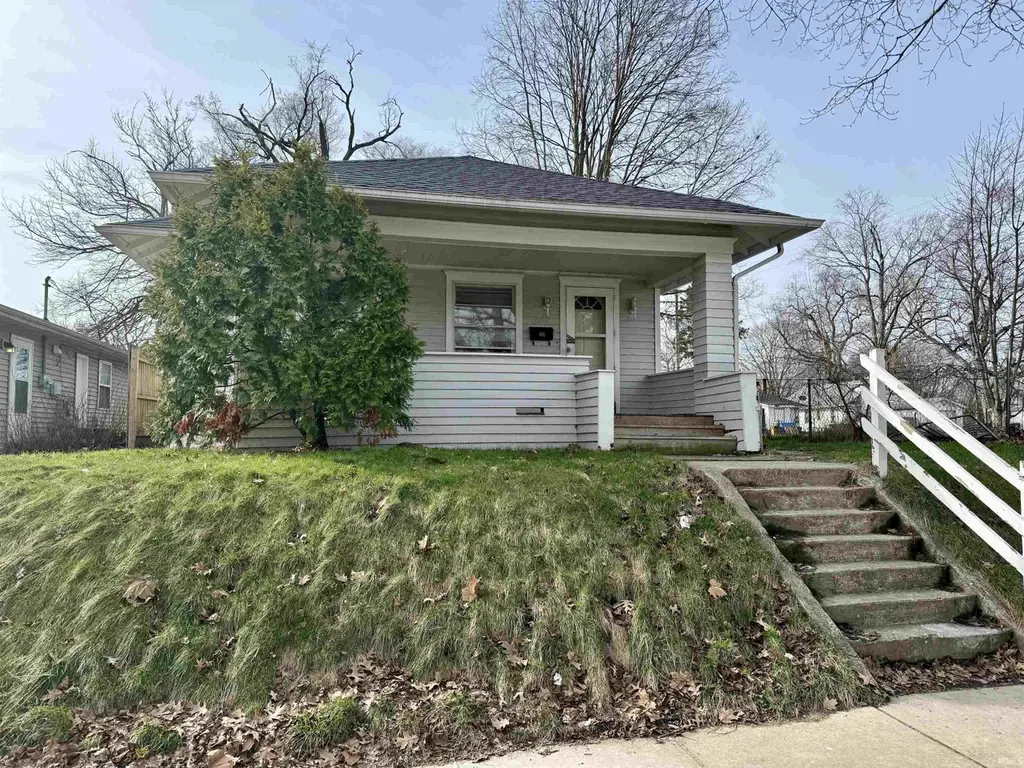
804 E Calvert St · South Bend, IN
Flood risk 1/10 · Minimal
- FEMA flood zone
- X (unshaded)
- Chance of flooding over 30 yrs
- 0.0%
- Est. flood insurance / yr
- $473 – $860
Fire risk 1/10 · Minimal
- Est. fire insurance / yr
- $717 – $1,331
Heat risk 2/10 · Minimal
- Hot days now (above 99°F)
- 7 days/yr
- Hot days in 30 yrs
- 16 days/yr
Wind risk 2/10 · Minimal
- Chance of severe wind over 30 yrs
- —
Air-quality risk 3/10 · Minor
- Unhealthy air days now
- 2 days/yr
- Unhealthy air days in 30 yrs
- 3 days/yr
Risk factors via First Street. Map © Google.
Why this score? — see what drove the B+ grade
The composite is a weighted blend of 9 inputs, each scored 0–100. Each bar is that input's sub-score; the figure is the points it added to the 100-point composite (weight × sub-score).
- Cash flow +30.0/30.0
- ARV discount +15.0/15.0
- DSCR +10.0/10.0
- 1% rule +9.9/10.0
- Rent growth +3.5/5.0
- Livability +3.2/5.0
- Condition / age +2.5/5.0
- Schools +1.4/10.0
- Appreciation +0.0/10.0
$85,000
🖨 Deal sheet 📄 Offer letter ✓ Due diligence
Listing remarks MLS
Motivated seller. Bring us an offer! Welcome to this cute, move-in ready house tucked away on a corner lot. Some recent updates include a new roof, stove, refrigerator and fenceThis house is located next to the Studebaker golf course and conveniently located near schools, restaurants and shopping. Call today to see how this home can work for you.
Key facts
- Near schools
- Near shopping
- Near parks
Tags
Property features AI
Exterior
- Utilities: Public water; Public sewer
- Home design: Single-family residence; Site-built home; One-story
- Construction: Wood siding exterior; Slab foundation
- Exterior features: Corner lot; Lot dimensions approximately 39 x 128
Interior
- Bathrooms: 1 full bathroom (main level)
- Heating & cooling: Central air conditioning; Natural gas forced air heating
- Interior features: Full unfinished basement; 6 total rooms
- Laundry & utility: Laundry on lower level
Neighborhood map
What this means for you Summary
Snapshot
- This is a 3-bed/1.0-bath single-family listed at $85k.
Deal economics
- At list price, monthly cash flow is $470 ($6k/yr) — positive.
- The deal already cash-flows at list — no discount required.
- Meets the 1% rule at list price ($1k rent vs $85k).
- Recommended offer: $84k (1.5% below list) — sets the bar for market timing.
- Cap rate 12.9% vs local median 4.4% in South Bend — top-decile yield for the area; either an underpriced asset or a hidden risk that comps aren't pricing in. Stress-test before assuming the spread holds.
Location & tenants
- Location reads 64/100 on livability (#365 in IN) — a middle-class / working-renter tenant base. Strengths: cost of living A+, housing A+, health & safety A+; Watch: amenities D, employment D, crime F.
- South Bend Community School Corporation (urban): math 12% / reading 21% proficiency, ranked #284 of 301 in IN (top 94%) — low school quality limits family demand, transient renter base, plan for 1-2y turnover; 66% free/reduced lunch — lower-income household profile, screen leases tightly.
- Zoned schools: Lincoln Elementary School (math 7% / reading 6%, grade F, #964 of 994 statewide, top 97%, 467 students, 86% FRL); Riley High School (math 19% / reading 46%, grade F, #293 of 369 statewide, top 80%, 992 students, 67% FRL).
- Market conditions: Rents rising fast (+4.1%/yr); 77 active listings in the ZIP; 14 comparable units currently listed for rent nearby; rentals at typical pace (median 21d on market — plan ~3-4 weeks tenant-placement turnaround); 43% of comp listings sitting > 30 days — soft ceiling on asking rent; lower-income renter base — watch delinquency; 754 units permitted in St. Joseph County in 2024 (460 in 5+ unit buildings).
- This rent runs 36% of the median local income ($43k/yr) — at the standard rent-burdened threshold; future hikes will face affordability resistance.
Forward outlook
- Local home prices are declining (-3.0%/yr); year-one equity from $588 of loan paydown is wiped out by about $3k of value loss. Plan a longer hold.
- At projected returns (-3.0% appreciation + 4.1% rent growth), your $24k cash investment doubles in ~5 years — after that, you're playing with house money.
Negotiation context
- It's been on market 30 days — a 2% lower offer ($84k) is reasonable based on typical stale-listing flexibility.
- 3 sale attempts since 4y ago; this cycle's ask has dropped $10k (11%) from the opening price — seller is motivated, your offer sets the floor, not the list.
- Current owner paid $65k; 31% above their basis — modest negotiation headroom, anchor on the comps not their cost.
Risks & watch-outs
- Watch-outs: built in 1922 — expect roof / HVAC / electrical / plumbing capex.
Questions for the listing agent
- Built in 1922 — when were the roof, HVAC, electrical panel, plumbing, and water heater last replaced?
- Is there a deadline driving the sale (1031 exchange, divorce, estate, relocation)? That informs how much negotiation room exists.
- Schools are F-rated, which usually means shorter tenancies and higher turnover. Who's the typical renter profile here, and what's been the actual vacancy rate?
- Crime grade is F in this area — have there been break-ins, vandalism, or insurance claims at this property in the last 3 years? What carrier currently insures it and at what premium?
- What's the average days-on-market for RENTAL listings here right now (not sales)? A rising rental-DOM trend means longer vacancies and softer asking-rent achievability than the comps imply.
- What's the recent tenant-quality profile in this submarket — average credit score on applications, eviction rate, late-payment / NSF rate, and stable-employment percentage? A property-management company in the area should have these aggregated.
- How much new for-sale + rental construction is in the pipeline within 1–3 miles? Heavy new supply typically softens prices + rents 12–24 months out; constrained supply supports both.
Investment metrics
- 1% rule
- 1.49% ✓
- Cap rate
- 12.92%
- Cash-on-cash
- 23.67%
- DSCR
- 2.05
- GRM
- 5.6
CMA / ARV
- ARV (on-the-fly)
- $107,502
- Comps found
- 12
Show comp detail 12 sales within ~0.75 mi
| Address | Dist | Beds/Ba | Sqft | Sold | Price | $/sf | Match |
|---|---|---|---|---|---|---|---|
| 804 E Calvert St | 0.00mi | 2/1.0 (-1) | 779 (0%) | 1mo | $72,000 | $92 | 94 |
| 1144 E Dayton St | 0.32mi | 3/1.0 | 864 (+11%) | 1mo | $67,000 | $78 | 66 |
| 821 E Irvington Ave | 0.48mi | 2/1.0 (-1) | 752 (-4%) | 3mo | $109,500 | $146 | 65 |
| 312 E Donald St | 0.37mi | 2/1.0 (-1) | 748 (-4%) | 8mo | $25,000 | $33 | 64 |
| 1405 E Donald St | 0.59mi | 2/1.0 (-1) | 756 (-3%) | 2mo | $55,000 | $73 | 61 |
| 1140 E Dayton St | 0.31mi | 2/1.0 (-1) | 864 (+11%) | 7mo | $119,000 | $138 | 56 |
| 1110 Roberts St | 0.74mi | 2/1.0 (-1) | 752 (-4%) | 3mo | $146,000 | $194 | 52 |
| 128 Milton St | 0.49mi | 2/1.0 (-1) | 832 (+7%) | 11mo | $138,000 | $166 | 52 |
| 817 E Eckman St | 0.53mi | 2/1.0 (-1) | 880 (+13%) | 2mo | $130,000 | $148 | 47 |
| 1516 E Fox St | 0.74mi | 2/1.0 (-1) | 720 (-8%) | 2mo | $110,000 | $153 | 46 |
| 1340 E Calvert St | 0.55mi | 2/1.0 (-1) | 888 (+14%) | 3mo | $65,500 | $74 | 44 |
| 1714 S Twyckenham Dr | 0.73mi | 2/1.0 (-1) | 870 (+12%) | 1mo | $91,000 | $105 | 41 |
Match score weights: distance 35% · size 25% · config 20% · recency 20%. Top-matched comps best support the ARV.
Projected returns pro-forma
-3.0% appreciation · 4.08% rent growth · sell at horizon
- IRR
- 17.9%
- Equity multiple
- 1.74×
- Total profit
- $17,504
- Equity at exit
- $12,674
- IRR
- 27.1%
- Equity multiple
- 3.50×
- Total profit
- $59,513
- Equity at exit
- $7,349
Cash invested: $23,800 (down + closing). Projections, not guarantees.
Landlord ↔ Tenant lean methodology
- Overall (STATE)
- 90 Strongly Landlord-Friendly
- State Indiana
- 90 Strongly Landlord-Friendly · R+11
- County
- — inherits STATE
- City
- — inherits STATE
ZIP-level market 46613
- Home prices YoY
- -7.2%
- Rents YoY
- 4.1%
- Active inventory
- 77
- Price-to-rent
- 5.6×
Monthly cashflow live
- Estimated rent
- $1,265 high interval (Pro) →
- Mortgage (P&I)
- −$446
- Tax from tax record
- −$49 /mo · $588/yr
- Insurance
- −$35
- HOA
- −$0
- Vacancy / Maint / Mgmt
- −$266
- Net cashflow
- $470
Break-even live
UW: 25.0% down · 7.5% · 30yr · 1.5% tax · 5.0% vac · 8.0% maint · 8.0% mgmt
Financing live
Cash to close
- Down payment
- $21,250
- Closing costs
- $2,550
- Reserves months
- —
- Total cash needed
- —
Loan-product check · same deal, 3 products live
Conventional
25% down · 7.5% · 30yr
- Down + closing
- —
- Monthly P&I
- —
- Monthly cashflow
- —
- DSCR
- —
- Eligible?
- —
Personal DTI + credit; lowest rate.
DSCR
20% down · 8.5% · 30yr
- Down + closing
- —
- Monthly P&I
- —
- Monthly cashflow
- —
- DSCR
- —
- Eligible?
- —
No personal income docs; deal must DSCR.
Hard money
10% down · 12.0% · 12mo
- Down + closing
- —
- Monthly P&I
- —
- Monthly cashflow
- —
- DSCR
- —
- Eligible?
- —
Short-term bridge; refi at stabilization.
Rent comps 14 comps
| Address | Beds | Baths | Sqft | Rent | $/sqft | DOM | Units | Dist |
|---|---|---|---|---|---|---|---|---|
| 2114 High St South Bend, IN | 3.0 | 1.0 | 949 | $1,300 | $1.37 | 43d | 1 | 0.12mi |
| 1213 E Donald St South Bend, IN | 2.0 | 1.0 | 648 | $1,050 | $1.62 | 20d | 1 | 0.40mi |
| 202 E Calvert St South Bend, IN | 2.0 | 1.0 | 1000 | $999 | $1.00 | 20d | 1 | 0.45mi |
| 237 E Victoria St South Bend, IN | 3.0 | 1.0 | 840 | $995 | $1.18 | 43d | 1 | 0.51mi |
| 214 Altgeld St South Bend, IN | 2.0 | 1.0 | 950 | $1,200 | $1.26 | 20d | 1 | 0.52mi |
| 1701 E Donald St South Bend, IN | 2.0 | 1.0 | 720 | $1,075 | $1.49 | 43d | 1 | 0.88mi |
| 922 Ridgedale Rd South Bend, IN | 2.0 | 1.0 | 864 | $1,200 | $1.39 | 13d | 1 | 0.93mi |
| 1729 E Calvert St South Bend, IN | 3.0 | 1.0 | 900 | $1,300 | $1.44 | 43d | 1 | 0.93mi |
| 1920 S Scott St South Bend, IN | 2.0 | 1.0 | 816 | $1,000 | $1.23 | 13d | 1 | 1.01mi |
| 2102 S Scott St South Bend, IN | 3.0 | 1.0 | 768 | $1,250 | $1.63 | 43d | 1 | 1.01mi |
| 2804 Delaware St Mishawaka, IN | 2.0 | 1.0 | 720 | $1,200 | $1.67 | 13d | 1 | 1.25mi |
| 1106 S 20th St South Bend, IN | 1.0–3.0 | 1.0–2.0 | 885 | $1,200 | $1.36 | 13d | 1 | 1.29mi |
| 4005 Addison St South Bend, IN | 3.0 | 1.0 | 900 | $1,250 | $1.39 | 43d | 1 | 1.44mi |
| 1009 E Jefferson Blvd South Bend, IN | 2.0 | 1.0 | 770 | $1,049 | $1.36 | 20d | 1 | 1.49mi |
Listing history 10 events
-
2026-04-30status Pending
-
2026-04-23price $85,000
-
2026-03-16$95,000 Active
-
2022-10-04soldstatus $65,000 Closed 348-char remark
Show marketing remark (348 chars)
Motivated seller. Bring us an offer! Welcome to this cute, move-in ready house tucked away on a corner lot. Some recent updates include a new roof, stove, refrigerator and fenceThis house is located next to the Studebaker golf course and conveniently located near schools, restaurants and shopping. Call today to see how this home can work for you.
-
2022-09-15status Pending 348-char remark
Show marketing remark (348 chars)
Motivated seller. Bring us an offer! Welcome to this cute, move-in ready house tucked away on a corner lot. Some recent updates include a new roof, stove, refrigerator and fenceThis house is located next to the Studebaker golf course and conveniently located near schools, restaurants and shopping. Call today to see how this home can work for you.
-
2022-09-11historical Active Under Contract 348-char remark
Show marketing remark (348 chars)
Motivated seller. Bring us an offer! Welcome to this cute, move-in ready house tucked away on a corner lot. Some recent updates include a new roof, stove, refrigerator and fenceThis house is located next to the Studebaker golf course and conveniently located near schools, restaurants and shopping. Call today to see how this home can work for you.
-
2022-08-10status Active 348-char remark
Show marketing remark (348 chars)
Motivated seller. Bring us an offer! Welcome to this cute, move-in ready house tucked away on a corner lot. Some recent updates include a new roof, stove, refrigerator and fenceThis house is located next to the Studebaker golf course and conveniently located near schools, restaurants and shopping. Call today to see how this home can work for you.
-
2022-08-01historical Active Under Contract 348-char remark
Show marketing remark (348 chars)
Motivated seller. Bring us an offer! Welcome to this cute, move-in ready house tucked away on a corner lot. Some recent updates include a new roof, stove, refrigerator and fenceThis house is located next to the Studebaker golf course and conveniently located near schools, restaurants and shopping. Call today to see how this home can work for you.
-
2022-07-25price $79,900 348-char remark
Show marketing remark (348 chars)
Motivated seller. Bring us an offer! Welcome to this cute, move-in ready house tucked away on a corner lot. Some recent updates include a new roof, stove, refrigerator and fenceThis house is located next to the Studebaker golf course and conveniently located near schools, restaurants and shopping. Call today to see how this home can work for you.
-
2022-06-29$85,000 Active 348-char remark
Show marketing remark (348 chars)
Motivated seller. Bring us an offer! Welcome to this cute, move-in ready house tucked away on a corner lot. Some recent updates include a new roof, stove, refrigerator and fenceThis house is located next to the Studebaker golf course and conveniently located near schools, restaurants and shopping. Call today to see how this home can work for you.
ⓘ Source: listings_history table (triggers on properties + properties_extension) + one-shot
backfill from property_details.listing_events for pre-trigger history.
Tax reassessment forecast IN · Partial reset (capped growth)
- Current annual tax
- $588 · $49/mo
- Projected year-2 tax
- $655 · $55/mo
- Expected delta
- +$67/yr (+$6/mo · 11.4%)
ⓘ Screening estimate from a state-policy table — verify with the county assessor before closing.
Climate risk First Street
- Flood 1/10 Low FEMA zone X (unshaded) · 0% chance over 30 yrs
- Wildfire 1/10 Low
- Heat 2/10 Low 7 d/yr ≥99°F today · 16 d/yr by 30 yrs out
- Wind 2/10 Low
- Air quality 3/10 Moderate 2 unhealthy d/yr today · 3 by 30 yrs out
Nearby sold comps map
Loading sold comps map…
Walkable amenities ~0.75 mi
Loading nearby amenities…
Taxation est. · year 1
- Rental income
- $15,186
- − Mortgage interest
- −$4,761
- − Property taxes
- −$588
- − Insurance
- −$425
- − Repairs & maintenance
- −$1,215
- − Management
- −$1,215
- − Depreciation
- −$2,473
- Taxable income
- $4,508
- Est. tax owed @ 24.0%
- −$1,082
- After-tax cash flow
- $4,552/yr
For passive investors: Depreciation is non-cash, so a rental often shows a tax loss while cash-flowing — sheltering income. Rental losses are passive: they offset passive income freely, and up to $25,000/yr can offset ordinary (W-2) income if you actively participate and your MAGI is under $100k (phasing out to $0 by $150k); unused losses carry forward. On sale, claimed depreciation is recaptured at up to 25%, and gains may owe capital-gains tax (a 1031 exchange can defer both). Figures are a year-1 estimate at your 24.0% rate — not tax advice; consult a CPA.
Schools (NCES district)
- District
- South Bend Community School Corporation
- NCES district ID
- 1810290
- Math proficiency
- 12% ▼ -10.00%
- Reading proficiency
- 21% ▼ -6.00%
- Median HH income
- $41,935
- Composite
- 14.21/100
- National rank
- #9452
- State rank
- #284 of 301 in IN
Livability — South Bend
- Score
- 64/100
- State rank
- #365
- US rank
- #13730
Category grades
Schools grade is shown separately in the Schools card above.
Census & demographics
- Census place
- South Bend, IN
- County
- Saint Joseph County · 189,048 people
- City population
- 99,767
- Metro
- South Bend-Mishawaka, IN-MI
- Population (ZIP)
- 12,279
- Household income
- $42,537
- Rent vs Own
- Severe rent burden
- 545.0
Population outlook (St. Joseph County) Hauer SSP2
- Today (2025)
- 273,186 people
- By 2030
- 273,594 · +0.1%
- By 2040
- 271,641 · -0.6%
- By 2050
- 269,187 · -1.5%
- By 2075
- 263,136 · -3.7%
- By 2100
- 245,659 · -10.1%
Race, ethnicity, and origin ACS 2023
- Neighborhood character
- Highly diverse neighborhood (Simpson 0.72)
- Race & ethnicity
- White 41% Hispanic / Latino 24% Black 23% Two or more races 22% Asian 2% Native American 1%
- Hispanic origin (detail)
- Mexican 22%
- Common ancestry
- Romanian 4% Italian 1% Slovak 1%
- Foreign-born
- 9% · Canada, Philippines
- Languages at home
- 81% English-only · Spanish 17% Other Asian/Pacific 1%
Political lean MEDSL · St. Joseph
- 2024 margin
- Toss-up / Even · D 50.0% · R 48.5% · Other 1.5%
- 2008→2024 swing
- -15.6pp toward R · 2008: 17.1pp · 2024: 1.5pp
- All cycles
- 2024: D+1.5 2020: D+5.8 2016: D+0.2 2012: D+3.5 2008: D+17.1
Not yet ingested
- Civics
- —
Market trends
- HPI YoY
- ▼ -20.88%
- Current HPI
- 270.0303
- Rent YoY
- ▲ 4.08%
- Metro
- South Bend-Mishawaka, IN-MI
- State GDP YoY
- ▲ 2.90%
- F500 in state
- 18
Industry mix (Fortune 500 HQ in IN)
| Industry | F500 HQs | Revenue |
|---|---|---|
| Industrial Machinery | 2 | $37B |
|
||
| Healthcare | 1 | $177B |
|
||
| Pharmaceuticals | 1 | $45B |
|
||
| Metals / Steel | 1 | $18B |
|
||
| Agriculture | 1 | $17B |
|
||
| Packaging | 1 | $12B |
|
||
Price history
+0.0% since first listed10 events — show timeline
- 2026-04-30 Pending — IRMLS
- 2026-04-23 Price Changed $85,000 IRMLS
- 2026-03-16 Listed $95,000 IRMLS
- 2022-10-04 Sold (MLS) $65,000 IRMLS
- 2022-09-15 Pending — IRMLS
- 2022-09-11 Contingent — IRMLS
- 2022-08-10 Relisted — IRMLS
- 2022-08-01 Contingent — IRMLS
- 2022-07-25 Price Changed $79,900 IRMLS
- 2022-06-29 Listed $85,000 IRMLS
Property tax history
-12.8%/yrLatest (2023): $588 · +117.5% YoY. Source: county tax records.
Cash-flow waterfall
monthlySold comps — $/sqft
last 12 mo · ≤1 miLoading sold comps…