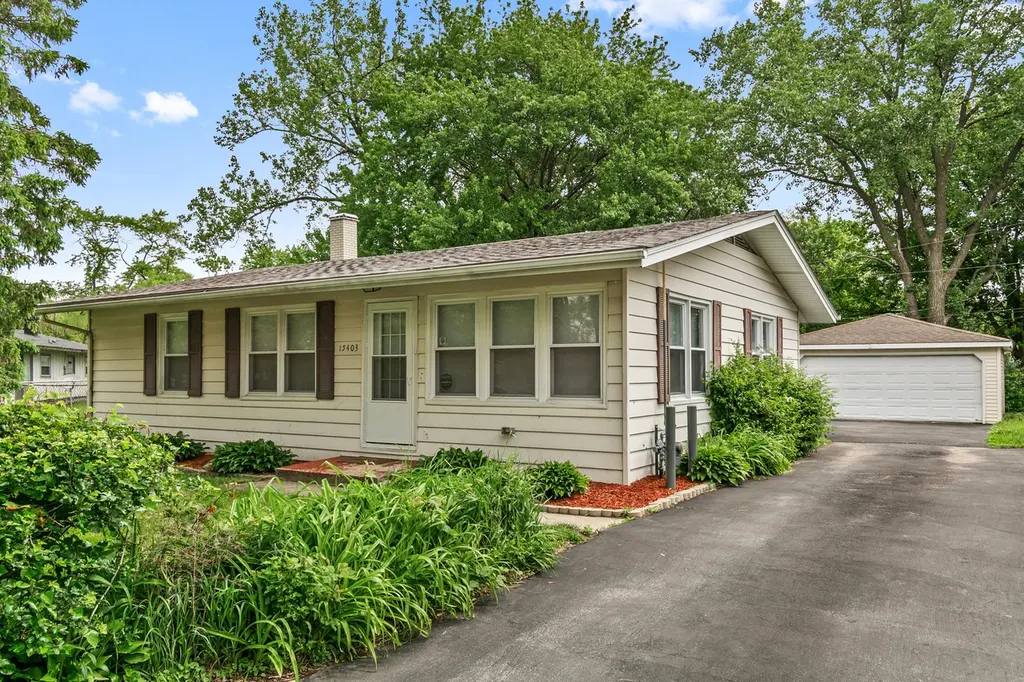
15403 Cherry Ln · Markham, IL
Flood risk 3/10 · Minor
- FEMA flood zone
- X (unshaded)
- Chance of flooding over 30 yrs
- 0.2%
- Est. flood insurance / yr
- $473 – $860
Fire risk 1/10 · Minimal
- Est. fire insurance / yr
- $804 – $1,492
Heat risk 3/10 · Minor
- Hot days now (above 102°F)
- 7 days/yr
- Hot days in 30 yrs
- 15 days/yr
Wind risk 2/10 · Minimal
- Chance of severe wind over 30 yrs
- —
Air-quality risk 3/10 · Minor
- Unhealthy air days now
- 4 days/yr
- Unhealthy air days in 30 yrs
- 4 days/yr
Risk factors via First Street. Map © Google.
Why this score? — see what drove the F grade
The composite is a weighted blend of 9 inputs, each scored 0–100. Each bar is that input's sub-score; the figure is the points it added to the 100-point composite (weight × sub-score).
- Appreciation +10.0/10.0
- Cash flow +5.1/30.0
- Livability +3.8/5.0
- Rent growth +2.5/5.0
- Condition / age +2.5/5.0
- 1% rule +2.3/10.0
- Schools +1.5/10.0
- ARV discount +1.1/15.0
- DSCR +0.0/10.0
$199,700
🖨 Deal sheet (PDF) 📄 Offer letter ✓ Due diligence
Listing remarks MLS
4 Bedroom Step Ranch with Two Car Garage - Great income property or make your own with a few cosmetic touches. Month to month tenant; Investors Welcome!, First Time Home Buyers Welcome!, Whether you're seeking rental property or a second home! Schedule your appointment today!
Key facts
- Hardwood floors
- Vinyl plank flooring
- 8,058 sq ft lot
Tags
Property features AI
Finance
- Other: Property information sourced from landlord/tenant/seller records
- HOA & community: No master association fee required
Exterior
- Parking: Two garage spaces (detached garage); Total of four parking spaces; Asphalt driveway and side driveway; Garage door opener, garage owned
- Utilities: Lake Michigan water source; Public sewer; Electric with circuit breakers
- Home design: Detached single-family home; One story; Fee simple ownership
- Construction: Frame construction; Asphalt roof; Concrete perimeter foundation; Built approximately 61–70 years ago; Built before 1978
- Exterior features: Street paved with curbs, sidewalks and street lights; School bus service, commuter bus and commuter train access, nearby interstate access; Lot is less than 0.25 acre
Interior
- Kitchen: Eating area/table space; Range; Microwave; Refrigerator
- Bedrooms: Four bedrooms (all on the main level); Master bedroom on the main level, approximately 12 x 12; Bedroom two on the main level, approximately 10 x 12; Bedroom three on the main level, approximately 11 x 12; Bedroom four on the main level, approximately 9 x 10
- Bathrooms: One full bathroom
- Heating & cooling: Natural gas forced air heating; Central air conditioning
- Interior features: Seven total rooms; Insulated windows; Kitchen/dining combo
- Laundry & utility: In-unit laundry located in the kitchen; Washer; Dryer
Neighborhood map
What this means for you Summary
Snapshot
- This is a 3-bed/1.0-bath single-family listed at $200k.
Deal economics
- At list price, monthly cash flow is $-461 ($-6k/yr) — negative.
- To cash-flow at today's rent, offer at most $118k (40.8% below list).
- To meet the 1% rule (rent ≥ 1% of price), the offer needs to be $147k (26.5% below list).
- Recommended offer: $118k (40.8% below list) — sets the bar for cash-flow.
- Cap rate 3.5% vs local median 10.2% in Markham — below-typical yield; the buyer is paying a premium for something (appreciation thesis, condition, location) that the cap rate doesn't capture.
Location & tenants
- Location reads 76/100 on livability (#186 in IL, #3,539 nationally) — a middle-class / working-renter tenant base. Strengths: commute A+, cost of living A+, housing A+; Watch: crime D, amenities D, employment D.
- Bremen Chsd 228 (suburban): math 15% / reading 17% proficiency, ranked #468 of 620 in IL (top 76%) — low school quality limits family demand, transient renter base, plan for 1-2y turnover.
- Zoned schools: Bremen High School (math 8% / reading 11%, grade F, #577 of 693 statewide, top 84%, 1,497 students, 0% FRL).
- Market conditions: 65 active listings in the ZIP; 3 comparable units currently listed for rent nearby; rentals leasing fast (median 7d on market — plan ~1-2 weeks tenant-placement turnaround); 6,272 units permitted in Cook County in 2024 (4,658 in 5+ unit buildings).
Forward outlook
- In year one you build about $21k of equity ($1k loan paydown + $20k appreciation (10.0% local appreciation)).
- By year 2, paydown + projected appreciation supports a ~$34k cash-out refi (75% LTV) — recoverable capital for the next deal without selling this one.
Negotiation context
- It's been on market 28 days — a 2% lower offer ($197k) is reasonable based on typical stale-listing flexibility.
- 3 sale attempts since 18y ago with the ask held roughly flat each time — persistent listings suggest the price (not the market) is what's stuck; bring a comps-based counter.
- Current owner paid $98k; list at $200k implies a 104% gain — meaningful room to come down on a strong offer.
Risks & watch-outs
- Watch-outs: property tax is 2.9% of price.
Questions for the listing agent
- What do current leases actually rent for vs. the listed asking? Can we see a recent rent roll and the last 12 months of T-12 income?
- Built in 1965 — when were the roof, HVAC, electrical panel, plumbing, and water heater last replaced?
- Property tax is high relative to price — has the assessment been appealed recently, and will the sale trigger a re-assessment?
- Is there a deadline driving the sale (1031 exchange, divorce, estate, relocation)? That informs how much negotiation room exists.
- Schools are F-rated, which usually means shorter tenancies and higher turnover. Who's the typical renter profile here, and what's been the actual vacancy rate?
- Crime grade is D in this area — have there been break-ins, vandalism, or insurance claims at this property in the last 3 years? What carrier currently insures it and at what premium?
- The area grade is low — what's the realistic commute time and amenity access for the typical tenant pool here? Any planned neighborhood developments (good or bad) we should know about?
- What's the average days-on-market for RENTAL listings here right now (not sales)? A rising rental-DOM trend means longer vacancies and softer asking-rent achievability than the comps imply.
- What's the recent tenant-quality profile in this submarket — average credit score on applications, eviction rate, late-payment / NSF rate, and stable-employment percentage? A property-management company in the area should have these aggregated.
- How much new for-sale + rental construction is in the pipeline within 1–3 miles? Heavy new supply typically softens prices + rents 12–24 months out; constrained supply supports both.
Investment metrics
- 1% rule
- 0.73% ✗
- Cap rate
- 3.52%
- Cash-on-cash
- -9.89%
- DSCR
- 0.56
- GRM
- 11.3
CMA / ARV
- ARV (on-the-fly)
- $174,720
- Comps found
- 12
Show comp detail 12 sales within ~0.75 mi
| Address | Dist | Beds/Ba | Sqft | Sold | Price | $/sf | Match |
|---|---|---|---|---|---|---|---|
| 15417 Cherry Ln | 0.04mi | 3/1.0 | 1,040 (0%) | 5mo | $157,000 | $151 | 94 |
| 15315 Cherry Ln | 0.09mi | 3/1.0 | 1,040 (0%) | 3mo | $195,000 | $188 | 93 |
| 15313 Cherry Ln | 0.10mi | 3/1.0 | 1,036 (-0%) | 3mo | $89,000 | $86 | 92 |
| 15422 Cherry Ln | 0.05mi | 3/1.5 | 1,040 (0%) | 4mo | $175,000 | $168 | 92 |
| 15330 Cherry Ln | 0.04mi | 4/2.0 (+1) | 1,036 (-0%) | 2mo | $249,900 | $241 | 87 |
| 3236 Roesner Dr | 0.35mi | 3/1.0 | 1,036 (-0%) | 5mo | $77,000 | $74 | 79 |
| 3813 153rd St | 0.39mi | 2/1.0 (-1) | 1,075 (+3%) | 1mo | $268,130 | $249 | 70 |
| 15435 Hamlin Ave | 0.41mi | 3/1.0 | 1,107 (+6%) | 3mo | $155,000 | $140 | 68 |
| 14820 Turner Ave | 0.74mi | 3/1.0 | 1,064 (+2%) | 3mo | $150,000 | $141 | 59 |
| 15120 Springfield Ave | 0.58mi | 3/2.0 | 1,127 (+8%) | 1mo | $236,000 | $209 | 54 |
| 14850 Homan Ave | 0.66mi | 3/1.5 | 1,107 (+6%) | 5mo | $185,000 | $167 | 52 |
| 14839 Lawndale Ave | 0.71mi | 3/2.0 | 1,086 (+4%) | 4mo | $217,000 | $200 | 52 |
Match score weights: distance 35% · size 25% · config 20% · recency 20%. Top-matched comps best support the ARV.
Projected returns pro-forma
10.0% appreciation · 3.0% rent growth · sell at horizon
- IRR
- 17.4%
- Equity multiple
- 2.42×
- Total profit
- $79,584
- Equity at exit
- $179,906
- IRR
- 16.4%
- Equity multiple
- 5.61×
- Total profit
- $257,776
- Equity at exit
- $387,973
Cash invested: $55,916 (down + closing). Projections, not guarantees.
Landlord ↔ Tenant lean methodology
- Overall (STATE)
- 43 Moderately Tenant-Leaning
- State Illinois
- 43 Moderately Tenant-Leaning · D+7
- County
- — inherits STATE
- City
- — inherits STATE
ZIP-level market 60428
- Home prices YoY
- 8.5%
- Active inventory
- 65
- Price-to-rent
- 11.3×
Monthly cashflow live
- Estimated rent
- $1,467 medium interval (Pro) →
- Mortgage (P&I)
- −$1,047
- Tax from tax record
- −$489 /mo · $5,871/yr
- Insurance
- −$83
- HOA
- −$0
- Vacancy / Maint / Mgmt
- −$308
- Net cashflow
- $-461
Break-even live
Sensitivity live
| Price | -10% $-348 | -5% $-404 | +0% $-461 | +5% $-517 | +10% $-574 |
|---|---|---|---|---|---|
| Rent | -10% $-577 | -5% $-519 | +0% $-461 | +5% $-403 | +10% $-345 |
| Rate | -1.0pp $-360 | -0.5pp $-410 | base $-461 | +0.5pp $-513 | +1.0pp $-565 |
UW: 25.0% down · 7.5% · 30yr · 1.5% tax · 5.0% vac · 8.0% maint · 8.0% mgmt
Financing live
Cash to close
- Down payment
- $49,925
- Closing costs
- $5,991
- Reserves months
- —
- Total cash needed
- —
Loan-product check · same deal, 3 products live
Conventional
25% down · 7.5% · 30yr
- Down + closing
- —
- Monthly P&I
- —
- Monthly cashflow
- —
- DSCR
- —
- Eligible?
- —
Personal DTI + credit; lowest rate.
DSCR
20% down · 8.5% · 30yr
- Down + closing
- —
- Monthly P&I
- —
- Monthly cashflow
- —
- DSCR
- —
- Eligible?
- —
No personal income docs; deal must DSCR.
Hard money
10% down · 12.0% · 12mo
- Down + closing
- —
- Monthly P&I
- —
- Monthly cashflow
- —
- DSCR
- —
- Eligible?
- —
Short-term bridge; refi at stabilization.
Rent comps 3 comps
| Address | Beds | Baths | Sqft | Rent | $/sqft | DOM | Units | Dist |
|---|---|---|---|---|---|---|---|---|
| 3349 147th St Unit 3240 06 Midlothian, IL | 2.0 | 1.0 | 817 | $1,500 | $1.84 | 5d | 1 | 0.86mi |
| 3542 147th St Midlothian, IL | 2.0 | 1.0 | 817 | $1,500 | $1.84 | 6d | 2 | 0.91mi |
| 14521 Richmond Ave Unit 3 Posen, IL | 2.0 | 1.0 | 850 | $1,375 | $1.62 | 25d | 1 | 1.28mi |
Listing history 22 events
-
2026-06-18days on market $199,700 Active 28 DOM
-
2026-06-17days on market $199,700 Active 27 DOM
-
2026-06-16days on market $199,700 Active 26 DOM
-
2026-06-15days on market $199,700 Active 25 DOM
-
2026-06-13days on market $199,700 Active 23 DOM
-
2026-06-09days on market $199,700 Active 19 DOM
-
2026-06-08days on market $199,700 Active 18 DOM
-
2026-06-07days on market $199,700 Active 17 DOM
-
2026-06-04days on market $199,700 Active 14 DOM
-
2026-06-03days on market $199,700 Active 13 DOM
-
2026-06-02days on market $199,700 Active 12 DOM
-
2026-06-01days on market $199,700 Active 11 DOM
-
2026-05-31days on market $199,700 Active 10 DOM
-
2026-05-21$199,700 Active
-
2022-05-12soldstatus $98,000 Closed 276-char remark
Show marketing remark (276 chars)
4 Bedroom Step Ranch with Two Car Garage - Great income property or make your own with a few cosmetic touches. Month to month tenant; Investors Welcome!, First Time Home Buyers Welcome!, Whether you're seeking rental property or a second home! Schedule your appointment today!
-
2022-03-15historical Contingent - Continue to Show 276-char remark
Show marketing remark (276 chars)
4 Bedroom Step Ranch with Two Car Garage - Great income property or make your own with a few cosmetic touches. Month to month tenant; Investors Welcome!, First Time Home Buyers Welcome!, Whether you're seeking rental property or a second home! Schedule your appointment today!
-
2021-10-18$105,000 Active 276-char remark
Show marketing remark (276 chars)
4 Bedroom Step Ranch with Two Car Garage - Great income property or make your own with a few cosmetic touches. Month to month tenant; Investors Welcome!, First Time Home Buyers Welcome!, Whether you're seeking rental property or a second home! Schedule your appointment today!
-
2008-05-23soldstatus $40,000 278-char remark
Show marketing remark (278 chars)
Bank owned "As Is" Sale, save big money on this modern ranch with aluminum siding and garage. Great Rental house. Electric and gas are on, work needed but not bad. Call broker for special contracts and riders. Proof of funds required. Cash or purchase rehab loan only.
-
2008-04-16historical 278-char remark
Show marketing remark (278 chars)
Bank owned "As Is" Sale, save big money on this modern ranch with aluminum siding and garage. Great Rental house. Electric and gas are on, work needed but not bad. Call broker for special contracts and riders. Proof of funds required. Cash or purchase rehab loan only.
-
2008-03-13$41,900 278-char remark
Show marketing remark (278 chars)
Bank owned "As Is" Sale, save big money on this modern ranch with aluminum siding and garage. Great Rental house. Electric and gas are on, work needed but not bad. Call broker for special contracts and riders. Proof of funds required. Cash or purchase rehab loan only.
-
1995-01-05soldstatus $13,500
-
1995-01-05soldstatus $53,000
ⓘ Source: listings_history table (triggers on properties + properties_extension) + one-shot
backfill from property_details.listing_events for pre-trigger history.
Tax reassessment forecast IL · Partial reset (capped growth)
- Current annual tax
- $5,871 · $489/mo
- Projected year-2 tax
- $5,871 · $489/mo
- Expected delta
- $0/yr ($0/mo · 0.0%)
ⓘ Screening estimate from a state-policy table — verify with the county assessor before closing.
Climate risk First Street
- Flood 3/10 Moderate FEMA zone X (unshaded) · 20% chance over 30 yrs
- Wildfire 1/10 Low
- Heat 3/10 Moderate 7 d/yr ≥102°F today · 15 d/yr by 30 yrs out
- Wind 2/10 Low
- Air quality 3/10 Moderate 4 unhealthy d/yr today · 4 by 30 yrs out
Nearby sold comps map
Loading sold comps map…
Walkable amenities ~0.75 mi
Loading nearby amenities…
Taxation est. · year 1
- Rental income
- $17,604
- − Mortgage interest
- −$11,186
- − Property taxes
- −$5,871
- − Insurance
- −$998
- − Repairs & maintenance
- −$1,408
- − Management
- −$1,408
- − Depreciation
- −$5,809
- Taxable loss
- −$9,078
- Est. tax savings @ 24.0%
- +$2,179
- After-tax cash flow
- $-3,351/yr
For passive investors: Depreciation is non-cash, so a rental often shows a tax loss while cash-flowing — sheltering income. Rental losses are passive: they offset passive income freely, and up to $25,000/yr can offset ordinary (W-2) income if you actively participate and your MAGI is under $100k (phasing out to $0 by $150k); unused losses carry forward. On sale, claimed depreciation is recaptured at up to 25%, and gains may owe capital-gains tax (a 1031 exchange can defer both). Figures are a year-1 estimate at your 24.0% rate — not tax advice; consult a CPA.
Schools (NCES district)
- District
- Bremen Chsd 228
- NCES district ID
- 1707050
- Math proficiency
- 15% ▼ -4.00%
- Reading proficiency
- 17% ▼ -5.00%
- Median HH income
- $57,625
- Composite
- 15.32/100
- National rank
- #9327
- State rank
- #468 of 620 in IL
Livability — Markham
- Score
- 76/100
- State rank
- #186
- US rank
- #3539
Category grades
Schools grade is shown separately in the Schools card above.
Census & demographics
- Census place
- Markham, IL
- City population
- 10,980
- Population (ZIP)
- 10,980
Population outlook (Cook County) Hauer SSP2
- Today (2025)
- 5,347,519 people
- By 2030
- 5,357,703 · +0.2%
- By 2040
- 5,324,924 · -0.4%
- By 2050
- 5,230,762 · -2.2%
- By 2075
- 4,785,735 · -10.5%
- By 2100
- 4,188,836 · -21.7%
Race, ethnicity, and origin ACS 2023
- Neighborhood character
- Predominantly Black (69%)
- Race & ethnicity
- Black 69% Hispanic / Latino 17% White 11% Two or more races 4%
- Hispanic origin (detail)
- Mexican 16%
- Common ancestry
- Romanian 1% Lithuanian 1% Iranian 1%
- Foreign-born
- 8% · Canada
- Languages at home
- 86% English-only · Spanish 14%
Political lean MEDSL · Cook
- 2024 margin
- Solid D (+42.0) · D 70.4% · R 28.4% · Other 1.2%
- 2008→2024 swing
- -11.4pp toward R · 2008: 53.4pp · 2024: 42.0pp
- All cycles
- 2024: D+42.0 2020: D+50.3 2016: D+53.0 2012: D+49.4 2008: D+53.4
Not yet ingested
- Civics
- —
Market trends
- HPI YoY
- ▲ 23.63%
- Current HPI
- 302.333
- Rent YoY
- —
- Metro
- —
- State GDP YoY
- ▲ 1.59%
- F500 in state
- 60
Industry mix (Fortune 500 HQ in IL)
| Industry | F500 HQs | Revenue |
|---|---|---|
| Insurance | 4 | $201B |
|
||
| Consumer Goods | 4 | $87B |
|
||
| Industrial Machinery | 3 | $64B |
|
||
| Healthcare | 2 | $55B |
|
||
| Retail / Pharmacy | 1 | $148B |
|
||
| Agriculture / Food | 1 | $86B |
|
||
Price history
+1379.3% since first listed9 events — show timeline
- 2026-05-21 Listed $199,700 MRED as Distributed by MLS Grid
- 2022-05-12 Sold (MLS) $98,000 MRED as Distributed by MLS Grid
- 2022-03-15 Contingent — MRED as Distributed by MLS Grid
- 2021-10-18 Listed $105,000 MRED as Distributed by MLS Grid
- 2008-05-23 Sold (MLS) $40,000 MRED as Distributed by MLS Grid
- 2008-04-16 Listing Removed — MRED as Distributed by MLS Grid
- 2008-03-13 Listed $41,900 MRED as Distributed by MLS Grid
- 1995-01-05 Sold (Public Records) $53,000 Public Records
- 1995-01-05 Sold (Public Records) $13,500 Public Records
Property tax history
+9.8%/yrLatest (2023): $5,871 · +672.2% YoY. Source: county tax records.
Cash-flow waterfall
monthlySold comps — $/sqft
last 12 mo · ≤1 miLoading sold comps…