 Triplex
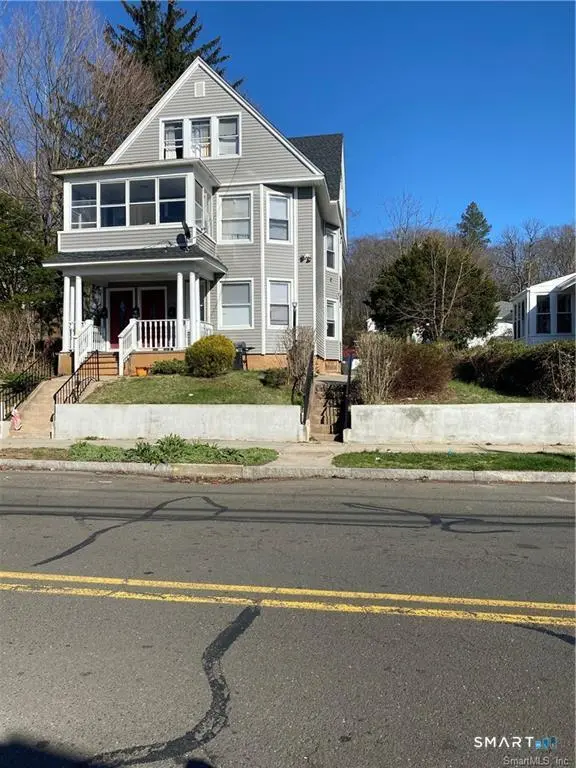
257 Lexington Ave · New Haven, CT
Flood risk 1/10 · Minimal
- FEMA flood zone
- X (unshaded)
- Chance of flooding over 30 yrs
- 0.0%
- Est. flood insurance / yr
- $473 – $860
Fire risk 2/10 · Minimal
- Est. fire insurance / yr
- $829 – $1,539
Heat risk 6/10 · Moderate
- Hot days now (above 97°F)
- 7 days/yr
- Hot days in 30 yrs
- 15 days/yr
Wind risk 6/10 · Moderate
- Chance of severe wind over 30 yrs
- 60.0%
Air-quality risk 5/10 · Moderate
- Unhealthy air days now
- 6 days/yr
- Unhealthy air days in 30 yrs
- 8 days/yr
Risk factors via First Street. Map © Google.
Why this score? — see what drove the D- grade
The composite is a weighted blend of 9 inputs, each scored 0–100. Each bar is that input's sub-score; the figure is the points it added to the 100-point composite (weight × sub-score).
- Cash flow +15.8/30.0
- DSCR +4.9/10.0
- 1% rule +4.0/10.0
- Livability +4.0/5.0
- Rent growth +3.5/5.0
- Condition / age +2.5/5.0
- Schools +1.5/10.0
- ARV discount +0.0/15.0
- Appreciation +0.0/10.0
$689,900
🖨 Deal sheet (PDF) 📄 Offer letter ✓ Due diligence
Multi-family units
County records classify this as Multi-Family (2-4 Unit). Listing-text estimate: 3 units. confirmed
Listing remarks MLS
Property will qualify for fha. Seller installing 2 new furnaces. Updated windows. 1St and 2nd floor has 2 full baths. Updated kitchens and baths. Minor tlc only required. All offers are subject to senior management approval. Not a short sale.
Key facts
- Spacious layouts
- Income potential
- Updated mechanicals
Tags
Property features AI
Finance
- Other:
- Financial info:
- HOA & community:
Exterior
- Parking:
- Security:
- Utilities: Public water connected; Public sewer connected; Hot water: natural gas and electric (domestic)
- Home design: Multi-family property (3-family)
- Construction: Frame construction; Brick and concrete foundation
- Exterior features: Asphalt shingle roof; Vinyl siding
Interior
- Kitchen:
- Bedrooms: 9 bedrooms
- Flooring:
- Bathrooms: 5 full bathrooms
- Heating & cooling: Hot air heating; Natural gas heat
- Interior features: 17 total rooms; Full, unfinished basement; Window-unit cooling
- Laundry & utility:
Neighborhood map
What this means for you Summary
Snapshot
- This is a 2×3bd/2ba + 1×3bd/1ba units multifamily listed at $690k.
Deal economics
- At list price, monthly cash flow is $321 ($4k/yr) — positive. Per door: $107/mo.
- The deal already cash-flows at list — no discount required.
- To meet the 1% rule (rent ≥ 1% of price), the offer needs to be $618k (10.5% below list).
- Recommended offer: $618k (10.5% below list) — sets the bar for 1% rule.
- Cap rate 6.9% vs local median 4.8% in New Haven — top-decile yield for the area; either an underpriced asset or a hidden risk that comps aren't pricing in. Stress-test before assuming the spread holds.
Location & tenants
- Location reads 79/100 on livability (#31 in CT, #2,190 nationally) — a middle-class / working-renter tenant base. Strengths: amenities A+, commute A+, health & safety A+; Watch: employment D, crime F.
- New Haven School District (urban): math 12% / reading 25% proficiency, ranked #147 of 153 in CT (top 96%) — low school quality limits family demand, transient renter base, plan for 1-2y turnover; 66% free/reduced lunch — lower-income household profile, screen leases tightly.
- Zoned schools: Betsy Ross Arts Magnet School (math 12% / reading 27%, grade F, #161 of 175 statewide, top 93%, 327 students, 70% FRL) — zoned schools at 70% FRL track the district average.
- Market conditions: Rents rising fast (+4.1%/yr); 102 active listings in the ZIP; 1,059 units permitted in South Central Connecticut Planning Region in 2024 (779 in 5+ unit buildings).
- At $6,176/mo this rent would consume 153% of the median local household income ($48k/yr) (locally 2664% of renters already pay >50% of income on rent) — very limited rent-growth headroom before tenants either downsize or default.
Forward outlook
- Local home prices are declining (-3.0%/yr); year-one equity from $5k of loan paydown is wiped out by about $21k of value loss. Plan a longer hold.
Negotiation context
- Only 9 days on market — expect competitive offers; lowballing is unlikely to land.
- 5 sale attempts since 22y ago with the ask held roughly flat each time — persistent listings suggest the price (not the market) is what's stuck; bring a comps-based counter.
- Current owner paid $170k; list at $690k implies a 306% gain — meaningful room to come down on a strong offer.
Risks & watch-outs
- Watch-outs: built in 1905 — expect roof / HVAC / electrical / plumbing capex.
- Climate carrying-cost: major wind risk, 60% chance of damaging wind over 30y; extreme-heat days projected 7→15/yr by 2055 (HVAC capex compounding) — expect insurance premiums to compound above CPI over the hold.
Questions for the listing agent
- Can we see the unit-by-unit rent roll, current vacancy, and any below-market leases? What's the average tenancy length?
- What capital expenditures (roof, boiler, parking lot, exteriors) have been made in the last 5 years, and what's planned in the next 2?
- Built in 1905 — when were the roof, HVAC, electrical panel, plumbing, and water heater last replaced?
- Is there a deadline driving the sale (1031 exchange, divorce, estate, relocation)? That informs how much negotiation room exists.
- Schools are D-rated, which usually means shorter tenancies and higher turnover. Who's the typical renter profile here, and what's been the actual vacancy rate?
- Crime grade is F in this area — have there been break-ins, vandalism, or insurance claims at this property in the last 3 years? What carrier currently insures it and at what premium?
- The area grade is low — what's the realistic commute time and amenity access for the typical tenant pool here? Any planned neighborhood developments (good or bad) we should know about?
- What's the average days-on-market for RENTAL listings here right now (not sales)? A rising rental-DOM trend means longer vacancies and softer asking-rent achievability than the comps imply.
- What's the recent tenant-quality profile in this submarket — average credit score on applications, eviction rate, late-payment / NSF rate, and stable-employment percentage? A property-management company in the area should have these aggregated.
- How much new apartment / multifamily construction is in the pipeline within 1–3 miles? Heavy new supply (>2% of stock underway) typically softens rents 12–24 months out; light construction supports rent growth.
Investment metrics
- 1% rule
- 0.90% ✗
- Cap rate
- 6.85%
- Cash-on-cash
- 1.99%
- DSCR
- 1.09
- GRM
- 9.3
CMA / ARV
- ARV (on-the-fly)
- $507,645
- Comps found
- 11
Show comp detail 11 sales within ~0.75 mi
| Address | Dist | Beds/Ba | Sqft | Sold | Price | $/sf | Match |
|---|---|---|---|---|---|---|---|
| 483 Quinnipiac Ave | 0.20mi | 6/3.0 | 3,546 (+1%) | 13mo | $540,000 | $152 | 78 |
| 248 Lexington Ave | 0.03mi | 6/3.0 | 3,303 (-6%) | 18mo | $450,000 | $136 | 74 |
| 169 Farren Ave | 0.53mi | 6/3.0 | 3,376 (-4%) | 1mo | $385,000 | $114 | 68 |
| 320 Lexington Ave | 0.12mi | 6/4.0 | 3,328 (-5%) | 21mo | $525,000 | $158 | 65 |
| 800 Quinnipiac Ave | 0.44mi | 7/3.0 (+1) | 3,126 (-11%) | 0mo | $725,000 | $232 | 56 |
| 193 Farren Ave | 0.50mi | 7/4.5 (+1) | 3,132 (-10%) | 3mo | $485,000 | $155 | 46 |
| 33 Chapel St | 0.44mi | 7/2.0 (+1) | 2,976 (-15%) | 1mo | $480,000 | $161 | 45 |
| 26 Clifton St | 0.31mi | 6/5.0 | 3,888 (+11%) | 19mo | $495,000 | $127 | 44 |
| 146-148 Farren Ave | 0.58mi | 6/3.0 | 3,270 (-7%) | 24mo | $340,000 | $104 | 42 |
| 32 Chatham St | 0.74mi | 5/4.0 (-1) | 3,271 (-7%) | 20mo | $430,000 | $131 | 29 |
| 60 Chatham St | 0.74mi | 5/3.0 (-1) | 3,053 (-13%) | 16mo | $444,000 | $145 | 25 |
Match score weights: distance 35% · size 25% · config 20% · recency 20%. Top-matched comps best support the ARV.
Projected returns pro-forma
-3.0% appreciation · 4.12% rent growth · sell at horizon
- IRR
- -11.9%
- Equity multiple
- 0.56×
- Total profit
- $-84,363
- Equity at exit
- $102,866
- IRR
- -1.3%
- Equity multiple
- 0.91×
- Total profit
- $-17,757
- Equity at exit
- $59,650
Cash invested: $193,172 (down + closing). Projections, not guarantees.
Landlord ↔ Tenant lean methodology
- Overall (STATE)
- 27 Tenant-Leaning
- State Connecticut
- 27 Tenant-Leaning · D+7
- County
- — inherits STATE
- City
- — inherits STATE
ZIP-level market 06513
- Home prices YoY
- -7.8%
- Rents YoY
- 4.1%
- Active inventory
- 102
- Price-to-rent
- 27.9×
Monthly cashflow live
- Estimated rent
- $6,176 high interval (Pro) →
- Mortgage (P&I)
- −$3,618
- Tax from tax record
- −$653 /mo · $7,835/yr
- Insurance
- −$287
- HOA
- −$0
- Vacancy / Maint / Mgmt
- −$1,297
- Net cashflow
- $321
Break-even live
Sensitivity live
| Price | -10% $711 | -5% $516 | +0% $321 | +5% $125 | +10% $-70 |
|---|---|---|---|---|---|
| Rent | -10% $-167 | -5% $77 | +0% $321 | +5% $565 | +10% $809 |
| Rate | -1.0pp $668 | -0.5pp $496 | base $321 | +0.5pp $142 | +1.0pp $-40 |
3-unit breakdown (identical units grouped — click to expand)
| Units | Beds | Baths | Est. rent |
|---|---|---|---|
| 2× units | 3 | 2 | $4,118 |
| #1 | 3 | 2 | $2,059 |
| #2 | 3 | 2 | $2,059 |
| 1× unit | 3 | 1 | $2,059 |
| Total (3 units) | $6,176 | ||
UW: 25.0% down · 7.5% · 30yr · 1.5% tax · 5.0% vac · 8.0% maint · 8.0% mgmt
Financing live
Cash to close
- Down payment
- $172,475
- Closing costs
- $20,697
- Reserves months
- —
- Total cash needed
- —
Loan-product check · same deal, 3 products live
Conventional
25% down · 7.5% · 30yr
- Down + closing
- —
- Monthly P&I
- —
- Monthly cashflow
- —
- DSCR
- —
- Eligible?
- —
Personal DTI + credit; lowest rate.
DSCR
20% down · 8.5% · 30yr
- Down + closing
- —
- Monthly P&I
- —
- Monthly cashflow
- —
- DSCR
- —
- Eligible?
- —
No personal income docs; deal must DSCR.
Hard money
10% down · 12.0% · 12mo
- Down + closing
- —
- Monthly P&I
- —
- Monthly cashflow
- —
- DSCR
- —
- Eligible?
- —
Short-term bridge; refi at stabilization.
Listing history 16 events
-
2026-06-07statusdays on market $689,900 Under Contract 9 DOM
-
2026-06-05days on market $689,900 Active 8 DOM
-
2026-06-03days on market $689,900 Active 7 DOM
-
2026-06-03days on market $689,900 Active 6 DOM
-
2026-06-01days on market $689,900 Active 5 DOM
-
2026-05-31days on market $689,900 Active 4 DOM
-
2026-05-27$689,900 Active
-
2022-05-17historical
-
2022-04-30$499,900 Active
-
2022-04-27historical
-
2011-05-20soldstatus $170,000 242-char remark
Show marketing remark (242 chars)
Property will qualify for fha. Seller installing 2 new furnaces. Updated windows. 1St and 2nd floor has 2 full baths. Updated kitchens and baths. Minor tlc only required. All offers are subject to senior management approval. Not a short sale.
-
2011-04-21$184,900 242-char remark
Show marketing remark (242 chars)
Property will qualify for fha. Seller installing 2 new furnaces. Updated windows. 1St and 2nd floor has 2 full baths. Updated kitchens and baths. Minor tlc only required. All offers are subject to senior management approval. Not a short sale.
-
2008-08-31historical
-
2008-05-15$449,500
-
2004-12-17soldstatus $256,000
-
2004-09-27$269,900
ⓘ Source: listings_history table (triggers on properties + properties_extension) + one-shot
backfill from property_details.listing_events for pre-trigger history.
Tax reassessment forecast CT · Partial reset (capped growth)
- Current annual tax
- $7,835 · $653/mo
- Projected year-2 tax
- $11,299 · $942/mo
- Expected delta
- +$3,464/yr (+$289/mo · 44.2%)
ⓘ Screening estimate from a state-policy table — verify with the county assessor before closing.
Climate risk First Street
- Flood 1/10 Low FEMA zone X (unshaded) · 0% chance over 30 yrs
- Wildfire 2/10 Low
- Heat 6/10 Major 7 d/yr ≥97°F today · 15 d/yr by 30 yrs out
- Wind 6/10 Major 60% chance of damaging wind over 30 yrs
- Air quality 5/10 Major 6 unhealthy d/yr today · 8 by 30 yrs out
Nearby sold comps map
Loading sold comps map…
Walkable amenities ~0.75 mi
Loading nearby amenities…
Taxation est. · year 1
- Rental income
- $74,112
- − Mortgage interest
- −$38,645
- − Property taxes
- −$7,835
- − Insurance
- −$3,450
- − Repairs & maintenance
- −$5,929
- − Management
- −$5,929
- − Depreciation
- −$20,070
- Taxable loss
- −$7,745
- Est. tax savings @ 24.0%
- +$1,859
- After-tax cash flow
- $5,708/yr
For passive investors: Depreciation is non-cash, so a rental often shows a tax loss while cash-flowing — sheltering income. Rental losses are passive: they offset passive income freely, and up to $25,000/yr can offset ordinary (W-2) income if you actively participate and your MAGI is under $100k (phasing out to $0 by $150k); unused losses carry forward. On sale, claimed depreciation is recaptured at up to 25%, and gains may owe capital-gains tax (a 1031 exchange can defer both). Figures are a year-1 estimate at your 24.0% rate — not tax advice; consult a CPA.
Schools (NCES district)
- District
- New Haven School District
- NCES district ID
- 0902790
- Math proficiency
- 12% ▼ -10.00%
- Reading proficiency
- 25% ▼ -10.00%
- Median HH income
- $38,058
- Composite
- 15.48/100
- National rank
- #9308
- State rank
- #147 of 153 in CT
Livability — New Haven
- Score
- 79/100
- State rank
- #31
- US rank
- #2190
Category grades
Schools grade is shown separately in the Schools card above.
Census & demographics
- Census place
- New Haven, CT
- County
- New Haven County · 688,236 people
- City population
- 132,813
- Metro
- New Haven-Milford, CT
- Population (ZIP)
- 38,888
- Household income
- $48,500
- Rent vs Own
- Severe rent burden
- 2664.0
Population outlook (South Central Connecticut County) Hauer SSP2
- By 2040
- 608,362
Race, ethnicity, and origin ACS 2023
- Neighborhood character
- Diverse neighborhood (Simpson 0.66)
- Race & ethnicity
- Hispanic / Latino 47% White 26% Black 22% Two or more races 12% Asian 1%
- Hispanic origin (detail)
- Mexican 7% Puerto Rican 25% Dominican 2%
- Common ancestry
- Romanian 2% Lithuanian 1% Slovak 1%
- Foreign-born
- 17% · Canada, Jamaica, South Korea
- Languages at home
- 56% English-only · Spanish 39% Other Indo-European 1% Russian/Polish/Slavic 1%
Political lean MEDSL · South Central Connecticut
- 2024 margin
- Strong D (+20.1) · D 59.0% · R 38.9% · Other 2.1%
- All cycles
- 2024: D+20.1
Not yet ingested
- Civics
- —
Market trends
- HPI YoY
- ▼ -30.87%
- Current HPI
- 364.006
- Rent YoY
- ▲ 4.12%
- Metro
- New Haven-Milford, CT
- State GDP YoY
- ▲ 1.06%
- F500 in state
- 38
Industry mix (Fortune 500 HQ in CT)
| Industry | F500 HQs | Revenue |
|---|---|---|
| Industrial Machinery | 4 | $38B |
|
||
| Insurance | 3 | $71B |
|
||
| Financial Services | 2 | $25B |
|
||
| Transportation / Logistics | 2 | $18B |
|
||
| Healthcare | 1 | $247B |
|
||
| Telecommunications | 1 | $55B |
|
||
Price history
+155.6% since first listed10 events — show timeline
- 2026-05-27 Listed $689,900 Smart MLS
- 2022-05-17 Listing Removed — Smart MLS
- 2022-04-30 Listed $499,900 Smart MLS
- 2022-04-27 Coming Soon — Smart MLS
- 2011-05-20 Sold (MLS) $170,000 Smart MLS
- 2011-04-21 Listed $184,900 Smart MLS
- 2008-08-31 Listing Removed — Smart MLS
- 2008-05-15 Listed $449,500 Smart MLS
- 2004-12-17 Sold (MLS) $256,000 Smart MLS
- 2004-09-27 Listed $269,900 Smart MLS
Property tax history
+3.8%/yrLatest (2023): $7,835 · -6.4% YoY. Source: county tax records.
Cash-flow waterfall
monthlySold comps — $/sqft
last 12 mo · ≤1 miLoading sold comps…