 Multi-family
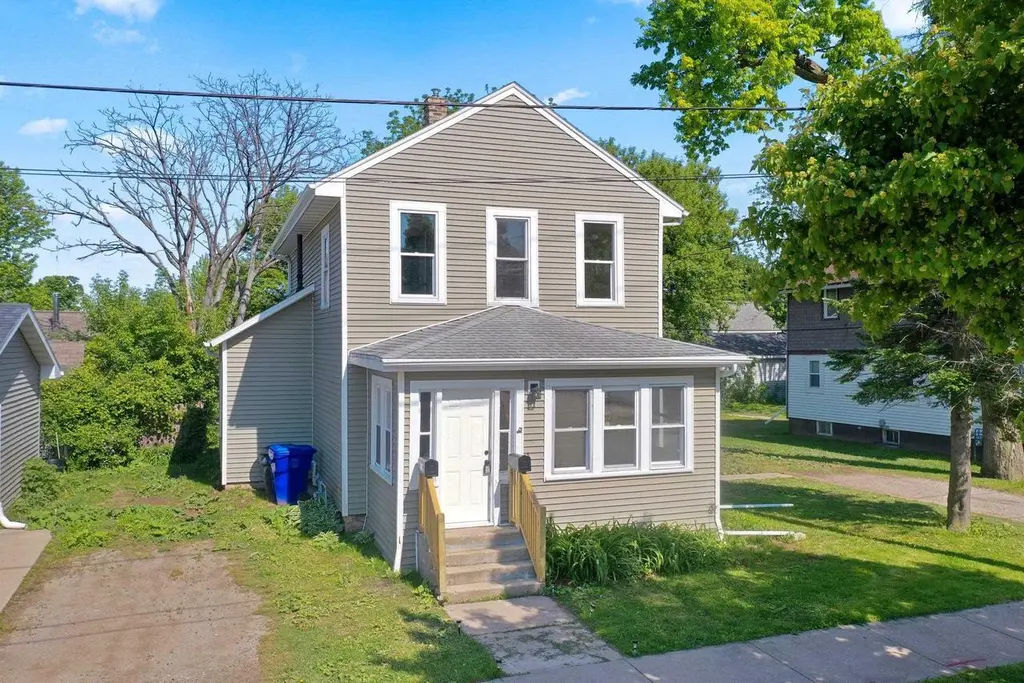
714 N Bateman St · Appleton, WI
Flood risk 1/10 · Minimal
- FEMA flood zone
- X (unshaded)
- Chance of flooding over 30 yrs
- 0.0%
- Est. flood insurance / yr
- $473 – $860
Fire risk 1/10 · Minimal
- Est. fire insurance / yr
- $636 – $1,182
Heat risk 2/10 · Minimal
- Hot days now (above 97°F)
- 7 days/yr
- Hot days in 30 yrs
- 12 days/yr
Wind risk 2/10 · Minimal
- Chance of severe wind over 30 yrs
- —
Air-quality risk 3/10 · Minor
- Unhealthy air days now
- 2 days/yr
- Unhealthy air days in 30 yrs
- 3 days/yr
Risk factors via First Street. Map © Google.
Why this score? — see what drove the B grade
The composite is a weighted blend of 9 inputs, each scored 0–100. Each bar is that input's sub-score; the figure is the points it added to the 100-point composite (weight × sub-score).
- Cash flow +30.0/30.0
- ARV discount +11.5/15.0
- DSCR +10.0/10.0
- 1% rule +8.4/10.0
- Livability +4.1/5.0
- Schools +3.0/10.0
- Rent growth +2.7/5.0
- Condition / age +2.5/5.0
- Appreciation +0.0/10.0
$239,900
🖨 Deal sheet 📄 Offer letter ✓ Due diligence
Multi-family units
County records classify this as Multi-Family (2-4 Unit). Listing-text estimate: 1 unit. estimate disagrees with records
Listing remarks
Updated and ready for it's new owners or tenants! Lower level features a large and bright living room, spacious dining area, a 3 seasons room AND screened porch, 2 bedrooms, and an office/bonus room in the back. Upstairs, you'll find another spacious unit with lots of natural light, large bedroom and additional room. All new cabinets, showers, plumbing fixtures, flooring, and so much more! Showings start 5/31/2026.
Key facts
- 3 seasons room
- Natural light
- Large living room
Tags
Property features AI
Finance
- Other: Inclusions: 2 refrigerators, 2 stoves, 2 microwaves, 1 washer/dryer unit, 2 window AC units
Exterior
- Parking: Outdoor parking
- Utilities: Municipal water; Municipal sewer
- Home design: Multi-family duplex; 2-story / bi-level configuration; Estimated total living area between 2,001 and 2,500 sq ft
- Construction: Built (year per assessor/public record)
- Exterior features: Vinyl exterior; Lot is approximately 0.17 acre; Zoned residential
Interior
- Kitchen: Unit 1: includes refrigerator, stove, microwave; Unit 2: includes refrigerator, stove, microwave (kitchen ~10 x 6)
- Bedrooms: Unit 1: 2 bedrooms; Unit 2: 1 bedroom (master ~10 x 9)
- Bathrooms: Unit 1: 1 full bathroom; Unit 2: 1 full bathroom
- Heating & cooling: Forced air heating; Natural gas fuel; Window air conditioning units (2)
- Interior features: Full stone basement; Two separate dwelling units (duplex)
- Laundry & utility: One shared washer/dryer unit
Neighborhood map
What this means for you Summary
Snapshot
- This is a 4-bed/2.0-bath multifamily listed at $240k.
Deal economics
- At list price, monthly cash flow is $992 ($12k/yr) — positive.
- The deal already cash-flows at list — no discount required.
- Meets the 1% rule at list price ($3k rent vs $240k).
- Recommended offer: $236k (1.5% below list) — sets the bar for market timing.
- Cap rate 11.3% vs local median 3.8% in Appleton — top-decile yield for the area; either an underpriced asset or a hidden risk that comps aren't pricing in. Stress-test before assuming the spread holds.
Location & tenants
- Location reads 82/100 on livability (#44 in WI, #1,073 nationally) — a professional / high-income tenant draw. Strengths: commute A+, cost of living A+, housing A+; Watch: amenities C-.
- Appleton Area School District (urban): math 33% / reading 36% proficiency, ranked #224 of 342 in WI (top 66%) — families likely to look elsewhere, expect single-tenant / working-renter base with shorter leases.
- Market conditions: Rents flat; 32 active listings in the ZIP; 5 comparable units currently listed for rent nearby; rentals lingering (median 44d on market — plan ~5-8 weeks vacancy on turnover, expect pricing pressure); 60% of comp listings sitting > 30 days — soft ceiling on asking rent; 460 units permitted in Outagamie County in 2024 (30 in 5+ unit buildings).
- At $3,219/mo this rent would consume 58% of the median local household income ($67k/yr) (locally 876% of renters already pay >50% of income on rent) — very limited rent-growth headroom before tenants either downsize or default.
Forward outlook
- Local home prices are declining (-3.0%/yr); year-one equity from $2k of loan paydown is wiped out by about $7k of value loss. Plan a longer hold.
- Outagamie County population projected at +8% by 2050 — modest demand growth; plan on rents tracking national, not racing it.
- At projected returns (-3.0% appreciation + 0.7% rent growth), your $67k cash investment doubles in ~9 years — after that, you're playing with house money.
Negotiation context
- It's been on market 22 days — a 2% lower offer ($236k) is reasonable based on typical stale-listing flexibility.
- Current owner paid $70k; list at $240k implies a 243% gain — meaningful room to come down on a strong offer.
Risks & watch-outs
- Watch-outs: built in 1870 — expect roof / HVAC / electrical / plumbing capex.
Questions for the listing agent
- Built in 1870 — when were the roof, HVAC, electrical panel, plumbing, and water heater last replaced?
- Is there a deadline driving the sale (1031 exchange, divorce, estate, relocation)? That informs how much negotiation room exists.
- What's the average days-on-market for RENTAL listings here right now (not sales)? A rising rental-DOM trend means longer vacancies and softer asking-rent achievability than the comps imply.
- What's the recent tenant-quality profile in this submarket — average credit score on applications, eviction rate, late-payment / NSF rate, and stable-employment percentage? A property-management company in the area should have these aggregated.
- How much new apartment / multifamily construction is in the pipeline within 1–3 miles? Heavy new supply (>2% of stock underway) typically softens rents 12–24 months out; light construction supports rent growth.
Investment metrics
- 1% rule
- 1.34% ✓
- Cap rate
- 11.26%
- Cash-on-cash
- 17.72%
- DSCR
- 1.79
- GRM
- 6.2
CMA / ARV
- ARV (on-the-fly)
- $263,424
- Comps found
- 5
Show comp detail 5 sales within ~0.75 mi
| Address | Dist | Beds/Ba | Sqft | Sold | Price | $/sf | Match |
|---|---|---|---|---|---|---|---|
| 221 E Winnebago St | 0.21mi | 4/2.5 | 2,244 (-5%) | 2mo | $295,000 | $131 | 79 |
| 108 E Atlantic St | 0.31mi | 4/2.5 | 2,434 (+4%) | 14mo | $230,000 | $94 | 66 |
| 120 E Pacific St | 0.29mi | 4/2.0 | 2,240 (-5%) | 23mo | $199,000 | $89 | 60 |
| 510 N Clark St | 0.54mi | 4/2.0 | 2,016 (-14%) | 4mo | $225,000 | $112 | 48 |
| 1208 N Superior St | 0.52mi | 4/2.0 | 2,012 (-14%) | 7mo | $237,500 | $118 | 46 |
Match score weights: distance 35% · size 25% · config 20% · recency 20%. Top-matched comps best support the ARV.
Projected returns pro-forma
-3.0% appreciation · 0.67% rent growth · sell at horizon
- IRR
- 6.6%
- Equity multiple
- 1.25×
- Total profit
- $16,922
- Equity at exit
- $35,770
- IRR
- 13.9%
- Equity multiple
- 2.00×
- Total profit
- $67,148
- Equity at exit
- $20,742
Cash invested: $67,172 (down + closing). Projections, not guarantees.
Landlord ↔ Tenant lean methodology
- Overall (STATE)
- 73 Landlord-Friendly
- State Wisconsin
- 73 Landlord-Friendly · R+2
- County
- — inherits STATE
- City
- — inherits STATE
ZIP-level market 54911
- Rents YoY
- 0.7%
- Active inventory
- 32
- Price-to-rent
- 12.4×
Monthly cashflow live
- Estimated rent
- $3,219 high interval (Pro) →
- Mortgage (P&I)
- −$1,258
- Tax from tax record
- −$193 /mo · $2,314/yr
- Insurance
- −$100
- HOA
- −$0
- Vacancy / Maint / Mgmt
- −$676
- Net cashflow
- $992
Break-even live
2-unit breakdown (identical units grouped — click to expand)
| Units | Beds | Baths | Est. rent |
|---|---|---|---|
| 2× units | 2 | 1 | $3,218 |
| #1 | 2 | 1 | $1,609 |
| #2 | 2 | 1 | $1,609 |
| Total (2 units) | $3,219 | ||
UW: 25.0% down · 7.5% · 30yr · 1.5% tax · 5.0% vac · 8.0% maint · 8.0% mgmt
Financing live
Cash to close
- Down payment
- $59,975
- Closing costs
- $7,197
- Reserves months
- —
- Total cash needed
- —
Loan-product check · same deal, 3 products live
Conventional
25% down · 7.5% · 30yr
- Down + closing
- —
- Monthly P&I
- —
- Monthly cashflow
- —
- DSCR
- —
- Eligible?
- —
Personal DTI + credit; lowest rate.
DSCR
20% down · 8.5% · 30yr
- Down + closing
- —
- Monthly P&I
- —
- Monthly cashflow
- —
- DSCR
- —
- Eligible?
- —
No personal income docs; deal must DSCR.
Hard money
10% down · 12.0% · 12mo
- Down + closing
- —
- Monthly P&I
- —
- Monthly cashflow
- —
- DSCR
- —
- Eligible?
- —
Short-term bridge; refi at stabilization.
Rent comps 5 comps
| Address | Beds | Baths | Sqft | Rent | $/sqft | DOM | Units | Dist |
|---|---|---|---|---|---|---|---|---|
| 609 S State St Unit 1061651P Appleton, WI | 4.0 | 2.5 | 1593 | $3,236 | $2.03 | 43d | 1 | 1.12mi |
| 634 W Prospect Ave Appleton, WI | 4.0 | 2.0 | 2200 | $2,000 | $0.91 | 43d | 1 | 1.27mi |
| 1115 N Mason St Appleton, WI | 3.0 | 2.0 | 1664 | $1,495 | $0.90 | 13d | 1 | 1.36mi |
| 918 E Windfield Pl Unit 918 Appleton, WI | 4.0 | 3.0 | 2000 | $2,395 | $1.20 | 43d | 1 | 1.42mi |
| 628 S Summit St Unit 1061613P Appleton, WI | 3.0 | 1.5 | 2389 | $9,835 | $4.12 | 21d | 1 | 1.43mi |
Listing history 20 events
-
2026-06-19days on market $239,900 Active 22 DOM
-
2026-06-18days on market $239,900 Active 21 DOM
-
2026-06-17days on market $239,900 Active 20 DOM
-
2026-06-16days on market $239,900 Active 19 DOM
-
2026-06-15days on market $239,900 Active 18 DOM
-
2026-06-14days on market $239,900 Active 16 DOM
-
2026-06-13days on market $239,900 Active 15 DOM
-
2026-06-10days on market $239,900 Active 13 DOM
-
2026-06-09days on market $239,900 Active 12 DOM
-
2026-06-08days on market $239,900 Active 11 DOM
-
2026-06-07days on market $239,900 Active 10 DOM
-
2026-06-05days on market $239,900 Active 7 DOM
-
2026-06-03days on market $239,900 Active 6 DOM
-
2026-06-02days on market $239,900 Active 5 DOM
-
2026-06-01days on market $239,900 Active 4 DOM
-
2026-05-31days on market $239,900 Active 3 DOM
-
2026-05-30days on market $239,900 Active 2 DOM
-
2026-05-28$239,900 Active
-
2003-12-10soldstatus $70,000
-
2002-06-26soldstatus $61,000
ⓘ Source: listings_history table (triggers on properties + properties_extension) + one-shot
backfill from property_details.listing_events for pre-trigger history.
Tax reassessment forecast WI · Partial reset (capped growth)
- Current annual tax
- $2,314 · $193/mo
- Projected year-2 tax
- $3,376 · $281/mo
- Expected delta
- +$1,062/yr (+$88/mo · 45.9%)
ⓘ Screening estimate from a state-policy table — verify with the county assessor before closing.
Climate risk First Street
- Flood 1/10 Low FEMA zone X (unshaded) · 0% chance over 30 yrs
- Wildfire 1/10 Low
- Heat 2/10 Low 7 d/yr ≥97°F today · 12 d/yr by 30 yrs out
- Wind 2/10 Low
- Air quality 3/10 Moderate 2 unhealthy d/yr today · 3 by 30 yrs out
Nearby sold comps map
Loading sold comps map…
Walkable amenities ~0.75 mi
Loading nearby amenities…
Taxation est. · year 1
- Rental income
- $38,628
- − Mortgage interest
- −$13,438
- − Property taxes
- −$2,314
- − Insurance
- −$1,200
- − Repairs & maintenance
- −$3,090
- − Management
- −$3,090
- − Depreciation
- −$6,979
- Taxable income
- $8,517
- Est. tax owed @ 24.0%
- −$2,044
- After-tax cash flow
- $9,861/yr
For passive investors: Depreciation is non-cash, so a rental often shows a tax loss while cash-flowing — sheltering income. Rental losses are passive: they offset passive income freely, and up to $25,000/yr can offset ordinary (W-2) income if you actively participate and your MAGI is under $100k (phasing out to $0 by $150k); unused losses carry forward. On sale, claimed depreciation is recaptured at up to 25%, and gains may owe capital-gains tax (a 1031 exchange can defer both). Figures are a year-1 estimate at your 24.0% rate — not tax advice; consult a CPA.
Schools (NCES district)
- District
- Appleton Area School District
- NCES district ID
- 5500390
- Math proficiency
- 33% ▼ -6.00%
- Reading proficiency
- 36% ▼ -1.00%
- Median HH income
- $53,892
- Composite
- 30.3/100
- National rank
- #6279
- State rank
- #224 of 342 in WI
Livability — Appleton
- Score
- 82/100
- State rank
- #44
- US rank
- #1073
Category grades
Schools grade is shown separately in the Schools card above.
Census & demographics
- Census place
- Appleton, WI
- County
- Outagamie County · 155,051 people
- City population
- 126,671
- Metro
- Appleton, WI
- Population (ZIP)
- 25,308
- Household income
- $67,001
- Rent vs Own
- Severe rent burden
- 876.0
Population outlook (Outagamie County) Hauer SSP2
- Today (2025)
- 195,863 people
- By 2030
- 201,154 · +2.7%
- By 2040
- 209,053 · +6.7%
- By 2050
- 211,957 · +8.2%
- By 2075
- 214,299 · +9.4%
- By 2100
- 200,825 · +2.5%
Race, ethnicity, and origin ACS 2023
- Neighborhood character
- Predominantly White (82%)
- Race & ethnicity
- White 82% Hispanic / Latino 7% Two or more races 6% Asian 6% Black 2%
- Hispanic origin (detail)
- Mexican 4% Puerto Rican 1%
- Common ancestry
- Romanian 9% Iranian 5% Portuguese 4%
- Foreign-born
- 6% · Canada, China, Vietnam
- Languages at home
- 90% English-only · Other Asian/Pacific 4% Spanish 3% Chinese 1%
Political lean MEDSL · Outagamie
- 2024 margin
- R (+10.2) · D 44.2% · R 54.4% · Other 1.5%
- 2008→2024 swing
- -21.8pp toward R · 2008: 11.6pp · 2024: -10.2pp
- All cycles
- 2024: R+10.2 2020: R+9.9 2016: R+12.6 2012: R+1.8 2008: D+11.6
Not yet ingested
- Civics
- —
Market trends
- HPI YoY
- ▼ -237.96%
- Current HPI
- 218.9027
- Rent YoY
- ▲ 0.67%
- Metro
- Appleton, WI
- State GDP YoY
- ▲ 2.10%
- F500 in state
- 20
Industry mix (Fortune 500 HQ in WI)
| Industry | F500 HQs | Revenue |
|---|---|---|
| Industrial Machinery | 4 | $23B |
|
||
| Industrial Technology | 2 | $36B |
|
||
| Insurance | 1 | $36B |
|
||
| Professional Services | 1 | $19B |
|
||
| Utilities | 1 | $9B |
|
||
| Consumer Goods | 1 | $3B |
|
||
Price history
+293.3% since first listed3 events — show timeline
- 2026-05-28 Listed $239,900 RANW
- 2003-12-10 Sold (Public Records) $70,000 Public Records
- 2002-06-26 Sold (Public Records) $61,000 Public Records
Property tax history
+1.4%/yrLatest (2025): $2,314 · +5.9% YoY. Source: county tax records.
Cash-flow waterfall
monthlySold comps — $/sqft
last 12 mo · ≤1 miLoading sold comps…