23805 Hackberry Pt · San Antonio, TX
Flood risk 1/10 · Minimal
- FEMA flood zone
- X (unshaded)
- Chance of flooding over 30 yrs
- 0.0%
- Est. flood insurance / yr
- $507 – $1,088
Fire risk 5/10 · Moderate
- Est. fire insurance / yr
- $1,222 – $2,270
Heat risk 8/10 · Major
- Hot days now (above 109°F)
- 7 days/yr
- Hot days in 30 yrs
- 20 days/yr
Wind risk 8/10 · Major
- Chance of severe wind over 30 yrs
- 80.0%
Air-quality risk 1/10 · Minimal
- Unhealthy air days now
- 0 days/yr
- Unhealthy air days in 30 yrs
- 0 days/yr
Risk factors via First Street. Map © Google.
Why this score? — see what drove the B grade
The composite is a weighted blend of 9 inputs, each scored 0–100. Each bar is that input's sub-score; the figure is the points it added to the 100-point composite (weight × sub-score).
- Cash flow +24.2/30.0
- ARV discount +15.0/15.0
- DSCR +7.8/10.0
- Appreciation +7.0/10.0
- 1% rule +6.3/10.0
- Livability +4.0/5.0
- Rent growth +2.5/5.0
- Condition / age +2.5/5.0
- Schools +1.8/10.0
$159,000
🖨 Deal sheet 📄 Offer letter ✓ Due diligence
Listing remarks MLS
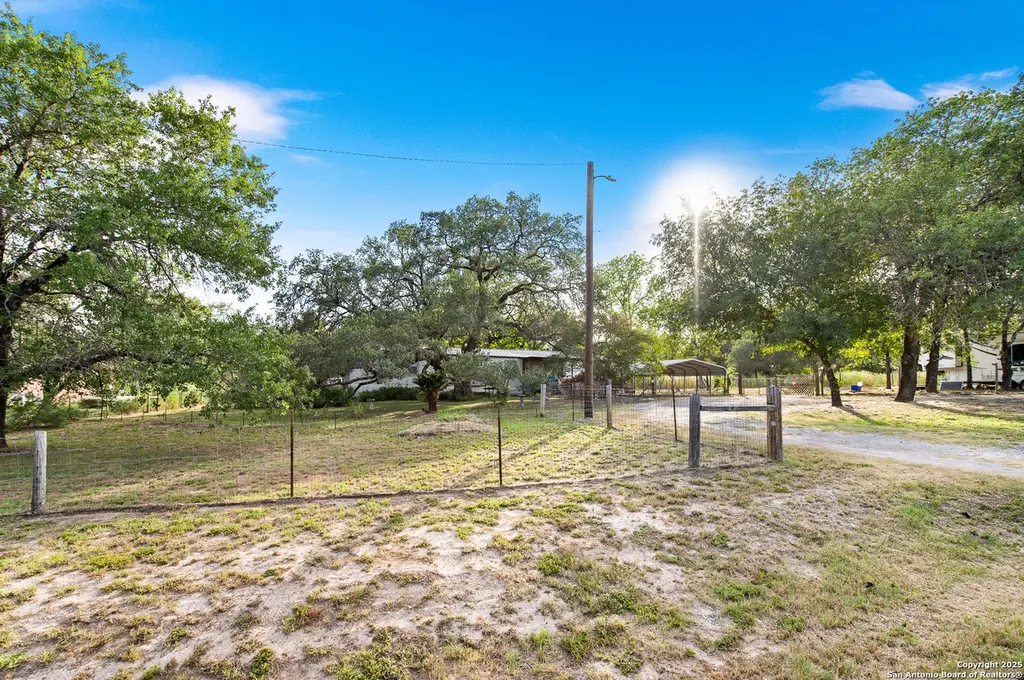
Don't let this affordable opportunity get away!! Located about 25 minutes from downtown SA this home has the right amount of country privacy but still close enough to city conveniences. Calaveras Lake is about 10 minutes away and is sure to scratch that fishing itch. Plenty of stores to choose from close by at i37 and Military Hwy and surrounding areas. The property is adorned with beautiful mature trees that will take your breath away. the house is set back from the street providing additional privacy on this cul-de-sac. The public school bus stop is also right down the street. The home is just under 1400 sqft, 3 bedrooms,2 baths, carport for 2 vehicles and a spacious kitchen/den. The bedrooms are well sized. Also, the front and back yard of this 1 acre property are perfect for family gatherings.
Key facts
- Calaveras lake
- Cul-de-sac
- Mature trees
Tags
Neighborhood map
What this means for you Summary
Snapshot
- This is a 3-bed/2.0-bath land listed at $159k.
Deal economics
- At list price, monthly cash flow is $318 ($4k/yr) — positive.
- The deal already cash-flows at list — no discount required.
- Meets the 1% rule at list price ($2k rent vs $159k).
- Recommended offer: $145k (9.0% below list) — sets the bar for market timing.
- Cap rate 8.7% vs local median 3.8% in San Antonio — top-decile yield for the area; either an underpriced asset or a hidden risk that comps aren't pricing in. Stress-test before assuming the spread holds.
Location & tenants
- Location reads 80/100 on livability (#31 in TX, #1,616 nationally) — a professional / high-income tenant draw. Strengths: amenities A+, commute A+, cost of living A+; Watch: schools C-, crime F.
- Southside ISD (rural): math 16% / reading 25% proficiency, ranked #771 of 826 in TX (top 93%) — low school quality limits family demand, transient renter base, plan for 1-2y turnover; 76% free/reduced lunch — lower-income household profile, screen leases tightly.
- Market conditions: 329 active listings in the ZIP; 1 comparable units currently listed for rent nearby; 8,308 units permitted in Bexar County in 2024 (2,506 in 5+ unit buildings).
Forward outlook
- In year one you build about $7k of equity ($1k loan paydown + $6k appreciation (3.9% local appreciation)).
- Bexar County population projected at +50% by 2050 — long-run rental-demand tailwind backs the buy-and-hold thesis.
- At projected returns (3.9% appreciation + 3.0% rent growth), your $45k cash investment doubles in ~4 years — after that, you're playing with house money.
- By year 5, paydown + projected appreciation supports a ~$32k cash-out refi (75% LTV) — recoverable capital for the next deal without selling this one.
Negotiation context
- It's been on market 109 days — a 9% lower offer ($145k) is reasonable based on typical stale-listing flexibility.
- 2 sale attempts with the ask held roughly flat each time — persistent listings suggest the price (not the market) is what's stuck; bring a comps-based counter.
Risks & watch-outs
- Climate carrying-cost: severe wind risk, 80% chance of damaging wind over 30y; moderate wildfire risk; extreme-heat days projected 7→20/yr by 2055 (HVAC capex compounding) — expect insurance premiums to compound above CPI over the hold.
Questions for the listing agent
- It's been on market 109 days. Have you received any prior offers? Is the seller open to a 9% concession, seller financing, or rate buy-down credit?
- Why hasn't it sold? Are there any deal-killer items the seller is aware of (foundation, flood, title, zoning, code violations)?
- Is there a deadline driving the sale (1031 exchange, divorce, estate, relocation)? That informs how much negotiation room exists.
- Crime grade is F in this area — have there been break-ins, vandalism, or insurance claims at this property in the last 3 years? What carrier currently insures it and at what premium?
- What's the average days-on-market for RENTAL listings here right now (not sales)? A rising rental-DOM trend means longer vacancies and softer asking-rent achievability than the comps imply.
- What's the recent tenant-quality profile in this submarket — average credit score on applications, eviction rate, late-payment / NSF rate, and stable-employment percentage? A property-management company in the area should have these aggregated.
- How much new for-sale + rental construction is in the pipeline within 1–3 miles? Heavy new supply typically softens prices + rents 12–24 months out; constrained supply supports both.
Investment metrics
- 1% rule
- 1.13% ✓
- Cap rate
- 8.69%
- Cash-on-cash
- 8.56%
- DSCR
- 1.38
- GRM
- 7.4
CMA / ARV
- ARV (median comp)
- $194,437
- List price
- $159,000
- Delta
- -18.23%
- Verdict
- UNDERPRICED
- Comps
- 7 within 1.0 mi
Projected returns pro-forma
3.94% appreciation · 3.0% rent growth · sell at horizon
- IRR
- 17.8%
- Equity multiple
- 2.07×
- Total profit
- $47,505
- Equity at exit
- $80,106
- IRR
- 18.5%
- Equity multiple
- 3.95×
- Total profit
- $131,225
- Equity at exit
- $130,614
Cash invested: $44,520 (down + closing). Projections, not guarantees.
Landlord ↔ Tenant lean methodology
- Overall (STATE)
- 87 Strongly Landlord-Friendly
- State Texas
- 87 Strongly Landlord-Friendly · R+5
- County
- — inherits STATE
- City
- — inherits STATE
ZIP-level market 78264
- Home prices YoY
- 1.3%
- Active inventory
- 329
- Price-to-rent
- 7.4×
Monthly cashflow live
- Estimated rent
- $1,800 medium interval (Pro) →
- Mortgage (P&I)
- −$834
- Tax from tax record
- −$204 /mo · $2,453/yr
- Insurance
- −$66
- HOA
- −$0
- Vacancy / Maint / Mgmt
- −$378
- Net cashflow
- $318
Break-even live
UW: 25.0% down · 7.5% · 30yr · 1.5% tax · 5.0% vac · 8.0% maint · 8.0% mgmt
Financing live
Cash to close
- Down payment
- $39,750
- Closing costs
- $4,770
- Reserves months
- —
- Total cash needed
- —
Loan-product check · same deal, 3 products live
Conventional
25% down · 7.5% · 30yr
- Down + closing
- —
- Monthly P&I
- —
- Monthly cashflow
- —
- DSCR
- —
- Eligible?
- —
Personal DTI + credit; lowest rate.
DSCR
20% down · 8.5% · 30yr
- Down + closing
- —
- Monthly P&I
- —
- Monthly cashflow
- —
- DSCR
- —
- Eligible?
- —
No personal income docs; deal must DSCR.
Hard money
10% down · 12.0% · 12mo
- Down + closing
- —
- Monthly P&I
- —
- Monthly cashflow
- —
- DSCR
- —
- Eligible?
- —
Short-term bridge; refi at stabilization.
Rent comps 1 comps
| Address | Beds | Baths | Sqft | Rent | $/sqft | DOM | Units | Dist |
|---|---|---|---|---|---|---|---|---|
| 22785 Petwood Dr San Antonio, TX | 3.0 | 1.0 | 1320 | $1,800 | $1.36 | 43d | 1 | 1.37mi |
Listing history 18 events
-
2026-06-18days on market $159,000 Active 109 DOM
-
2026-06-17days on market $159,000 Active 108 DOM
-
2026-06-16days on market $159,000 Active 107 DOM
-
2026-06-15days on market $159,000 Active 106 DOM
-
2026-06-13days on market $159,000 Active 104 DOM
-
2026-06-13days on market $159,000 Active 103 DOM
-
2026-06-09days on market $159,000 Active 100 DOM
-
2026-06-08days on market $159,000 Active 99 DOM
-
2026-06-07days on market $159,000 Active 98 DOM
-
2026-06-04days on market $159,000 Active 95 DOM
-
2026-06-03days on market $159,000 Active 94 DOM
-
2026-06-02days on market $159,000 Active 93 DOM
-
2026-06-01days on market $159,000 Active 92 DOM
-
2026-05-31days on market $159,000 Active 91 DOM
-
2026-03-01$159,000 New 809-char remark
Show marketing remark (809 chars)
Don't let this affordable opportunity get away!! Located about 25 minutes from downtown SA this home has the right amount of country privacy but still close enough to city conveniences. Calaveras Lake is about 10 minutes away and is sure to scratch that fishing itch. Plenty of stores to choose from close by at i37 and Military Hwy and surrounding areas. The property is adorned with beautiful mature trees that will take your breath away. the house is set back from the street providing additional privacy on this cul-de-sac. The public school bus stop is also right down the street. The home is just under 1400 sqft, 3 bedrooms,2 baths, carport for 2 vehicles and a spacious kitchen/den. The bedrooms are well sized. Also, the front and back yard of this 1 acre property are perfect for family gatherings.
-
2025-12-31historical
-
2025-12-13price $177,222
-
2025-08-01$188,777 New
ⓘ Source: listings_history table (triggers on properties + properties_extension) + one-shot
backfill from property_details.listing_events for pre-trigger history.
Tax reassessment forecast TX · Resets to sale price
- Current annual tax
- $2,453 · $204/mo
- Projected year-2 tax
- $2,910 · $242/mo
- Expected delta
- +$457/yr (+$38/mo · 18.6%)
ⓘ Screening estimate from a state-policy table — verify with the county assessor before closing.
Climate risk First Street
- Flood 1/10 Low FEMA zone X (unshaded) · 0% chance over 30 yrs
- Wildfire 5/10 Major
- Heat 8/10 Severe 7 d/yr ≥109°F today · 20 d/yr by 30 yrs out
- Wind 8/10 Severe 80% chance of damaging wind over 30 yrs
- Air quality 1/10 Low 0 unhealthy d/yr today · 0 by 30 yrs out
Nearby sold comps map
Loading sold comps map…
Walkable amenities ~0.75 mi
Loading nearby amenities…
Taxation est. · year 1
- Rental income
- $21,600
- − Mortgage interest
- −$8,906
- − Property taxes
- −$2,453
- − Insurance
- −$795
- − Repairs & maintenance
- −$1,728
- − Management
- −$1,728
- − Depreciation
- −$4,625
- Taxable income
- $1,365
- Est. tax owed @ 24.0%
- −$327
- After-tax cash flow
- $3,483/yr
For passive investors: Depreciation is non-cash, so a rental often shows a tax loss while cash-flowing — sheltering income. Rental losses are passive: they offset passive income freely, and up to $25,000/yr can offset ordinary (W-2) income if you actively participate and your MAGI is under $100k (phasing out to $0 by $150k); unused losses carry forward. On sale, claimed depreciation is recaptured at up to 25%, and gains may owe capital-gains tax (a 1031 exchange can defer both). Figures are a year-1 estimate at your 24.0% rate — not tax advice; consult a CPA.
Schools (NCES district)
- District
- Southside ISD
- NCES district ID
- 4840920
- Math proficiency
- 16% ▼ -15.00%
- Reading proficiency
- 25% ▼ -2.00%
- Median HH income
- $43,526
- Composite
- 17.68/100
- National rank
- #9027
- State rank
- #771 of 826 in TX
Livability — San Antonio
- Score
- 80/100
- State rank
- #31
- US rank
- #1616
Category grades
Schools grade is shown separately in the Schools card above.
Census & demographics
- City population
- 1,806,925
- Population (ZIP)
- 11,702
Population outlook (Bexar County) Hauer SSP2
- Today (2025)
- 2,336,851 people
- By 2030
- 2,560,728 · +9.6%
- By 2040
- 3,020,569 · +29.3%
- By 2050
- 3,493,522 · +49.5%
- By 2075
- 4,668,459 · +99.8%
- By 2100
- 5,533,242 · +136.8%
Race, ethnicity, and origin ACS 2023
- Neighborhood character
- Predominantly Hispanic (80%)
- Race & ethnicity
- Hispanic / Latino 80% Two or more races 35% White 17% Black 2% Native American 1%
- Hispanic origin (detail)
- Mexican 73%
- Common ancestry
- Lithuanian 1% Serbian 1% Greek 1%
- Foreign-born
- 14% · Canada
- Languages at home
- 48% English-only · Spanish 51% Tagalog/Filipino 0%
Political lean MEDSL · Bexar
- 2024 margin
- Lean D (+9.8) · D 54.3% · R 44.6% · Other 1.1%
- 2008→2024 swing
- +4.2pp toward D · 2008: 5.6pp · 2024: 9.8pp
- All cycles
- 2024: D+9.8 2020: D+18.2 2016: D+13.5 2012: D+4.6 2008: D+5.6
Not yet ingested
- Civics
- —
Market trends
- HPI YoY
- ▲ 3.94%
- Current HPI
- 298.8446
- Rent YoY
- —
- Metro
- —
- State GDP YoY
- ▲ 3.95%
- F500 in state
- 110
Industry mix (Fortune 500 HQ in TX)
| Industry | F500 HQs | Revenue |
|---|---|---|
| Energy | 16 | $1,198B |
|
||
| Technology | 5 | $198B |
|
||
| Engineering / Construction | 4 | $72B |
|
||
| Energy Services | 3 | $60B |
|
||
| Utilities | 3 | $41B |
|
||
| Healthcare | 2 | $330B |
|
||
Price history
-15.8% since first listed4 events — show timeline
- 2026-03-01 Listed $159,000 LERA
- 2025-12-31 Listing Removed — LERA
- 2025-12-13 Price Changed $177,222 LERA
- 2025-08-01 Listed $188,777 LERA
Property tax history
+5.2%/yrLatest (2025): $2,453 · +7.1% YoY. Source: county tax records.
Cash-flow waterfall
monthlySold comps — $/sqft
last 12 mo · ≤1 miLoading sold comps…