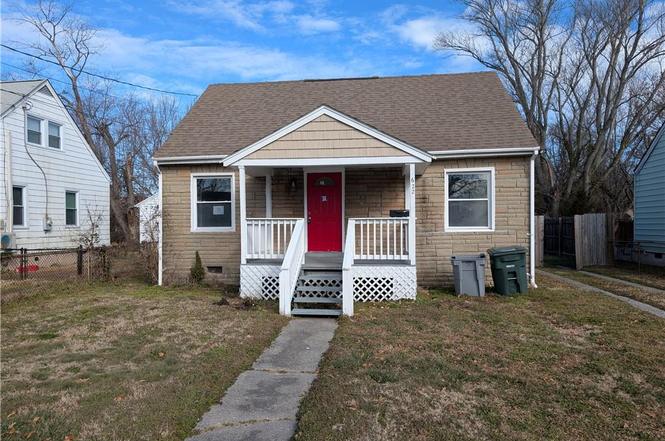
622 Chapel St · Hampton, VA
Flood risk 4/10 · Minor
- FEMA flood zone
- X (unshaded)
- Chance of flooding over 30 yrs
- 0.13%
- Est. flood insurance / yr
- $473 – $860
Fire risk 1/10 · Minimal
- Est. fire insurance / yr
- $666 – $1,236
Heat risk 9/10 · Severe
- Hot days now (above 105°F)
- 7 days/yr
- Hot days in 30 yrs
- 16 days/yr
Wind risk 8/10 · Major
- Chance of severe wind over 30 yrs
- 80.0%
Air-quality risk 2/10 · Minimal
- Unhealthy air days now
- 1 days/yr
- Unhealthy air days in 30 yrs
- 1 days/yr
Risk factors via First Street. Map © Google.
Why this score? — see what drove the C grade
The composite is a weighted blend of 9 inputs, each scored 0–100. Each bar is that input's sub-score; the figure is the points it added to the 100-point composite (weight × sub-score).
- Cash flow +17.1/30.0
- ARV discount +15.0/15.0
- Schools +5.5/10.0
- DSCR +5.3/10.0
- 1% rule +4.5/10.0
- Rent growth +3.9/5.0
- Livability +3.8/5.0
- Condition / age +2.5/5.0
- Appreciation +0.0/10.0
$196,000
🖨 Deal sheet 📄 Offer letter ✓ Due diligence
Listing remarks
Come home to this 3 bedroom Cape Cod home located in Hampton Virginia near Downtown Hampton. Two bedrooms are located on the first level with full bath and loft style bedroom with a half bath upstairs!
Key facts
- 6,499 sq ft lot
- Built 1947
- Listed 31 days
Neighborhood map
What this means for you Summary
Snapshot
- This is a 3-bed/1.5-bath single-family listed at $196k.
Deal economics
- At list price, monthly cash flow is $137 ($2k/yr) — positive.
- The deal already cash-flows at list — no discount required.
- To meet the 1% rule (rent ≥ 1% of price), the offer needs to be $186k (5.3% below list).
- Recommended offer: $186k (5.3% below list) — sets the bar for 1% rule.
- Cap rate 7.1% vs local median 4.5% in Hampton — top-decile yield for the area; either an underpriced asset or a hidden risk that comps aren't pricing in. Stress-test before assuming the spread holds.
Location & tenants
- Location reads 75/100 on livability (#133 in VA, #4,302 nationally) — a middle-class / working-renter tenant base. Strengths: housing A+, health & safety A+, cost of living A; Watch: crime C-, amenities D+, commute F.
- Hampton City Public School District (urban): math 60% / reading 70% proficiency, ranked #40 of 131 in VA (top 30%) — acceptable for families but not a draw, mixed tenant base, ~2y average lease.
- Zoned schools: A.W.E. Bassette Elementary (math 32% / reading 47%, grade F, #900 of 1,108 statewide, top 83%, 494 students, 87% FRL); Phoebus High (math 57% / reading 76%, grade B, #195 of 319 statewide, top 62%, 1,365 students, 86% FRL) — zoned schools average 86% FRL vs 49% district-wide (37 pts higher); higher-poverty schools than district average — tighter screening recommended.
- Zoned-school proficiency averages 53% at this address vs 65% district-wide (-12 pts) — the specific schools serving this property underperform the Hampton City Public School District average; the district grade overstates school quality for this exact location.
- Market conditions: Rents rising fast (+5.4%/yr); 232 active listings in the ZIP; 25 comparable units currently listed for rent nearby; rentals at typical pace (median 22d on market — plan ~3-4 weeks tenant-placement turnaround); 68 units permitted in Hampton city in 2024 (0 in 5+ unit buildings).
Forward outlook
- Local home prices are declining (-3.0%/yr); year-one equity from $1k of loan paydown is wiped out by about $6k of value loss. Plan a longer hold.
- Hampton County population projected at -13% by 2050 — secular population decline; favor cash flow + early exit over multi-decade hold.
Negotiation context
- It's been on market 31 days — a 3% lower offer ($190k) is reasonable based on typical stale-listing flexibility.
- 8 sale attempts since 8y ago with the ask held roughly flat each time — persistent listings suggest the price (not the market) is what's stuck; bring a comps-based counter.
- Current owner paid $121k; list at $196k implies a 62% gain — meaningful room to come down on a strong offer.
Risks & watch-outs
- Watch-outs: built in 1947 — expect roof / HVAC / electrical / plumbing capex.
- Climate carrying-cost: severe wind risk, 80% chance of damaging wind over 30y; extreme-heat days projected 7→16/yr by 2055 (HVAC capex compounding) — expect insurance premiums to compound above CPI over the hold.
Questions for the listing agent
- It's been on market 31 days. Have you received any prior offers? Is the seller open to a 5% concession, seller financing, or rate buy-down credit?
- Built in 1947 — when were the roof, HVAC, electrical panel, plumbing, and water heater last replaced?
- Is there a deadline driving the sale (1031 exchange, divorce, estate, relocation)? That informs how much negotiation room exists.
- Schools are B-rated — typically a magnet for longer-tenancy family renters. What's the average tenant stay here, and is there a school-zone premium baked into asking?
- What's the average days-on-market for RENTAL listings here right now (not sales)? A rising rental-DOM trend means longer vacancies and softer asking-rent achievability than the comps imply.
- What's the recent tenant-quality profile in this submarket — average credit score on applications, eviction rate, late-payment / NSF rate, and stable-employment percentage? A property-management company in the area should have these aggregated.
- How much new for-sale + rental construction is in the pipeline within 1–3 miles? Heavy new supply typically softens prices + rents 12–24 months out; constrained supply supports both.
Investment metrics
- 1% rule
- 0.95% ✗
- Cap rate
- 7.13%
- Cash-on-cash
- 2.99%
- DSCR
- 1.13
- GRM
- 8.8
CMA / ARV
- ARV (on-the-fly)
- $253,968
- Comps found
- 12
Show comp detail 12 sales within ~0.75 mi
| Address | Dist | Beds/Ba | Sqft | Sold | Price | $/sf | Match |
|---|---|---|---|---|---|---|---|
| 622 Chapel St | 0.00mi | 3/1.5 | 1,221 (0%) | 1mo | $193,000 | $158 | 99 |
| 703 Augusta St | 0.29mi | 3/1.5 | 1,200 (-2%) | 6mo | $240,000 | $200 | 79 |
| 19 Maplewood St | 0.23mi | 3/2.0 | 1,132 (-7%) | 2mo | $240,000 | $212 | 74 |
| 812 Ridgeway Ave | 0.50mi | 3/1.5 | 1,240 (+2%) | 3mo | $250,000 | $202 | 72 |
| 3912 Victoria Blvd | 0.47mi | 3/1.0 | 1,152 (-6%) | 3mo | $219,000 | $190 | 64 |
| 460 England Ave | 0.33mi | 3/2.5 | 1,107 (-9%) | 1mo | $230,000 | $208 | 64 |
| 44 Henry St | 0.66mi | 3/2.0 | 1,284 (+5%) | 0mo | $299,900 | $234 | 58 |
| 710 Rutherford St | 0.71mi | 3/2.0 | 1,256 (+3%) | 5mo | $289,000 | $230 | 56 |
| 814 Downing St | 0.74mi | 3/1.5 | 1,116 (-9%) | 3mo | $210,000 | $188 | 49 |
| 227 Lee St | 0.58mi | 3/1.5 | 1,386 (+14%) | 5mo | $215,000 | $155 | 46 |
| 509 Homestead Ave | 0.55mi | 3/2.5 | 1,400 (+15%) | 6mo | $300,000 | $214 | 41 |
| 355 Ivy Home Rd | 0.57mi | 4/2.5 (+1) | 1,400 (+15%) | 0mo | $299,800 | $214 | 40 |
Match score weights: distance 35% · size 25% · config 20% · recency 20%. Top-matched comps best support the ARV.
Projected returns pro-forma
-3.0% appreciation · 5.44% rent growth · sell at horizon
- IRR
- -8.9%
- Equity multiple
- 0.67×
- Total profit
- $-18,374
- Equity at exit
- $29,224
- IRR
- 3.5%
- Equity multiple
- 1.28×
- Total profit
- $15,407
- Equity at exit
- $16,946
Cash invested: $54,880 (down + closing). Projections, not guarantees.
Landlord ↔ Tenant lean methodology
- Overall (STATE)
- 55 Moderately Landlord-Leaning
- State Virginia
- 55 Moderately Landlord-Leaning · D+2
- County
- — inherits STATE
- City
- — inherits STATE
ZIP-level market 23669
- Rents YoY
- 5.4%
- Active inventory
- 232
- Price-to-rent
- 8.8×
Monthly cashflow live
- Estimated rent
- $1,857 high interval (Pro) →
- Mortgage (P&I)
- −$1,028
- Tax from tax record
- −$221 /mo · $2,650/yr
- Insurance
- −$82
- HOA
- −$0
- Vacancy / Maint / Mgmt
- −$390
- Net cashflow
- $137
Break-even live
UW: 25.0% down · 7.5% · 30yr · 1.5% tax · 5.0% vac · 8.0% maint · 8.0% mgmt
Financing live
Cash to close
- Down payment
- $49,000
- Closing costs
- $5,880
- Reserves months
- —
- Total cash needed
- —
Loan-product check · same deal, 3 products live
Conventional
25% down · 7.5% · 30yr
- Down + closing
- —
- Monthly P&I
- —
- Monthly cashflow
- —
- DSCR
- —
- Eligible?
- —
Personal DTI + credit; lowest rate.
DSCR
20% down · 8.5% · 30yr
- Down + closing
- —
- Monthly P&I
- —
- Monthly cashflow
- —
- DSCR
- —
- Eligible?
- —
No personal income docs; deal must DSCR.
Hard money
10% down · 12.0% · 12mo
- Down + closing
- —
- Monthly P&I
- —
- Monthly cashflow
- —
- DSCR
- —
- Eligible?
- —
Short-term bridge; refi at stabilization.
Rent comps 25 comps
| Address | Beds | Baths | Sqft | Rent | $/sqft | DOM | Units | Dist |
|---|---|---|---|---|---|---|---|---|
| 626 Chapel St Hampton, VA | 4.0 | 2.0 | 1470 | $1,900 | $1.29 | 12d | 1 | 0.02mi |
| 607 Lee St Hampton, VA | 3.0 | 1.5 | 1404 | $2,150 | $1.53 | 44d | 1 | 0.11mi |
| 901 W Queen St Hampton, VA | 2.0–3.0 | 1.5–2.5 | 1096 | $1,600 | $1.46 | 44d | 1 | 0.14mi |
| 448 Chapel St Hampton, VA | 3.0 | 2.0 | 1425 | $1,850 | $1.30 | 3d | 1 | 0.27mi |
| 603 La Salle Ave Hampton, VA | 2.0 | 1.0 | 759 | $1,000 | $1.32 | 44d | 1 | 0.32mi |
| 640 Homestead Ave Hampton, VA | 3.0 | 1.0 | 852 | $1,750 | $2.05 | 44d | 1 | 0.40mi |
| 708 Westwood Ave Hampton, VA | 3.0 | 2.5 | 1300 | $2,300 | $1.77 | 14d | 1 | 0.54mi |
| 507 Highland Ave Hampton, VA | 2.0 | 1.0 | 925 | $1,500 | $1.62 | 14d | 1 | 0.58mi |
| 702 Rutherford St Hampton, VA | 3.0 | 2.0 | 1445 | $1,795 | $1.24 | 23d | 1 | 0.68mi |
| 3785 Kecoughtan Rd Hampton, VA | 1.0–2.0 | 1.0 | 650 | $1,425 | $2.19 | 44d | 5 | 0.99mi |
| 3605 Kecoughtan Rd Hampton, VA | 2.0 | 1.0 | 800 | $1,200 | $1.50 | 44d | 1 | 1.08mi |
| 708 Norwood Cir Hampton, VA | 2.0 | 1.0 | 720 | $1,050 | $1.46 | 23d | 1 | 1.09mi |
| 3750 Kecoughtan Rd Hampton, VA | 2.0 | 1.5 | 1300 | $1,600 | $1.23 | 44d | 1 | 1.10mi |
| 2 Abbott Dr Hampton, VA | 1.0–3.0 | 1.0–3.5 | 1187 | $2,891 | $2.43 | 1d | 18 | 1.12mi |
| 1625 W Pembroke Ave Hampton, VA | 2.0 | 1.5 | 950 | $1,250 | $1.32 | 23d | 1 | 1.14mi |
| 1625 W Pembroke Ave Unit 7 Hampton, VA | 2.0 | 1.5 | 950 | $1,250 | $1.32 | 44d | 1 | 1.15mi |
| 234 Washington St Hampton, VA | 2.0 | 1.0 | 1111 | $2,000 | $1.80 | 10d | 1 | 1.15mi |
| 600 Freeman Dr Hampton, VA | 1.0–2.0 | 1.0–2.0 | 892 | $2,008 | $2.25 | 2d | 8 | 1.16mi |
| 100 Spanish Trl Hampton, VA | 1.0–2.0 | 1.0–1.5 | 812 | $1,450 | $1.79 | 1d | 12 | 1.23mi |
| 1105 Easterly Ave Hampton, VA | 3.0 | 1.5 | 1204 | $1,800 | $1.50 | 14d | 1 | 1.23mi |
| 8 Rip Rap Rd Hampton, VA | 2.0 | 1.0 | 1000 | $1,200 | $1.20 | 21d | 1 | 1.28mi |
| 31 Saxony Pl Hampton, VA | 3.0 | 2.5 | 1315 | $1,645 | $1.25 | 17d | 1 | 1.35mi |
| 17 S Gawain Way Hampton, VA | 3.0 | 1.5 | 1460 | $1,895 | $1.30 | 3d | 1 | 1.41mi |
| 19 Bernard Ave Hampton, VA | 2.0 | 1.0 | 906 | $995 | $1.10 | 21d | 1 | 1.42mi |
| 63 Algonquin Rd Hampton, VA | 2.0 | 1.0 | 1100 | $1,495 | $1.36 | 44d | 1 | 1.44mi |
Listing history 24 events
-
2026-04-01status Under Contract
-
2026-03-19price $196,000
-
2026-03-16status Active
-
2026-02-28status Under Contract
-
2026-02-11$206,000 Active
-
2024-02-12status Under Contract
-
2024-01-19historical Active Under Contract
-
2024-01-12price $229,900
-
2024-01-05price $235,000
-
2024-01-03status Active
-
2023-12-26historical Active Under Contract
-
2023-12-15price $239,500
-
2023-12-12$239,999 Active
-
2023-11-09soldstatus $121,000
-
2020-05-27historical
-
2020-01-29$135,000 Active
-
2018-09-17soldstatus $110,000
-
2018-09-11soldstatus $110,000
-
2018-08-13status Under Contract
-
2018-06-28$108,000 Active
-
2018-06-28$108,000
-
2018-06-26historical
-
2018-03-22$108,000 Active
-
2008-03-17soldstatus $144,900
ⓘ Source: listings_history table (triggers on properties + properties_extension) + one-shot
backfill from property_details.listing_events for pre-trigger history.
Tax reassessment forecast VA · Resets to sale price
- Current annual tax
- $2,650 · $221/mo
- Projected year-2 tax
- $2,650 · $221/mo
- Expected delta
- $0/yr ($0/mo · 0.0%)
ⓘ Screening estimate from a state-policy table — verify with the county assessor before closing.
Climate risk First Street
- Flood 4/10 Moderate FEMA zone X (unshaded) · 13% chance over 30 yrs
- Wildfire 1/10 Low
- Heat 9/10 Extreme 7 d/yr ≥105°F today · 16 d/yr by 30 yrs out
- Wind 8/10 Severe 80% chance of damaging wind over 30 yrs
- Air quality 2/10 Low 1 unhealthy d/yr today · 1 by 30 yrs out
Nearby sold comps map
Loading sold comps map…
Walkable amenities ~0.75 mi
Loading nearby amenities…
Taxation est. · year 1
- Rental income
- $22,284
- − Mortgage interest
- −$10,979
- − Property taxes
- −$2,650
- − Insurance
- −$980
- − Repairs & maintenance
- −$1,783
- − Management
- −$1,783
- − Depreciation
- −$5,702
- Taxable loss
- −$1,593
- Est. tax savings @ 24.0%
- +$382
- After-tax cash flow
- $2,022/yr
For passive investors: Depreciation is non-cash, so a rental often shows a tax loss while cash-flowing — sheltering income. Rental losses are passive: they offset passive income freely, and up to $25,000/yr can offset ordinary (W-2) income if you actively participate and your MAGI is under $100k (phasing out to $0 by $150k); unused losses carry forward. On sale, claimed depreciation is recaptured at up to 25%, and gains may owe capital-gains tax (a 1031 exchange can defer both). Figures are a year-1 estimate at your 24.0% rate — not tax advice; consult a CPA.
Schools (NCES district)
- District
- Hampton City Public School District
- NCES district ID
- 5101800
- Math proficiency
- 60% ▼ -21.00%
- Reading proficiency
- 70% ▼ -4.00%
- Median HH income
- $50,089
- Composite
- 55.19/100
- National rank
- #1272
- State rank
- #40 of 131 in VA
Livability — Hampton
- Score
- 75/100
- State rank
- #133
- US rank
- #4302
Category grades
Schools grade is shown separately in the Schools card above.
Census & demographics
- Census place
- Hampton, VA
- County
- Hampton City · 132,421 people
- City population
- 132,421
- Metro
- Virginia Beach-Norfolk-Newport News, VA-NC
- Population (ZIP)
- 39,884
- Household income
- $71,222
- Rent vs Own
- Severe rent burden
- 2130.0
Population outlook (Hampton County) Hauer SSP2
- Today (2025)
- 134,055 people
- By 2030
- 131,753 · -1.7%
- By 2040
- 125,017 · -6.7%
- By 2050
- 116,825 · -12.9%
- By 2075
- 97,033 · -27.6%
- By 2100
- 76,188 · -43.2%
Race, ethnicity, and origin ACS 2023
- Neighborhood character
- Diverse neighborhood (Simpson 0.63)
- Race & ethnicity
- Black 46% White 39% Two or more races 9% Hispanic / Latino 6% Asian 2%
- Hispanic origin (detail)
- Mexican 1% Puerto Rican 2%
- Common ancestry
- Slovak 2% Italian 1% Romanian 1%
- Foreign-born
- 4% · Canada
- Languages at home
- 95% English-only · Spanish 3% Other Asian/Pacific 1%
Political lean MEDSL · Hampton
- 2024 margin
- Solid D (+39.9) · D 69.2% · R 29.4% · Other 1.4%
- 2008→2024 swing
- +1.0pp no change · 2008: 38.9pp · 2024: 39.9pp
- All cycles
- 2024: D+39.9 2020: D+42.2 2016: D+37.8 2012: D+45.4 2008: D+38.9
Not yet ingested
- Civics
- —
Market trends
- HPI YoY
- ▼ -150.40%
- Current HPI
- 276.4636
- Rent YoY
- ▲ 5.44%
- Metro
- Virginia Beach-Norfolk-Newport News, VA-NC
- State GDP YoY
- ▲ 2.40%
- F500 in state
- 50
Industry mix (Fortune 500 HQ in VA)
| Industry | F500 HQs | Revenue |
|---|---|---|
| Aerospace / Defense | 4 | $236B |
|
||
| Technology / Defense | 3 | $32B |
|
||
| Financial Services | 2 | $176B |
|
||
| Utilities | 2 | $27B |
|
||
| Insurance | 2 | $25B |
|
||
| Technology | 2 | $15B |
|
||
Price history
+35.3% since first listed24 events — show timeline
- 2026-04-01 Pending — REINMLS
- 2026-03-19 Price Changed $196,000 REINMLS
- 2026-03-16 Relisted — REINMLS
- 2026-02-28 Pending — REINMLS
- 2026-02-11 Listed $206,000 REINMLS
- 2024-02-12 Pending — REINMLS
- 2024-01-19 Contingent — REINMLS
- 2024-01-12 Price Changed $229,900 REINMLS
- 2024-01-05 Price Changed $235,000 REINMLS
- 2024-01-03 Relisted — REINMLS
- 2023-12-26 Contingent — REINMLS
- 2023-12-15 Price Changed $239,500 REINMLS
- 2023-12-12 Listed $239,999 REINMLS
- 2023-11-09 Sold (Public Records) $121,000 Public Records
- 2020-05-27 Listing Removed — REINMLS
- 2020-01-29 Listed $135,000 REINMLS
- 2018-09-17 Sold (Public Records) $110,000 Public Records
- 2018-09-11 Sold (MLS) $110,000 WMLS
- 2018-08-13 Pending — REINMLS
- 2018-06-28 Listed $108,000 WMLS
- 2018-06-28 Listed $108,000 REINMLS
- 2018-06-26 Listing Removed — REINMLS
- 2018-03-22 Listed $108,000 REINMLS
- 2008-03-17 Sold (Public Records) $144,900 Public Records
Property tax history
+11.5%/yrLatest (2025): $2,650 · +8.2% YoY. Source: county tax records.
Cash-flow waterfall
monthlySold comps — $/sqft
last 12 mo · ≤1 miLoading sold comps…