 🏗️ New Construction
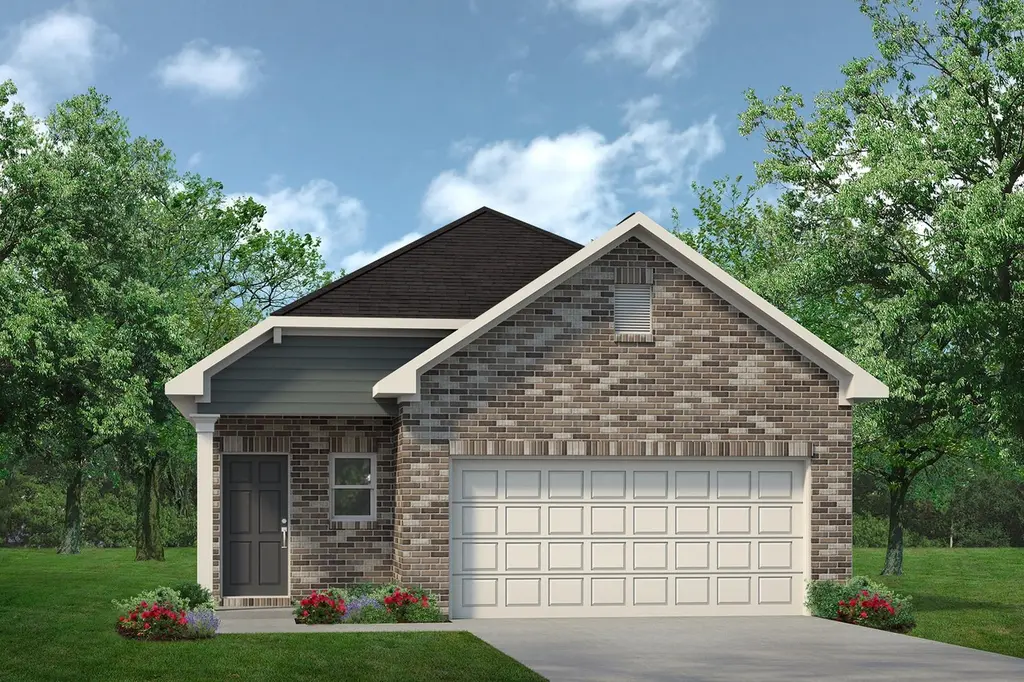
The Mockingbird II Plan · Conroe, TX
Flood risk 1/10 · Minimal
- FEMA flood zone
- X (unshaded)
- Chance of flooding over 30 yrs
- 0.0%
- Est. flood insurance / yr
- $507 – $1,088
Fire risk 5/10 · Moderate
- Est. fire insurance / yr
- $1,222 – $2,270
Heat risk 8/10 · Major
- Hot days now (above 111°F)
- 7 days/yr
- Hot days in 30 yrs
- 25 days/yr
Wind risk 8/10 · Major
- Chance of severe wind over 30 yrs
- 99.0%
Air-quality risk 2/10 · Minimal
- Unhealthy air days now
- 1 days/yr
- Unhealthy air days in 30 yrs
- 2 days/yr
Risk factors via First Street. Map © Google.
Why this score? — see what drove the D grade
The composite is a weighted blend of 9 inputs, each scored 0–100. Each bar is that input's sub-score; the figure is the points it added to the 100-point composite (weight × sub-score).
- Cash flow +13.0/30.0
- ARV discount +7.5/15.0
- Schools +5.4/10.0
- Condition / age +4.0/5.0
- DSCR +3.9/10.0
- 1% rule +3.7/10.0
- Livability +3.7/5.0
- Rent growth +2.6/5.0
- Appreciation +0.0/10.0
$252,990
🖨 Deal sheet (PDF) 📄 Offer letter ✓ Due diligence
Listing remarks
The Mockingbird II displays an excellent use of space and packs a lot of home into its smartly designed single-story layout. A covered front porch leads into the foyer with access to the mud room off the garage. A dining area connects the expansive family room and kitchen at the rear of the home. The primary bedroom and bathroom are separate from the three secondary bedrooms, which share a bathroom and laundry room at the back of the home. A covered rear patio makes for the perfect outdoor entertainment area with options to expand the patio for even more space.
Key facts
- Covered front porch
- Covered rear patio
- Dining area
Tags
Property features AI
Finance
- Financial info: List price $252,990
Exterior
- Parking: 2-car garage / 2 total parking spaces
- Home design: Single-family plan (The Mockingbird II); Living area approximately 1689
- Exterior features: Located on Keenan Cut Off Rd, Montgomery TX
Interior
- Bedrooms: 4 bedrooms
- Bathrooms: 2 full bathrooms
- Interior features: Plan home (The Mockingbird II)
Neighborhood map
What this means for you Summary
Snapshot
- This is a 4-bed/2.0-bath single-family listed at $253k. Condition is rated good.
Deal economics
- At list price, monthly cash flow is $-15 ($-179/yr) — negative.
- To cash-flow at today's rent, offer at most $251k (1.0% below list).
- To meet the 1% rule (rent ≥ 1% of price), the offer needs to be $219k (13.4% below list).
- Recommended offer: $219k (13.4% below list) — sets the bar for 1% rule.
- Cap rate 6.2% vs local median 3.1% in Conroe — top-decile yield for the area; either an underpriced asset or a hidden risk that comps aren't pricing in. Stress-test before assuming the spread holds.
Location & tenants
- Location reads 74/100 on livability (#169 in TX, #4,447 nationally) — a middle-class / working-renter tenant base. Strengths: cost of living A+, housing A+, amenities B; Watch: commute F, health & safety F.
- Montgomery ISD (rural): math 63% / reading 57% proficiency, ranked #49 of 826 in TX (top 6%) — acceptable for families but not a draw, mixed tenant base, ~2y average lease.
- Zoned schools: Lone Star El (math 57% / reading 61%, grade B-, #455 of 4,322 statewide, top 11%, 766 students, 16% FRL); Montgomery J H (math 68% / reading 54%, grade B+, #145 of 1,662 statewide, top 9%, 1,045 students, 30% FRL); Montgomery H S (math 53% / reading 62%, grade C, #327 of 1,632 statewide, top 20%, 1,556 students, 25% FRL) — zoned schools at 24% FRL track the district average.
- Market conditions: Rents flat; 2300 active listings in the ZIP; high-income renter base; 13,259 units permitted in Montgomery County in 2024 (1,402 in 5+ unit buildings).
Forward outlook
- Local home prices are declining (-3.0%/yr); year-one equity from $2k of loan paydown is wiped out by about $8k of value loss. Plan a longer hold.
- Montgomery County population projected at +65% by 2050 — long-run rental-demand tailwind backs the buy-and-hold thesis.
Negotiation context
- It's been on market 61 days — a 6% lower offer ($238k) is reasonable based on typical stale-listing flexibility.
Risks & watch-outs
- Climate carrying-cost: severe wind risk, 99% chance of damaging wind over 30y; moderate wildfire risk; extreme-heat days projected 7→25/yr by 2055 (HVAC capex compounding) — expect insurance premiums to compound above CPI over the hold.
Questions for the listing agent
- What do current leases actually rent for vs. the listed asking? Can we see a recent rent roll and the last 12 months of T-12 income?
- It's been on market 61 days. Have you received any prior offers? Is the seller open to a 13% concession, seller financing, or rate buy-down credit?
- Why hasn't it sold? Are there any deal-killer items the seller is aware of (foundation, flood, title, zoning, code violations)?
- Is there a deadline driving the sale (1031 exchange, divorce, estate, relocation)? That informs how much negotiation room exists.
- Schools are D-rated, which usually means shorter tenancies and higher turnover. Who's the typical renter profile here, and what's been the actual vacancy rate?
- The area grade is low — what's the realistic commute time and amenity access for the typical tenant pool here? Any planned neighborhood developments (good or bad) we should know about?
- What's the average days-on-market for RENTAL listings here right now (not sales)? A rising rental-DOM trend means longer vacancies and softer asking-rent achievability than the comps imply.
- What's the recent tenant-quality profile in this submarket — average credit score on applications, eviction rate, late-payment / NSF rate, and stable-employment percentage? A property-management company in the area should have these aggregated.
- How much new for-sale + rental construction is in the pipeline within 1–3 miles? Heavy new supply typically softens prices + rents 12–24 months out; constrained supply supports both.
Investment metrics
- 1% rule
- 0.87% ✗
- Cap rate
- 6.22%
- Cash-on-cash
- -0.25%
- DSCR
- 0.99
- GRM
- 9.6
CMA / ARV
- ARV (median comp)
- $252,699
- List price
- $252,990
- Delta
- 0.12%
- Verdict
- FAIR
- Comps
- 7 within 1.0 mi
Projected returns pro-forma
-3.0% appreciation · 0.4% rent growth · sell at horizon
- IRR
- -19.7%
- Equity multiple
- 0.33×
- Total profit
- $-47,456
- Equity at exit
- $37,678
- IRR
- -19.2%
- Equity multiple
- 0.09×
- Total profit
- $-64,184
- Equity at exit
- $21,849
Cash invested: $70,756 (down + closing). Projections, not guarantees.
Landlord ↔ Tenant lean methodology
- Overall (STATE)
- 87 Strongly Landlord-Friendly
- State Texas
- 87 Strongly Landlord-Friendly · R+5
- County
- — inherits STATE
- City
- — inherits STATE
ZIP-level market 77316
- Home prices YoY
- -10.7%
- Rents YoY
- 0.4%
- Active inventory
- 2300
- Price-to-rent
- 9.6×
Monthly cashflow live
- Estimated rent
- $2,192 medium interval (Pro) →
- Mortgage (P&I)
- −$1,325
- Tax est. 1.5%
- −$316 /mo · $3,790/yr
- Insurance
- −$105
- HOA
- −$0
- Vacancy / Maint / Mgmt
- −$460
- Net cashflow
- $-15
Break-even live
Sensitivity live
| Price | -10% $160 | -5% $72 | +0% $-15 | +5% $-102 | +10% $-190 |
|---|---|---|---|---|---|
| Rent | -10% $-188 | -5% $-102 | +0% $-15 | +5% $72 | +10% $158 |
| Rate | -1.0pp $112 | -0.5pp $49 | base $-15 | +0.5pp $-80 | +1.0pp $-147 |
UW: 25.0% down · 7.5% · 30yr · 1.5% tax · 5.0% vac · 8.0% maint · 8.0% mgmt
Financing live
Cash to close
- Down payment
- $63,175
- Closing costs
- $7,581
- Reserves months
- —
- Total cash needed
- —
Loan-product check · same deal, 3 products live
Conventional
25% down · 7.5% · 30yr
- Down + closing
- —
- Monthly P&I
- —
- Monthly cashflow
- —
- DSCR
- —
- Eligible?
- —
Personal DTI + credit; lowest rate.
DSCR
20% down · 8.5% · 30yr
- Down + closing
- —
- Monthly P&I
- —
- Monthly cashflow
- —
- DSCR
- —
- Eligible?
- —
No personal income docs; deal must DSCR.
Hard money
10% down · 12.0% · 12mo
- Down + closing
- —
- Monthly P&I
- —
- Monthly cashflow
- —
- DSCR
- —
- Eligible?
- —
Short-term bridge; refi at stabilization.
Listing history 16 events
-
2026-06-21days on market $252,990 Active 61 DOM
-
2026-06-18days on market $252,990 Active 58 DOM
-
2026-06-17days on market $252,990 Active 57 DOM
-
2026-06-16days on market $252,990 Active 56 DOM
-
2026-06-15days on market $252,990 Active 55 DOM
-
2026-06-13days on market $252,990 Active 53 DOM
-
2026-06-13days on market $252,990 Active 52 DOM
-
2026-06-09days on market $252,990 Active 49 DOM
-
2026-06-08days on market $252,990 Active 48 DOM
-
2026-06-07days on market $252,990 Active 47 DOM
-
2026-06-04days on market $252,990 Active 44 DOM
-
2026-06-03days on market $252,990 Active 43 DOM
-
2026-06-02days on market $252,990 Active 42 DOM
-
2026-06-01days on market $252,990 Active 41 DOM
-
2026-05-31days on market $252,990 Active 40 DOM
-
2026-04-21$252,990 Active 567-char remark
ⓘ Source: listings_history table (triggers on properties + properties_extension) + one-shot
backfill from property_details.listing_events for pre-trigger history.
Climate risk First Street
- Flood 1/10 Low FEMA zone X (unshaded) · 0% chance over 30 yrs
- Wildfire 5/10 Major
- Heat 8/10 Severe 7 d/yr ≥111°F today · 25 d/yr by 30 yrs out
- Wind 8/10 Severe 99% chance of damaging wind over 30 yrs
- Air quality 2/10 Low 1 unhealthy d/yr today · 2 by 30 yrs out
Nearby sold comps map
Loading sold comps map…
Walkable amenities ~0.75 mi
Loading nearby amenities…
Taxation est. · year 1
- Rental income
- $26,300
- − Mortgage interest
- −$14,155
- − Property taxes
- −$3,790
- − Insurance
- −$1,263
- − Repairs & maintenance
- −$2,104
- − Management
- −$2,104
- − Depreciation
- −$7,351
- Taxable loss
- −$4,469
- Est. tax savings @ 24.0%
- +$1,072
- After-tax cash flow
- $893/yr
For passive investors: Depreciation is non-cash, so a rental often shows a tax loss while cash-flowing — sheltering income. Rental losses are passive: they offset passive income freely, and up to $25,000/yr can offset ordinary (W-2) income if you actively participate and your MAGI is under $100k (phasing out to $0 by $150k); unused losses carry forward. On sale, claimed depreciation is recaptured at up to 25%, and gains may owe capital-gains tax (a 1031 exchange can defer both). Figures are a year-1 estimate at your 24.0% rate — not tax advice; consult a CPA.
Condition & rehab AI · 6 photos
The home is in good condition with no visible major repairs needed. It has a good exterior, interior, and landscaping, making it a good candidate for cosmetic updates to increase its value.
Value-add opportunities
- Both Painting the exterior siding — Fresh paint can enhance the curb appeal and increase the home's value.
- Both Landscaping improvements — Well-maintained landscaping can increase the home's curb appeal and attract more potential buyers.
- Both Interior touch-ups — Fresh paint and minor touch-ups can refresh the interior and make it more appealing to potential buyers.
- Rental HVAC maintenance — A well-maintained HVAC system can attract more renters and reduce utility costs.
- Resale Kitchen and bathroom updates — Updating the kitchen and bathrooms can increase the home's appeal and value for potential buyers.
- Both Landscaping and curb appeal — A well-maintained exterior can increase the home's curb appeal and attract more potential buyers and renters.
Renovation cost estimate screening
Value-add ROI direction
- Both Painting the exterior siding — Fresh paint can enhance the curb appeal and increase the home's value. ↑
- Both Landscaping improvements — Well-maintained landscaping can increase the home's curb appeal and attract more potential buyers. ↑
- Both Interior touch-ups — Fresh paint and minor touch-ups can refresh the interior and make it more appealing to potential buyers. ↑
- Rental HVAC maintenance — A well-maintained HVAC system can attract more renters and reduce utility costs. ↑
- Resale Kitchen and bathroom updates — Updating the kitchen and bathrooms can increase the home's appeal and value for potential buyers. ↑
- Both Landscaping and curb appeal — A well-maintained exterior can increase the home's curb appeal and attract more potential buyers and renters. ↑
ⓘ Cost ranges are severity-bucket heuristics (US national rule-of-thumb). Get contractor quotes + a written scope before underwriting a rehab budget.
Schools (NCES district)
- District
- Montgomery ISD
- NCES district ID
- 4831260
- Math proficiency
- 63% ▼ -3.00%
- Reading proficiency
- 57% ▼ -3.00%
- Median HH income
- $75,596
- Composite
- 53.55/100
- National rank
- #1445
- State rank
- #49 of 826 in TX
Livability — Conroe
- Score
- 74/100
- State rank
- #169
- US rank
- #4447
Category grades
Schools grade is shown separately in the Schools card above.
Census & demographics
- County
- Montgomery County · 663,713 people
- City population
- 32,847
- Metro
- Houston-The Woodlands-Sugar Land, TX
- Population (ZIP)
- 34,694
- Household income
- $124,055
- Rent vs Own
- Severe rent burden
- 273.0
Population outlook (Montgomery County) Hauer SSP2
- Today (2025)
- 713,896 people
- By 2030
- 805,263 · +12.8%
- By 2040
- 992,708 · +39.1%
- By 2050
- 1,179,590 · +65.2%
- By 2075
- 1,628,084 · +128.1%
- By 2100
- 1,937,880 · +171.5%
Race, ethnicity, and origin ACS 2023
- Neighborhood character
- Predominantly White (80%)
- Race & ethnicity
- White 80% Hispanic / Latino 14% Two or more races 11% Black 1% Asian 1%
- Hispanic origin (detail)
- Mexican 9%
- Common ancestry
- Lithuanian 6% Slovak 3% Romanian 3%
- Foreign-born
- 6% · Canada
- Languages at home
- 90% English-only · Spanish 8%
Political lean MEDSL · Montgomery
- 2024 margin
- Solid R (+45.5) · D 26.8% · R 72.3%
- 2008→2024 swing
- +7.2pp toward D · 2008: -52.7pp · 2024: -45.5pp
- All cycles
- 2024: R+45.5 2020: R+43.8 2016: R+51.4 2012: R+60.7 2008: R+52.7
Not yet ingested
- Civics
- —
Market trends
- HPI YoY
- ▼ -31.44%
- Current HPI
- 262.6973
- Rent YoY
- ▲ 0.40%
- Metro
- Houston-The Woodlands-Sugar Land, TX
- State GDP YoY
- ▲ 3.95%
- F500 in state
- 110
Industry mix (Fortune 500 HQ in TX)
| Industry | F500 HQs | Revenue |
|---|---|---|
| Energy | 16 | $1,198B |
|
||
| Technology | 5 | $198B |
|
||
| Engineering / Construction | 4 | $72B |
|
||
| Energy Services | 3 | $60B |
|
||
| Utilities | 3 | $41B |
|
||
| Healthcare | 2 | $330B |
|
||
Cash-flow waterfall
monthlySold comps — $/sqft
last 12 mo · ≤1 miLoading sold comps…