 🏗️ New Construction
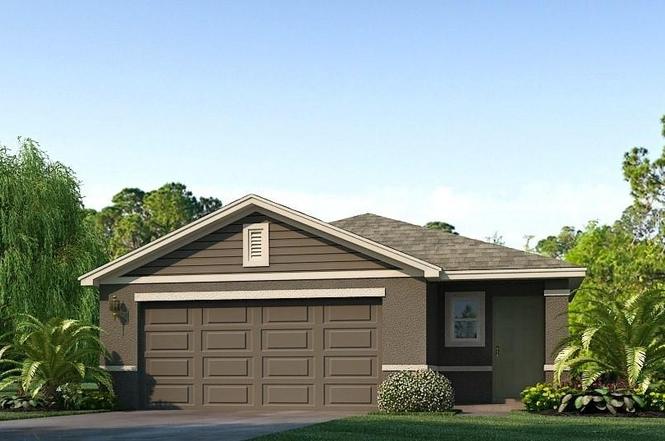
9920 Wimico Ter · Ruskin, FL
Flood risk 6/10 · Moderate
- FEMA flood zone
- X (unshaded)
- Chance of flooding over 30 yrs
- 0.68%
- Est. flood insurance / yr
- $507 – $1,088
Fire risk 5/10 · Moderate
- Est. fire insurance / yr
- $947 – $1,759
Heat risk 10/10 · Severe
- Hot days now (above 107°F)
- 7 days/yr
- Hot days in 30 yrs
- 28 days/yr
Wind risk 10/10 · Severe
- Chance of severe wind over 30 yrs
- 99.0%
Air-quality risk 3/10 · Minor
- Unhealthy air days now
- 3 days/yr
- Unhealthy air days in 30 yrs
- 3 days/yr
Risk factors via First Street. Map © Google.
Why this score? — see what drove the D grade
The composite is a weighted blend of 9 inputs, each scored 0–100. Each bar is that input's sub-score; the figure is the points it added to the 100-point composite (weight × sub-score).
- Cash flow +13.0/30.0
- ARV discount +7.5/15.0
- Schools +4.4/10.0
- DSCR +3.9/10.0
- Livability +3.6/5.0
- 1% rule +3.1/10.0
- Condition / age +2.5/5.0
- Rent growth +2.3/5.0
- Appreciation +0.0/10.0
$350,990
🖨 Deal sheet (PDF) 📄 Offer letter ✓ Due diligence
Listing remarks
Under Construction. Receive up to $20,000 towards Flex Cash & Closing Costs + special interest rates with the use of our preferred lender - now through February 15th. A front porch welcomes to you into one-story all concrete block construction home. Designed to optimizes living space with an open concept kitchen that overlooks the versatile great room and large covered lanai. The well-appointed kitchen features an island with bar seating, oversized walk-in pantry and sleek stainless-steel appliances! Bedroom one is located behind the kitchen and has an ensuite bathroom with double vanity and spacious walk-in closet providing substantial storage space. A second bedroom and bath are loc
Key facts
- Open concept kitchen
- Versatile great room
- Front porch
Tags
Neighborhood map
What this means for you Summary
Snapshot
- This is a 4-bed/2.0-bath land listed at $351k.
Deal economics
- At list price, monthly cash flow is $-16 ($-198/yr) — negative.
- To cash-flow at today's rent, offer at most $348k (0.8% below list).
- To meet the 1% rule (rent ≥ 1% of price), the offer needs to be $283k (19.4% below list).
- Recommended offer: $283k (19.4% below list) — sets the bar for 1% rule.
- Cap rate 6.2% vs local median 4.7% in Ruskin — top-decile yield for the area; either an underpriced asset or a hidden risk that comps aren't pricing in. Stress-test before assuming the spread holds.
Location & tenants
- Location reads 71/100 on livability (#392 in FL) — a middle-class / working-renter tenant base. Strengths: cost of living A+, housing A+, commute B+; Watch: amenities F, health & safety F.
- Manatee (suburban): math 54% / reading 50% proficiency, ranked #26 of 73 in FL (top 36%) — acceptable for families but not a draw, mixed tenant base, ~2y average lease.
- Zoned schools: Barbara A Harvey Elementary School (math 74% / reading 59%, grade B+, #473 of 2,144 statewide, top 23%, 1,069 students, 33% FRL); Buffalo Creek Middle School (math 59% / reading 51%, grade B-, #180 of 571 statewide, top 32%, 1,127 students, 44% FRL); Parrish Community High School (math 47% / reading 57%, grade D+, #160 of 667 statewide, top 25%, 2,017 students, 32% FRL).
- Market conditions: Rents soft (-0.9%/yr); 2194 active listings in the ZIP; 17 comparable units currently listed for rent nearby; rentals at typical pace (median 18d on market — plan ~3-4 weeks tenant-placement turnaround); high-income renter base; 7,472 units permitted in Manatee County in 2024 (1,782 in 5+ unit buildings).
Forward outlook
- Local home prices are declining (-3.0%/yr); year-one equity from $2k of loan paydown is wiped out by about $11k of value loss. Plan a longer hold.
- Manatee County population projected at +43% by 2050 — long-run rental-demand tailwind backs the buy-and-hold thesis.
Negotiation context
- Only 11 days on market — expect competitive offers; lowballing is unlikely to land.
Risks & watch-outs
- Climate carrying-cost: major flood risk; severe wind risk, 99% chance of damaging wind over 30y; moderate wildfire risk; extreme-heat days projected 7→28/yr by 2055 (HVAC capex compounding) — expect insurance premiums to compound above CPI over the hold.
Questions for the listing agent
- What do current leases actually rent for vs. the listed asking? Can we see a recent rent roll and the last 12 months of T-12 income?
- What does the HOA fee cover, when was the last increase, and are there any pending special assessments or reserve-fund shortfalls?
- Is there a deadline driving the sale (1031 exchange, divorce, estate, relocation)? That informs how much negotiation room exists.
- Schools are F-rated, which usually means shorter tenancies and higher turnover. Who's the typical renter profile here, and what's been the actual vacancy rate?
- The area grade is low — what's the realistic commute time and amenity access for the typical tenant pool here? Any planned neighborhood developments (good or bad) we should know about?
- What's the average days-on-market for RENTAL listings here right now (not sales)? A rising rental-DOM trend means longer vacancies and softer asking-rent achievability than the comps imply.
- What's the recent tenant-quality profile in this submarket — average credit score on applications, eviction rate, late-payment / NSF rate, and stable-employment percentage? A property-management company in the area should have these aggregated.
- How much new for-sale + rental construction is in the pipeline within 1–3 miles? Heavy new supply typically softens prices + rents 12–24 months out; constrained supply supports both.
Investment metrics
- 1% rule
- 0.81% ✗
- Cap rate
- 6.24%
- Cash-on-cash
- -0.20%
- DSCR
- 0.99
- GRM
- 10.3
CMA / ARV
No comps found within radius.
Projected returns pro-forma
-3.0% appreciation · 0.0% rent growth · sell at horizon
- IRR
- -19.8%
- Equity multiple
- 0.33×
- Total profit
- $-66,284
- Equity at exit
- $52,334
- IRR
- -20.2%
- Equity multiple
- 0.07×
- Total profit
- $-91,384
- Equity at exit
- $30,347
Cash invested: $98,277 (down + closing). Projections, not guarantees.
Landlord ↔ Tenant lean methodology
- Overall (STATE)
- 87 Strongly Landlord-Friendly
- State Florida
- 87 Strongly Landlord-Friendly · R+3
- County
- — inherits STATE
- City
- — inherits STATE
ZIP-level market 34219
- Home prices YoY
- -23.7%
- Rents YoY
- -0.9%
- Active inventory
- 2194
- Price-to-rent
- 10.3×
Monthly cashflow live
- Estimated rent
- $2,830 high interval (Pro) →
- Mortgage (P&I)
- −$1,841
- Tax from tax record
- −$131 /mo · $1,566/yr
- Insurance
- −$146
- HOA
- −$135
- Vacancy / Maint / Mgmt
- −$594
- Net cashflow
- $-16
Break-even live
Sensitivity live
| Price | -10% $182 | -5% $83 | +0% $-16 | +5% $-116 | +10% $-215 |
|---|---|---|---|---|---|
| Rent | -10% $-240 | -5% $-128 | +0% $-16 | +5% $95 | +10% $207 |
| Rate | -1.0pp $160 | -0.5pp $73 | base $-16 | +0.5pp $-107 | +1.0pp $-200 |
UW: 25.0% down · 7.5% · 30yr · 1.5% tax · 5.0% vac · 8.0% maint · 8.0% mgmt
Financing live
Cash to close
- Down payment
- $87,748
- Closing costs
- $10,530
- Reserves months
- —
- Total cash needed
- —
Loan-product check · same deal, 3 products live
Conventional
25% down · 7.5% · 30yr
- Down + closing
- —
- Monthly P&I
- —
- Monthly cashflow
- —
- DSCR
- —
- Eligible?
- —
Personal DTI + credit; lowest rate.
DSCR
20% down · 8.5% · 30yr
- Down + closing
- —
- Monthly P&I
- —
- Monthly cashflow
- —
- DSCR
- —
- Eligible?
- —
No personal income docs; deal must DSCR.
Hard money
10% down · 12.0% · 12mo
- Down + closing
- —
- Monthly P&I
- —
- Monthly cashflow
- —
- DSCR
- —
- Eligible?
- —
Short-term bridge; refi at stabilization.
Rent comps 17 comps
| Address | Beds | Baths | Sqft | Rent | $/sqft | DOM | Units | Dist |
|---|---|---|---|---|---|---|---|---|
| 9928 Wimico Ter Parrish, FL | 3.0 | 2.0 | 1504 | $2,450 | $1.63 | 18d | 1 | 0.03mi |
| 10048 Big Marsh Ter Parrish, FL | 3.0 | 2.0 | 2034 | $2,825 | $1.39 | 25d | 1 | 0.39mi |
| 12067 Kingsley Trl Parrish, FL | 4.0 | 2.5 | 2045 | $2,495 | $1.22 | 5d | 1 | 0.54mi |
| 11884 Little River Way Parrish, FL | 3.0 | 2.5 | 2142 | $3,250 | $1.52 | 18d | 1 | 0.54mi |
| 11880 Little River Way Parrish, FL | 4.0 | 2.0 | 1635 | $2,650 | $1.62 | 25d | 1 | 0.54mi |
| 11512 Gallatin Trl Parrish, FL | 4.0 | 2.5 | 1929 | $3,300 | $1.71 | 25d | 1 | 0.58mi |
| 11454 Gallatin Trl Parrish, FL | 4.0 | 2.0 | 1635 | $2,575 | $1.57 | 18d | 1 | 0.61mi |
| 8522 Canyon Creek Trl Parrish, FL | 3.0 | 2.5 | 1822 | $2,000 | $1.10 | 25d | 1 | 1.00mi |
| 8423 Canyon Creek Trl Parrish, FL | 3.0 | 2.5 | 1823 | $2,400 | $1.32 | 25d | 1 | 1.00mi |
| 8443 Canyon Creek Trl Parrish, FL | 3.0 | 2.5 | 2178 | $2,000 | $0.92 | 25d | 1 | 1.01mi |
| 8544 Canyon Creek Trl Parrish, FL | 3.0 | 2.5 | 1822 | $2,300 | $1.26 | 13d | 1 | 1.01mi |
| 11567 84th Street Cir E #105 Parrish, FL | 3.0 | 2.5 | 1420 | $1,999 | $1.41 | 5d | 1 | 1.02mi |
| 11522 84th Street Cir E #105 Parrish, FL | 3.0 | 2.5 | 1588 | $2,300 | $1.45 | 25d | 1 | 1.08mi |
| 11523 84th Street Cir E #105 Parrish, FL | 3.0 | 2.5 | 1588 | $1,950 | $1.23 | 5d | 1 | 1.12mi |
| 8123 Trimbelle Ter Parrish, FL | 3.0 | 2.0 | 1722 | $2,850 | $1.66 | 18d | 1 | 1.16mi |
| 11230 82nd St E Parrish, FL | 3.0 | 2.0 | 1758 | $2,495 | $1.42 | 18d | 1 | 1.42mi |
| 12573 Oak Hill Way Parrish, FL | 3.0 | 2.0 | 1518 | $2,500 | $1.65 | 5d | 1 | 1.48mi |
HOA detail
- Monthly dues
- $135 · $1,620/yr
Listing history 2 events
-
2026-02-09status Pending
-
2026-01-29$350,990 Active
ⓘ Source: listings_history table (triggers on properties + properties_extension) + one-shot
backfill from property_details.listing_events for pre-trigger history.
Tax reassessment forecast FL · Resets to sale price
- Current annual tax
- $1,566 · $131/mo
- Projected year-2 tax
- $2,913 · $243/mo
- Expected delta
- +$1,347/yr (+$112/mo · 86.0%)
ⓘ Screening estimate from a state-policy table — verify with the county assessor before closing.
Climate risk First Street
- Flood 6/10 Major FEMA zone X (unshaded) · 68% chance over 30 yrs
- Wildfire 5/10 Major
- Heat 10/10 Extreme 7 d/yr ≥107°F today · 28 d/yr by 30 yrs out
- Wind 10/10 Extreme 99% chance of damaging wind over 30 yrs
- Air quality 3/10 Moderate 3 unhealthy d/yr today · 3 by 30 yrs out
Nearby sold comps map
Loading sold comps map…
Walkable amenities ~0.75 mi
Loading nearby amenities…
Taxation est. · year 1
- Rental income
- $33,963
- − Mortgage interest
- −$19,661
- − Property taxes
- −$1,566
- − Insurance
- −$1,755
- − Repairs & maintenance
- −$2,717
- − Management
- −$2,717
- − HOA
- −$1,620
- − Depreciation
- −$10,211
- Taxable loss
- −$6,284
- Est. tax savings @ 24.0%
- +$1,508
- After-tax cash flow
- $1,310/yr
For passive investors: Depreciation is non-cash, so a rental often shows a tax loss while cash-flowing — sheltering income. Rental losses are passive: they offset passive income freely, and up to $25,000/yr can offset ordinary (W-2) income if you actively participate and your MAGI is under $100k (phasing out to $0 by $150k); unused losses carry forward. On sale, claimed depreciation is recaptured at up to 25%, and gains may owe capital-gains tax (a 1031 exchange can defer both). Figures are a year-1 estimate at your 24.0% rate — not tax advice; consult a CPA.
Schools (NCES district)
- District
- Manatee
- NCES district ID
- 1201230
- Math proficiency
- 54% ▼ -6.00%
- Reading proficiency
- 50% ▼ -2.00%
- Median HH income
- $49,607
- Composite
- 44.43/100
- National rank
- #2806
- State rank
- #26 of 73 in FL
Livability — Ruskin
- Score
- 71/100
- State rank
- #392
- US rank
- #6879
Category grades
Schools grade is shown separately in the Schools card above.
Census & demographics
- County
- Manatee County · 416,364 people
- City population
- 52,177
- Metro
- North Port-Sarasota-Bradenton, FL
- Population (ZIP)
- 33,296
- Household income
- $113,773
- Rent vs Own
- Severe rent burden
- 219.0
Population outlook (Manatee County) Hauer SSP2
- Today (2025)
- 447,342 people
- By 2030
- 488,911 · +9.3%
- By 2040
- 567,934 · +27.0%
- By 2050
- 637,995 · +42.6%
- By 2075
- 781,970 · +74.8%
- By 2100
- 848,272 · +89.6%
Race, ethnicity, and origin ACS 2023
- Neighborhood character
- Predominantly White (75%)
- Race & ethnicity
- White 75% Hispanic / Latino 11% Two or more races 8% Black 8% Asian 2%
- Hispanic origin (detail)
- Mexican 2% Puerto Rican 3%
- Common ancestry
- Romanian 4% Hispanic 2% Russian 2%
- Foreign-born
- 10% · Canada, Dominican Republic, Jamaica
- Languages at home
- 88% English-only · Spanish 7% French/Haitian/Cajun 2% Other Asian/Pacific 1%
Political lean MEDSL · Manatee
- 2024 margin
- Strong R (+23.5) · D 37.9% · R 61.4%
- 2008→2024 swing
- -16.5pp toward R · 2008: -7.0pp · 2024: -23.5pp
- All cycles
- 2024: R+23.5 2020: R+16.1 2016: R+17.1 2012: R+12.5 2008: R+7.0
Not yet ingested
- Civics
- —
Market trends
- HPI YoY
- ▼ -84.45%
- Current HPI
- 271.7131
- Rent YoY
- ▼ -0.95%
- Metro
- North Port-Sarasota-Bradenton, FL
- State GDP YoY
- ▲ 3.28%
- F500 in state
- 36
Industry mix (Fortune 500 HQ in FL)
| Industry | F500 HQs | Revenue |
|---|---|---|
| Industrial Technology | 2 | $29B |
|
||
| Insurance | 2 | $17B |
|
||
| Retail | 1 | $60B |
|
||
| Technology Distribution | 1 | $58B |
|
||
| Homebuilding | 1 | $35B |
|
||
| Technology Manufacturing | 1 | $35B |
|
||
Price history
2 events — show timeline
- 2026-02-09 Pending — Stellar MLS as Distributed by MLS Grid
- 2026-01-29 Listed $350,990 Stellar MLS as Distributed by MLS Grid
Property tax history
+0.7%/yrLatest (2024): $1,566 · +0.7% YoY. Source: county tax records.
Cash-flow waterfall
monthlySold comps — $/sqft
last 12 mo · ≤1 miLoading sold comps…