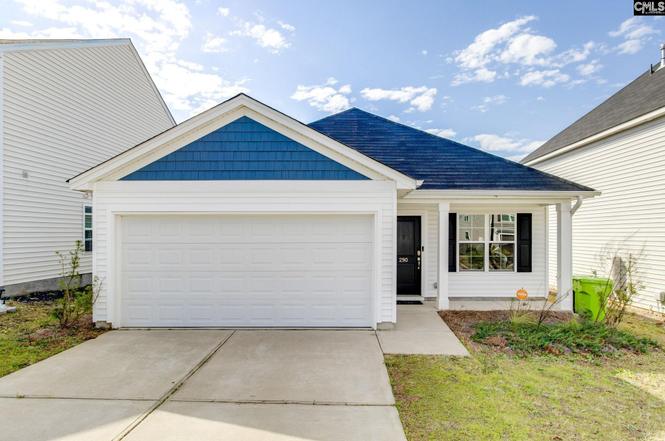
290 Windfall Rd · Blythewood, SC
Flood risk No data
- FEMA flood zone
- —
- Chance of flooding over 30 yrs
- —
- Est. flood insurance / yr
- —
Fire risk No data
- Est. fire insurance / yr
- —
Heat risk No data
- Hot days now (above threshold)
- —
- Hot days in 30 yrs
- —
Wind risk No data
- Chance of severe wind over 30 yrs
- —
Air-quality risk No data
- Unhealthy air days now
- —
- Unhealthy air days in 30 yrs
- —
Risk factors via First Street. Map © Google.
Why this score? — see what drove the F grade
The composite is a weighted blend of 9 inputs, each scored 0–100. Each bar is that input's sub-score; the figure is the points it added to the 100-point composite (weight × sub-score).
- Cash flow +12.2/30.0
- DSCR +3.6/10.0
- Schools +3.6/10.0
- 1% rule +3.5/10.0
- Livability +3.5/5.0
- Rent growth +2.5/5.0
- Condition / age +2.5/5.0
- ARV discount +0.0/15.0
- Appreciation +0.0/10.0
$281,000
🖨 Deal sheet 📄 Offer letter ✓ Due diligence
Listing remarks
Welcome to 290 Windfall Road — where comfort, space, and everyday functionality come together. This beautifully maintained home provides an inviting layout designed for both relaxed living and effortless entertaining. Step inside to discover light-filled living spaces, generous room sizes, and a seamless flow that makes this home feel both open and cozy. The kitchen serves as the heart of the home, featuring ample cabinetry and workspace—perfect for hosting gatherings or enjoying quiet family meals. The primary suite provides a peaceful retreat with plenty of space to unwind, while additional bedrooms provide flexibility for guests, a home office, or growing households. Outside,
Key facts
- Spacious yard
- Ample cabinetry
- 2 garage spots
Tags
Property features AI
Finance
- HOA & community: Property is part of an association
Exterior
- Parking: Attached 2-car garage
- Utilities: Public water; Public sewer
- Home design: Single-story home
- Construction: Slab foundation
- Exterior features: Vinyl exterior; Full wood privacy fence in rear (privacy fencing)
Interior
- Kitchen: Kitchen island; Granite countertops; Smooth-surface range; Microwave (above stove); Dishwasher; Garbage disposal
- Bedrooms: Main-level primary bedroom with double vanity, garden tub, freestanding tub, and walk-in closet; Secondary bedrooms with walk-in closets and ceiling fans (Jack-and-Jill bath configuration)
- Flooring: Luxury vinyl plank in main living areas; Carpet in bedrooms
- Bathrooms: Two full bathrooms
- Heating & cooling: Central heating; Central air conditioning
- Interior features: Vaulted ceilings in living area; Ceiling fans in living area and bedrooms; Luxury vinyl plank flooring in living area; Carpeted bedrooms; Gas log (natural) fireplace; Smooth-surface range; Island and granite countertops in the kitchen; Heated laundry space
- Laundry & utility: Washer and dryer included; Heated laundry space
Neighborhood map
What this means for you Summary
Snapshot
- This is a 3-bed/2.0-bath single-family listed at $281k.
Deal economics
- At list price, monthly cash flow is $-54 ($-650/yr) — negative.
- To cash-flow at today's rent, offer at most $273k (2.8% below list).
- To meet the 1% rule (rent ≥ 1% of price), the offer needs to be $239k (15.0% below list).
- Recommended offer: $239k (15.0% below list) — sets the bar for 1% rule.
Location & tenants
- Location reads 70/100 on livability (#58 in SC) — a middle-class / working-renter tenant base. Strengths: crime A+, employment A+, housing A+; Watch: amenities F, commute F, health & safety F.
- Richland 02 (suburban): math 35% / reading 47% proficiency, ranked #29 of 80 in SC (top 36%) — families likely to look elsewhere, expect single-tenant / working-renter base with shorter leases.
- Zoned schools: Langford Elementary (math 39% / reading 43%, grade F, #276 of 597 statewide, top 48%, 609 students, 64% FRL); Blythewood High (math 72% / reading 92%, grade A, #19 of 196 statewide, top 10%, 2,094 students, 39% FRL).
- Zoned-school proficiency averages 62% at this address vs 41% district-wide (+20 pts) — the actual schools serving this property are materially stronger than the Richland 02 average implies; a family-tenant draw the district grade alone would hide.
- Market conditions: 650 active listings in the ZIP; 3 comparable units currently listed for rent nearby; rentals at typical pace (median 24d on market — plan ~3-4 weeks tenant-placement turnaround); solid renter incomes; 3,472 units permitted in Richland County in 2024 (1,096 in 5+ unit buildings).
- This rent runs 30% of the median local income ($95k/yr) — at the standard rent-burdened threshold; future hikes will face affordability resistance.
Forward outlook
- Local home prices are declining (-3.0%/yr); year-one equity from $2k of loan paydown is wiped out by about $8k of value loss. Plan a longer hold.
- Richland County population projected at +30% by 2050 — long-run rental-demand tailwind backs the buy-and-hold thesis.
Negotiation context
- It's been on market 104 days — a 9% lower offer ($256k) is reasonable based on typical stale-listing flexibility.
- 3 sale attempts since 3y ago with the ask held roughly flat each time — persistent listings suggest the price (not the market) is what's stuck; bring a comps-based counter.
Questions for the listing agent
- What do current leases actually rent for vs. the listed asking? Can we see a recent rent roll and the last 12 months of T-12 income?
- It's been on market 104 days. Have you received any prior offers? Is the seller open to a 15% concession, seller financing, or rate buy-down credit?
- Why hasn't it sold? Are there any deal-killer items the seller is aware of (foundation, flood, title, zoning, code violations)?
- Is there a deadline driving the sale (1031 exchange, divorce, estate, relocation)? That informs how much negotiation room exists.
- Schools are B-rated — typically a magnet for longer-tenancy family renters. What's the average tenant stay here, and is there a school-zone premium baked into asking?
- The area grade is low — what's the realistic commute time and amenity access for the typical tenant pool here? Any planned neighborhood developments (good or bad) we should know about?
- What's the average days-on-market for RENTAL listings here right now (not sales)? A rising rental-DOM trend means longer vacancies and softer asking-rent achievability than the comps imply.
- What's the recent tenant-quality profile in this submarket — average credit score on applications, eviction rate, late-payment / NSF rate, and stable-employment percentage? A property-management company in the area should have these aggregated.
- How much new for-sale + rental construction is in the pipeline within 1–3 miles? Heavy new supply typically softens prices + rents 12–24 months out; constrained supply supports both.
Investment metrics
- 1% rule
- 0.85% ✗
- Cap rate
- 6.06%
- Cash-on-cash
- -0.83%
- DSCR
- 0.96
- GRM
- 9.8
CMA / ARV
- ARV (on-the-fly)
- $239,940
- Comps found
- 1
Show comp detail 1 sale within ~0.75 mi
| Address | Dist | Beds/Ba | Sqft | Sold | Price | $/sf | Match |
|---|---|---|---|---|---|---|---|
| 104 Potters View Rd | 0.62mi | 3/2.0 | 1,679 (+8%) | 13mo | $260,000 | $155 | 46 |
Match score weights: distance 35% · size 25% · config 20% · recency 20%. Top-matched comps best support the ARV.
Projected returns pro-forma
-3.0% appreciation · 3.0% rent growth · sell at horizon
- IRR
- -17.6%
- Equity multiple
- 0.38×
- Total profit
- $-48,949
- Equity at exit
- $41,898
- IRR
- -9.7%
- Equity multiple
- 0.40×
- Total profit
- $-46,922
- Equity at exit
- $24,296
Cash invested: $78,680 (down + closing). Projections, not guarantees.
Landlord ↔ Tenant lean methodology
- Overall (STATE)
- 90 Strongly Landlord-Friendly
- State South Carolina
- 90 Strongly Landlord-Friendly · R+6
- County
- — inherits STATE
- City
- — inherits STATE
ZIP-level market 29016
- Home prices YoY
- -26.3%
- Active inventory
- 650
- Price-to-rent
- 9.8×
Monthly cashflow live
- Estimated rent
- $2,390 medium interval (Pro) →
- Mortgage (P&I)
- −$1,474
- Tax est. 1.5%
- −$351 /mo · $4,215/yr
- Insurance
- −$117
- HOA
- −$0
- Vacancy / Maint / Mgmt
- −$502
- Net cashflow
- $-54
Break-even live
UW: 25.0% down · 7.5% · 30yr · 1.5% tax · 5.0% vac · 8.0% maint · 8.0% mgmt
Financing live
Cash to close
- Down payment
- $70,250
- Closing costs
- $8,430
- Reserves months
- —
- Total cash needed
- —
Loan-product check · same deal, 3 products live
Conventional
25% down · 7.5% · 30yr
- Down + closing
- —
- Monthly P&I
- —
- Monthly cashflow
- —
- DSCR
- —
- Eligible?
- —
Personal DTI + credit; lowest rate.
DSCR
20% down · 8.5% · 30yr
- Down + closing
- —
- Monthly P&I
- —
- Monthly cashflow
- —
- DSCR
- —
- Eligible?
- —
No personal income docs; deal must DSCR.
Hard money
10% down · 12.0% · 12mo
- Down + closing
- —
- Monthly P&I
- —
- Monthly cashflow
- —
- DSCR
- —
- Eligible?
- —
Short-term bridge; refi at stabilization.
Rent comps 3 comps
| Address | Beds | Baths | Sqft | Rent | $/sqft | DOM | Units | Dist |
|---|---|---|---|---|---|---|---|---|
| 312 Joshua Tree Ct Blythewood, SC | 3.0 | 2.5 | 1731 | $1,945 | $1.12 | 23d | 1 | 0.29mi |
| 562 Vintage Pine Dr Blythewood, SC | 3.0 | 2.0 | 1814 | $2,195 | $1.21 | 23d | 1 | 0.31mi |
| 61 Bluebead Ct Columbia, SC | 4.0 | 2.0 | 1515 | $2,249 | $1.48 | 3d | 1 | 1.44mi |
Listing history 22 events
-
2026-06-18days on market $281,000 Active 104 DOM
-
2026-06-17days on market $281,000 Active 103 DOM
-
2026-06-16days on market $281,000 Active 102 DOM
-
2026-06-15days on market $281,000 Active 101 DOM
-
2026-06-14days on market $281,000 Active 99 DOM
-
2026-06-13days on market $281,000 Active 98 DOM
-
2026-06-10days on market $281,000 Active 96 DOM
-
2026-06-09days on market $281,000 Active 95 DOM
-
2026-06-08days on market $281,000 Active 94 DOM
-
2026-06-07days on market $281,000 Active 93 DOM
-
2026-06-05days on market $281,000 Active 90 DOM
-
2026-06-03days on market $281,000 Active 89 DOM
-
2026-06-03days on market $281,000 Active 88 DOM
-
2026-06-01days on market $281,000 Active 87 DOM
-
2026-05-31days on market $281,000 Active 86 DOM
-
2026-05-12price $281,000
-
2026-03-07$286,000 Active
-
2023-11-15status Pending
-
2023-10-03status Active
-
2023-09-20status Pending
-
2023-09-01price $255,000
-
2023-08-16$265,000 Active
ⓘ Source: listings_history table (triggers on properties + properties_extension) + one-shot
backfill from property_details.listing_events for pre-trigger history.
Nearby sold comps map
Loading sold comps map…
Walkable amenities ~0.75 mi
Loading nearby amenities…
Taxation est. · year 1
- Rental income
- $28,674
- − Mortgage interest
- −$15,740
- − Property taxes
- −$4,215
- − Insurance
- −$1,405
- − Repairs & maintenance
- −$2,294
- − Management
- −$2,294
- − Depreciation
- −$8,175
- Taxable loss
- −$5,448
- Est. tax savings @ 24.0%
- +$1,308
- After-tax cash flow
- $657/yr
For passive investors: Depreciation is non-cash, so a rental often shows a tax loss while cash-flowing — sheltering income. Rental losses are passive: they offset passive income freely, and up to $25,000/yr can offset ordinary (W-2) income if you actively participate and your MAGI is under $100k (phasing out to $0 by $150k); unused losses carry forward. On sale, claimed depreciation is recaptured at up to 25%, and gains may owe capital-gains tax (a 1031 exchange can defer both). Figures are a year-1 estimate at your 24.0% rate — not tax advice; consult a CPA.
Schools (NCES district)
- District
- Richland 02
- NCES district ID
- 4503390
- Math proficiency
- 35% ▼ -15.00%
- Reading proficiency
- 47% ▼ -5.00%
- Median HH income
- $59,684
- Composite
- 36.2/100
- National rank
- #4730
- State rank
- #29 of 80 in SC
Livability — Blythewood
- Score
- 70/100
- State rank
- #58
- US rank
- #7406
Category grades
Schools grade is shown separately in the Schools card above.
Census & demographics
- County
- Richland County · 389,530 people
- City population
- 30,454
- Metro
- Columbia, SC
- Population (ZIP)
- 30,454
- Household income
- $95,082
- Rent vs Own
- Severe rent burden
- 559.0
Population outlook (Richland County) Hauer SSP2
- Today (2025)
- 459,667 people
- By 2030
- 487,524 · +6.1%
- By 2040
- 542,035 · +17.9%
- By 2050
- 595,371 · +29.5%
- By 2075
- 732,998 · +59.5%
- By 2100
- 820,415 · +78.5%
Race, ethnicity, and origin ACS 2023
- Neighborhood character
- Diverse neighborhood (Simpson 0.64)
- Race & ethnicity
- Black 43% White 42% Two or more races 7% Hispanic / Latino 7% Asian 3%
- Hispanic origin (detail)
- Mexican 1% Puerto Rican 2%
- Common ancestry
- Lithuanian 2% Romanian 2% Slovak 2%
- Foreign-born
- 5% · Canada, China
- Languages at home
- 90% English-only · Spanish 5% Other Indo-European 1% German/W. Germanic 1%
Political lean MEDSL · Richland
- 2024 margin
- Solid D (+34.6) · D 66.4% · R 31.8% · Other 1.8%
- 2008→2024 swing
- +5.7pp toward D · 2008: 28.9pp · 2024: 34.6pp
- All cycles
- 2024: D+34.6 2020: D+38.3 2016: D+32.9 2012: D+33.3 2008: D+28.9
Not yet ingested
- Civics
- —
Market trends
- HPI YoY
- ▼ -65.48%
- Current HPI
- 183.5933
- Rent YoY
- —
- Metro
- Columbia, SC
- State GDP YoY
- ▲ 4.51%
- F500 in state
- 2
Industry mix (Fortune 500 HQ in SC)
| Industry | F500 HQs | Revenue |
|---|---|---|
| Packaging | 1 | $7B |
|
||
Price history
+6.0% since first listed7 events — show timeline
- 2026-05-12 Price Changed $281,000 Consolidated MLS
- 2026-03-07 Listed $286,000 Consolidated MLS
- 2023-11-15 Pending — Consolidated MLS
- 2023-10-03 Relisted — Consolidated MLS
- 2023-09-20 Pending — Consolidated MLS
- 2023-09-01 Price Changed $255,000 Consolidated MLS
- 2023-08-16 Listed $265,000 Consolidated MLS
Cash-flow waterfall
monthlySold comps — $/sqft
last 12 mo · ≤1 miLoading sold comps…