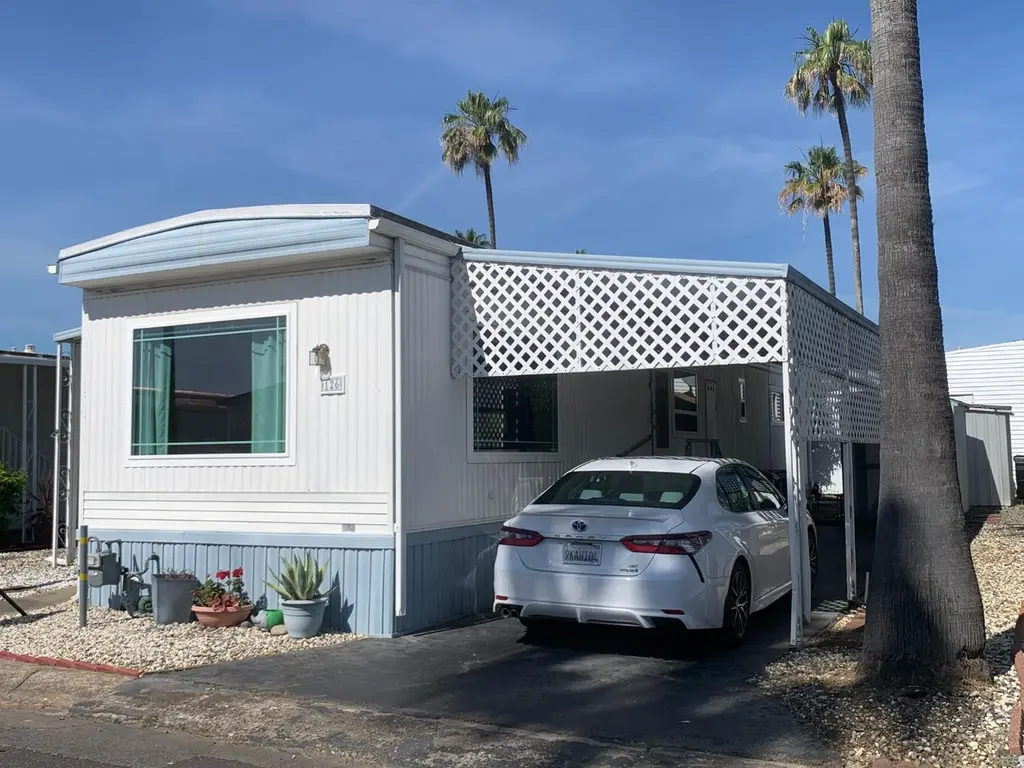
8181 Folsom Blvd #126 · Sacramento, CA
Flood risk 1/10 · Minimal
- FEMA flood zone
- X
- Chance of flooding over 30 yrs
- 0.0%
- Est. flood insurance / yr
- $507 – $1,088
Fire risk 2/10 · Minimal
- Est. fire insurance / yr
- $659 – $1,223
Heat risk 7/10 · Major
- Hot days now (above 102°F)
- 7 days/yr
- Hot days in 30 yrs
- 14 days/yr
Wind risk 1/10 · Minimal
- Chance of severe wind over 30 yrs
- —
Air-quality risk 10/10 · Severe
- Unhealthy air days now
- 28 days/yr
- Unhealthy air days in 30 yrs
- 33 days/yr
Risk factors via First Street. Map © Google.
Why this score? — see what drove the B+ grade
The composite is a weighted blend of 9 inputs, each scored 0–100. Each bar is that input's sub-score; the figure is the points it added to the 100-point composite (weight × sub-score).
- Cash flow +30.0/30.0
- ARV discount +15.0/15.0
- 1% rule +10.0/10.0
- DSCR +10.0/10.0
- Livability +3.6/5.0
- Schools +3.5/10.0
- Condition / age +2.5/5.0
- Rent growth +2.4/5.0
- Appreciation +0.0/10.0
$52,500
🖨 Deal sheet (PDF) 📄 Offer letter ✓ Due diligence
Listing remarks
BRING YOUR PAJAMAS! This is a perfect little 1 bedroom, 1 bath home that has been upgraded! Dual pane windows & laminate flooring. Home is partially furnished and well cared for which means it's move-in ready! Termite inspection completed as well. Senior 55+ gated park with active parties, food give aways & bingo!
Key facts
- Partially furnished
- Laminate flooring
- Dual pane windows
Tags
Neighborhood map
What this means for you Summary
Snapshot
- This is a 1-bed/1.0-bath manufactured listed at $52k.
Deal economics
- At list price, monthly cash flow is $819 ($10k/yr) — positive.
- The deal already cash-flows at list — no discount required.
- Meets the 1% rule at list price ($1k rent vs $52k).
- Recommended offer: $46k (12.0% below list) — sets the bar for market timing.
- Cap rate 25.0% vs local median 3.0% in Sacramento — top-decile yield for the area; either an underpriced asset or a hidden risk that comps aren't pricing in. Stress-test before assuming the spread holds.
Location & tenants
- Location reads 71/100 on livability (#218 in CA) — a middle-class / working-renter tenant base. Strengths: amenities A+, commute A+, housing A; Watch: schools D+, crime F, cost of living F.
- Sacramento City Unified (urban): math 32% / reading 43% proficiency, ranked #804 of 1,400 in CA (top 57%) — families likely to look elsewhere, expect single-tenant / working-renter base with shorter leases; 63% free/reduced lunch — lower-income household profile, screen leases tightly.
- Market conditions: Rents soft (-0.3%/yr); 125 active listings in the ZIP; 7 comparable units currently listed for rent nearby; rentals leasing fast (median 4d on market — plan ~1-2 weeks tenant-placement turnaround); solid renter incomes; 6,825 units permitted in Sacramento County in 2024 (1,752 in 5+ unit buildings).
Forward outlook
- Local home prices are declining (-3.0%/yr); year-one equity from $363 of loan paydown is wiped out by about $2k of value loss. Plan a longer hold.
- Sacramento County population projected at +17% by 2050 — long-run rental-demand tailwind backs the buy-and-hold thesis.
- At projected returns (-3.0% appreciation + 0.0% rent growth), your $15k cash investment doubles in ~2 years — after that, you're playing with house money.
Negotiation context
- It's been on market 166 days — a 12% lower offer ($46k) is reasonable based on typical stale-listing flexibility.
Risks & watch-outs
- Climate carrying-cost: extreme-heat days projected 7→14/yr by 2055 (HVAC capex compounding) — expect insurance premiums to compound above CPI over the hold.
Questions for the listing agent
- It's been on market 166 days. Have you received any prior offers? Is the seller open to a 12% concession, seller financing, or rate buy-down credit?
- Built in 1968 — when were the roof, HVAC, electrical panel, plumbing, and water heater last replaced?
- Why hasn't it sold? Are there any deal-killer items the seller is aware of (foundation, flood, title, zoning, code violations)?
- Is there a deadline driving the sale (1031 exchange, divorce, estate, relocation)? That informs how much negotiation room exists.
- Schools are D-rated, which usually means shorter tenancies and higher turnover. Who's the typical renter profile here, and what's been the actual vacancy rate?
- Crime grade is F in this area — have there been break-ins, vandalism, or insurance claims at this property in the last 3 years? What carrier currently insures it and at what premium?
- What's the average days-on-market for RENTAL listings here right now (not sales)? A rising rental-DOM trend means longer vacancies and softer asking-rent achievability than the comps imply.
- What's the recent tenant-quality profile in this submarket — average credit score on applications, eviction rate, late-payment / NSF rate, and stable-employment percentage? A property-management company in the area should have these aggregated.
- How much new for-sale + rental construction is in the pipeline within 1–3 miles? Heavy new supply typically softens prices + rents 12–24 months out; constrained supply supports both.
Investment metrics
- 1% rule
- 2.85% ✓
- Cap rate
- 25.01%
- Cash-on-cash
- 66.85%
- DSCR
- 3.97
- GRM
- 2.9
CMA / ARV
- ARV (median comp)
- $67,000
- List price
- $52,500
- Delta
- -21.64%
- Verdict
- UNDERPRICED
- Comps
- 3 within 1.0 mi
Projected returns pro-forma
-3.0% appreciation · 0.0% rent growth · sell at horizon
- IRR
- 62.7%
- Equity multiple
- 3.67×
- Total profit
- $39,287
- Equity at exit
- $7,828
- IRR
- 66.2%
- Equity multiple
- 6.75×
- Total profit
- $84,519
- Equity at exit
- $4,539
Cash invested: $14,700 (down + closing). Projections, not guarantees.
Landlord ↔ Tenant lean methodology
- Overall (STATE)
- 18 Strongly Tenant-Friendly
- State California
- 18 Strongly Tenant-Friendly · D+13
- County
- — inherits STATE
- City
- — inherits STATE
ZIP-level market 95826
- Rents YoY
- -0.3%
- Active inventory
- 125
- Price-to-rent
- 2.9×
Monthly cashflow live
- Estimated rent
- $1,496 high interval (Pro) →
- Mortgage (P&I)
- −$275
- Tax est. 1.5%
- −$66 /mo · $788/yr
- Insurance
- −$22
- HOA
- −$0
- Vacancy / Maint / Mgmt
- −$314
- Net cashflow
- $819
Break-even live
Sensitivity live
| Price | -10% $855 | -5% $837 | +0% $819 | +5% $801 | +10% $783 |
|---|---|---|---|---|---|
| Rent | -10% $701 | -5% $760 | +0% $819 | +5% $878 | +10% $937 |
| Rate | -1.0pp $845 | -0.5pp $832 | base $819 | +0.5pp $805 | +1.0pp $791 |
UW: 25.0% down · 7.5% · 30yr · 1.5% tax · 5.0% vac · 8.0% maint · 8.0% mgmt
Financing live
Cash to close
- Down payment
- $13,125
- Closing costs
- $1,575
- Reserves months
- —
- Total cash needed
- —
Loan-product check · same deal, 3 products live
Conventional
25% down · 7.5% · 30yr
- Down + closing
- —
- Monthly P&I
- —
- Monthly cashflow
- —
- DSCR
- —
- Eligible?
- —
Personal DTI + credit; lowest rate.
DSCR
20% down · 8.5% · 30yr
- Down + closing
- —
- Monthly P&I
- —
- Monthly cashflow
- —
- DSCR
- —
- Eligible?
- —
No personal income docs; deal must DSCR.
Hard money
10% down · 12.0% · 12mo
- Down + closing
- —
- Monthly P&I
- —
- Monthly cashflow
- —
- DSCR
- —
- Eligible?
- —
Short-term bridge; refi at stabilization.
Rent comps 7 comps
| Address | Beds | Baths | Sqft | Rent | $/sqft | DOM | Units | Dist |
|---|---|---|---|---|---|---|---|---|
| 3099 Great Falls Way Sacramento, CA | 1.0 | 1.0 | 600 | $1,275 | $2.12 | 3d | 1 | 0.34mi |
| 200 Bicentennial Cir Sacramento, CA | 1.0–3.0 | 1.0–2.0 | 937 | $1,599 | $1.71 | 0d | 29 | 0.40mi |
| 7928 La Riviera Dr Sacramento, CA | 1.0 | 1.0 | 704 | $1,675 | $2.38 | 5d | 3 | 0.60mi |
| 7901 La Riviera Dr Sacramento, CA | 1.0–3.0 | 1.0–2.0 | 881 | $1,425 | $1.62 | 0d | 5 | 0.87mi |
| 2920 Ramona Ave Sacramento, CA | 1.0–4.0 | 1.0–4.0 | 1000 | $1,919 | $1.92 | 9d | 1 | 1.01mi |
| 2366 American River Dr Sacramento, CA | 1.0–2.0 | 1.0 | 825 | $1,500 | $1.82 | 45d | 1 | 1.32mi |
| 1500 67th St Sacramento, CA | 1.0–5.0 | 1.0–5.0 | 1035 | $599 | $0.58 | 3d | 60 | 1.49mi |
Listing history 15 events
-
2026-06-21days on market $52,500 Active 166 DOM
-
2026-06-18days on market $52,500 Active 163 DOM
-
2026-06-17days on market $52,500 Active 162 DOM
-
2026-06-16days on market $52,500 Active 161 DOM
-
2026-06-15days on market $52,500 Active 160 DOM
-
2026-06-13days on market $52,500 Active 158 DOM
-
2026-06-13days on market $52,500 Active 157 DOM
-
2026-06-09days on market $52,500 Active 154 DOM
-
2026-06-08days on market $52,500 Active 153 DOM
-
2026-06-07days on market $52,500 Active 152 DOM
-
2026-06-05days on market $52,500 Active 149 DOM
-
2026-06-03days on market $52,500 Active 148 DOM
-
2026-06-02days on market $52,500 Active 147 DOM
-
2026-06-01days on market $52,500 Active 146 DOM
-
2026-05-31days on market $52,500 Active 145 DOM
ⓘ Source: listings_history table (triggers on properties + properties_extension) + one-shot
backfill from property_details.listing_events for pre-trigger history.
Climate risk First Street
- Flood 1/10 Low FEMA zone X · 0% chance over 30 yrs
- Wildfire 2/10 Low
- Heat 7/10 Severe 7 d/yr ≥102°F today · 14 d/yr by 30 yrs out
- Wind 1/10 Low
- Air quality 10/10 Extreme 28 unhealthy d/yr today · 33 by 30 yrs out
Nearby sold comps map
Loading sold comps map…
Walkable amenities ~0.75 mi
Loading nearby amenities…
Taxation est. · year 1
- Rental income
- $17,950
- − Mortgage interest
- −$2,941
- − Property taxes
- −$788
- − Insurance
- −$262
- − Repairs & maintenance
- −$1,436
- − Management
- −$1,436
- − Depreciation
- −$1,527
- Taxable income
- $9,560
- Est. tax owed @ 24.0%
- −$2,294
- After-tax cash flow
- $7,532/yr
For passive investors: Depreciation is non-cash, so a rental often shows a tax loss while cash-flowing — sheltering income. Rental losses are passive: they offset passive income freely, and up to $25,000/yr can offset ordinary (W-2) income if you actively participate and your MAGI is under $100k (phasing out to $0 by $150k); unused losses carry forward. On sale, claimed depreciation is recaptured at up to 25%, and gains may owe capital-gains tax (a 1031 exchange can defer both). Figures are a year-1 estimate at your 24.0% rate — not tax advice; consult a CPA.
Schools (NCES district)
- District
- Sacramento City Unified
- NCES district ID
- 0633840
- Math proficiency
- 32% ▬ 0.00%
- Reading proficiency
- 43% ▲ 3.00%
- Median HH income
- $49,280
- Composite
- 34.86/100
- National rank
- #10000
- State rank
- #804 of 1400 in CA
Livability — Sacramento
- Score
- 71/100
- State rank
- #218
- US rank
- #6957
Category grades
Schools grade is shown separately in the Schools card above.
Census & demographics
- Census place
- Sacramento, CA
- County
- Sacramento County · 1,539,646 people
- City population
- 761,410
- Metro
- Sacramento-Roseville-Folsom, CA
- Population (ZIP)
- 40,165
- Household income
- $82,127
- Rent vs Own
- Severe rent burden
- 2433.0
Population outlook (Sacramento County) Hauer SSP2
- Today (2025)
- 1,660,763 people
- By 2030
- 1,732,990 · +4.3%
- By 2040
- 1,855,755 · +11.7%
- By 2050
- 1,941,335 · +16.9%
- By 2075
- 2,046,162 · +23.2%
- By 2100
- 1,961,444 · +18.1%
Race, ethnicity, and origin ACS 2023
- Neighborhood character
- Highly diverse neighborhood (Simpson 0.70)
- Race & ethnicity
- White 47% Hispanic / Latino 23% Two or more races 14% Black 11% Asian 11%
- Hispanic origin (detail)
- Mexican 18%
- Common ancestry
- Italian 3% Subsaharan African 2% Russian 2%
- Foreign-born
- 15% · Canada, South Korea, China
- Languages at home
- 75% English-only · Spanish 11% Other Indo-European 4% Russian/Polish/Slavic 2%
Political lean MEDSL · Sacramento
- 2024 margin
- D (+19.7) · D 58.1% · R 38.4% · Other 3.5%
- 2008→2024 swing
- +0.7pp no change · 2008: 19.0pp · 2024: 19.7pp
- All cycles
- 2024: D+19.7 2020: D+25.3 2016: D+23.7 2012: D+16.3 2008: D+19.0
Not yet ingested
- Civics
- —
Market trends
- HPI YoY
- ▼ -408.80%
- Current HPI
- 325.179
- Rent YoY
- ▼ -0.33%
- Metro
- Sacramento-Roseville-Folsom, CA
- State GDP YoY
- ▲ 3.21%
- F500 in state
- 116
Industry mix (Fortune 500 HQ in CA)
| Industry | F500 HQs | Revenue |
|---|---|---|
| Technology | 27 | $1,492B |
|
||
| Financial Services | 3 | $174B |
|
||
| Retail | 3 | $44B |
|
||
| Insurance | 3 | $26B |
|
||
| Media / Entertainment | 2 | $115B |
|
||
| Pharmaceuticals / Biotech | 2 | $62B |
|
||
Cash-flow waterfall
monthlySold comps — $/sqft
last 12 mo · ≤1 miLoading sold comps…