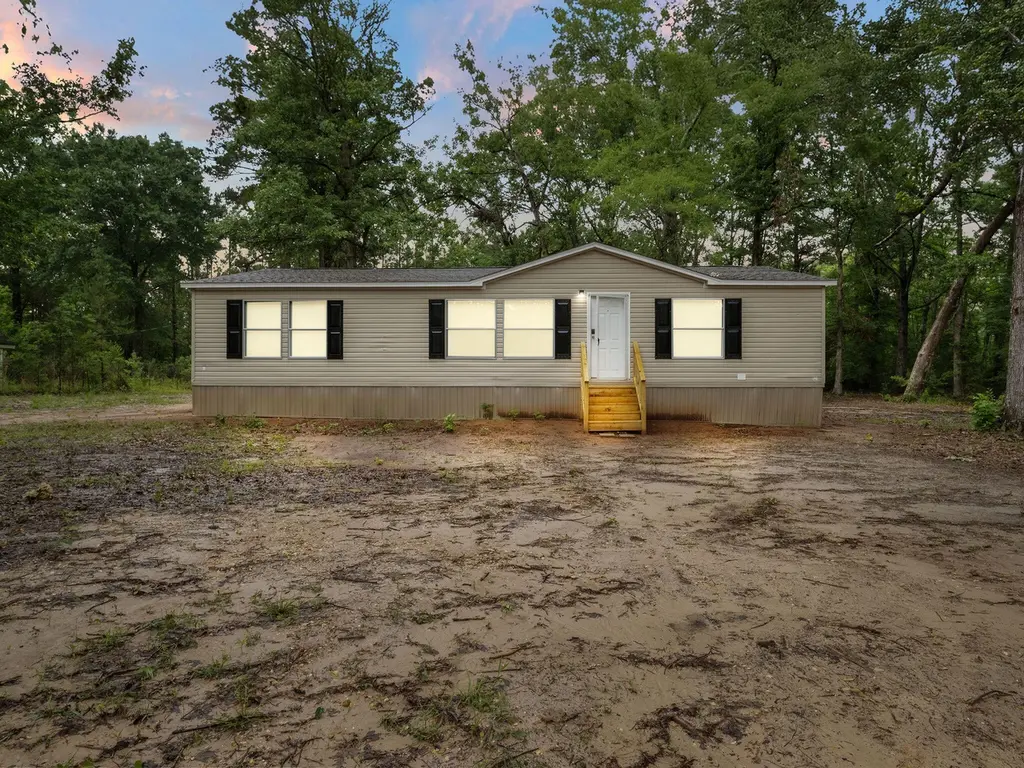
314 Jackson · Leesville, LA
Flood risk No data
- FEMA flood zone
- —
- Chance of flooding over 30 yrs
- —
- Est. flood insurance / yr
- —
Fire risk No data
- Est. fire insurance / yr
- —
Heat risk No data
- Hot days now (above threshold)
- —
- Hot days in 30 yrs
- —
Wind risk No data
- Chance of severe wind over 30 yrs
- —
Air-quality risk No data
- Unhealthy air days now
- —
- Unhealthy air days in 30 yrs
- —
Risk factors via First Street. Map © Google.
Why this score? — see what drove the D- grade
The composite is a weighted blend of 9 inputs, each scored 0–100. Each bar is that input's sub-score; the figure is the points it added to the 100-point composite (weight × sub-score).
- Cash flow +11.1/30.0
- ARV discount +6.2/15.0
- Rent growth +4.9/5.0
- Condition / age +3.8/5.0
- Livability +3.7/5.0
- Schools +3.6/10.0
- 1% rule +3.2/10.0
- DSCR +3.2/10.0
- Appreciation +0.0/10.0
$159,700
🖨 Deal sheet (PDF) 📄 Offer letter ✓ Due diligence
Listing remarks
Welcome to peaceful country living with the convenience of town just minutes away! Nestled beneath beautiful mature shade trees, this charming property at 314 Jackson Road in Leesville offers the perfect blend of privacy, comfort, and location.
Key facts
- Privacy
- Country living
- Mature shade trees
Tags
Property features AI
Finance
- Other: Directions: From ERA Sarver Real Estate in Leesville, take Hwy 171 South, turn onto Jackson Road, and continue to 314 Jackson Road
Exterior
- Home design: Single-family residence; Single-story
- Exterior features: 1.5-acre lot; Residential zoning; Peaceful country setting a few minutes from city limits
Interior
- Bathrooms: Two full bathrooms
- Interior features: Seven total rooms
Neighborhood map
What this means for you Summary
Snapshot
- This is a 3-bed/2.0-bath single-family listed at $160k. Condition is rated good.
Deal economics
- At list price, monthly cash flow is $-63 ($-757/yr) — negative.
- To cash-flow at today's rent, offer at most $151k (5.7% below list).
- To meet the 1% rule (rent ≥ 1% of price), the offer needs to be $132k (17.5% below list).
- Recommended offer: $132k (17.5% below list) — sets the bar for 1% rule.
- Cap rate 5.8% vs local median 7.3% in Leesville — below-typical yield; the buyer is paying a premium for something (appreciation thesis, condition, location) that the cap rate doesn't capture.
Location & tenants
- Location reads 73/100 on livability (#30 in LA) — a middle-class / working-renter tenant base. Strengths: cost of living A+, health & safety A+, housing A; Watch: crime F, amenities F, commute F.
- Vernon Parish (rural): math 35% / reading 51% proficiency, ranked #18 of 98 in LA (top 18%) — families likely to look elsewhere, expect single-tenant / working-renter base with shorter leases.
- Zoned schools: Rosepine Elementary School (math 25% / reading 50%, grade F, #247 of 646 statewide, top 39%, 830 students, 55% FRL); Vernon Middle School (math 30% / reading 41%, grade F, #91 of 218 statewide, top 42%, 477 students, 60% FRL); Leesville High School (math 32% / reading 54%, grade F, #66 of 265 statewide, top 25%, 884 students, 47% FRL).
- Market conditions: Rents rising fast (+9.6%/yr); 210 active listings in the ZIP; 5 comparable units currently listed for rent nearby; rentals lingering (median 45d on market — plan ~5-8 weeks vacancy on turnover, expect pricing pressure); 100% of comp listings sitting > 30 days — soft ceiling on asking rent; 26 units permitted in Vernon Parish in 2024 (0 in 5+ unit buildings).
Forward outlook
- Local home prices are declining (-3.0%/yr); year-one equity from $1k of loan paydown is wiped out by about $5k of value loss. Plan a longer hold.
- Vernon County population projected at -25% by 2050 — secular population decline; favor cash flow + early exit over multi-decade hold.
Negotiation context
- Only 6 days on market — expect competitive offers; lowballing is unlikely to land.
Questions for the listing agent
- What do current leases actually rent for vs. the listed asking? Can we see a recent rent roll and the last 12 months of T-12 income?
- Is there a deadline driving the sale (1031 exchange, divorce, estate, relocation)? That informs how much negotiation room exists.
- Schools are B-rated — typically a magnet for longer-tenancy family renters. What's the average tenant stay here, and is there a school-zone premium baked into asking?
- Crime grade is F in this area — have there been break-ins, vandalism, or insurance claims at this property in the last 3 years? What carrier currently insures it and at what premium?
- The area grade is low — what's the realistic commute time and amenity access for the typical tenant pool here? Any planned neighborhood developments (good or bad) we should know about?
- What's the average days-on-market for RENTAL listings here right now (not sales)? A rising rental-DOM trend means longer vacancies and softer asking-rent achievability than the comps imply.
- What's the recent tenant-quality profile in this submarket — average credit score on applications, eviction rate, late-payment / NSF rate, and stable-employment percentage? A property-management company in the area should have these aggregated.
- How much new for-sale + rental construction is in the pipeline within 1–3 miles? Heavy new supply typically softens prices + rents 12–24 months out; constrained supply supports both.
Investment metrics
- 1% rule
- 0.82% ✗
- Cap rate
- 5.82%
- Cash-on-cash
- -1.69%
- DSCR
- 0.92
- GRM
- 10.1
CMA / ARV
- ARV (on-the-fly)
- $155,136
- Comps found
- 8
Show comp detail 8 sales within ~0.75 mi
| Address | Dist | Beds/Ba | Sqft | Sold | Price | $/sf | Match |
|---|---|---|---|---|---|---|---|
| 303 N Prairie St | 0.08mi | 3/2.0 | 1,556 (+1%) | 2mo | $165,000 | $106 | 92 |
| 1007 W Union St | 0.06mi | 3/1.5 | 1,353 (-12%) | 2mo | $140,000 | $103 | 74 |
| 1005 W Union St | 0.07mi | 4/2.0 (+1) | 1,695 (+10%) | 2mo | $149,000 | $88 | 73 |
| 907 Dennis Ave | 0.67mi | 3/1.0 | 1,449 (-6%) | 6mo | $70,000 | $48 | 50 |
| 802 Dennis Ave | 0.54mi | 3/4.0 | 1,725 (+12%) | 2mo | $140,000 | $81 | 45 |
| 913 Dennis Ave | 0.70mi | 4/2.0 (+1) | 1,557 (+1%) | 22mo | $157,500 | $101 | 42 |
| 1301 Maple St | 0.75mi | 3/1.5 | 1,514 (-1%) | 24mo | $145,000 | $96 | 41 |
| 100 E Lee St | 0.72mi | 3/2.0 | 1,684 (+10%) | 19mo | $192,500 | $114 | 35 |
Match score weights: distance 35% · size 25% · config 20% · recency 20%. Top-matched comps best support the ARV.
Projected returns pro-forma
-3.0% appreciation · 8.0% rent growth · sell at horizon
- IRR
- -13.6%
- Equity multiple
- 0.49×
- Total profit
- $-22,914
- Equity at exit
- $23,812
- IRR
- 1.7%
- Equity multiple
- 1.15×
- Total profit
- $6,639
- Equity at exit
- $13,808
Cash invested: $44,716 (down + closing). Projections, not guarantees.
Landlord ↔ Tenant lean methodology
- Overall (STATE)
- 90 Strongly Landlord-Friendly
- State Louisiana
- 90 Strongly Landlord-Friendly · R+12
- County
- — inherits STATE
- City
- — inherits STATE
ZIP-level market 71446
- Home prices YoY
- -32.1%
- Rents YoY
- 9.6%
- Active inventory
- 210
- Price-to-rent
- 10.1×
Monthly cashflow live
- Estimated rent
- $1,317 high interval (Pro) →
- Mortgage (P&I)
- −$837
- Tax est. 1.5%
- −$200 /mo · $2,396/yr
- Insurance
- −$67
- HOA
- −$0
- Vacancy / Maint / Mgmt
- −$277
- Net cashflow
- $-63
Break-even live
Sensitivity live
| Price | -10% $47 | -5% $-8 | +0% $-63 | +5% $-118 | +10% $-173 |
|---|---|---|---|---|---|
| Rent | -10% $-167 | -5% $-115 | +0% $-63 | +5% $-11 | +10% $41 |
| Rate | -1.0pp $17 | -0.5pp $-22 | base $-63 | +0.5pp $-104 | +1.0pp $-147 |
UW: 25.0% down · 7.5% · 30yr · 1.5% tax · 5.0% vac · 8.0% maint · 8.0% mgmt
Financing live
Cash to close
- Down payment
- $39,925
- Closing costs
- $4,791
- Reserves months
- —
- Total cash needed
- —
Loan-product check · same deal, 3 products live
Conventional
25% down · 7.5% · 30yr
- Down + closing
- —
- Monthly P&I
- —
- Monthly cashflow
- —
- DSCR
- —
- Eligible?
- —
Personal DTI + credit; lowest rate.
DSCR
20% down · 8.5% · 30yr
- Down + closing
- —
- Monthly P&I
- —
- Monthly cashflow
- —
- DSCR
- —
- Eligible?
- —
No personal income docs; deal must DSCR.
Hard money
10% down · 12.0% · 12mo
- Down + closing
- —
- Monthly P&I
- —
- Monthly cashflow
- —
- DSCR
- —
- Eligible?
- —
Short-term bridge; refi at stabilization.
Rent comps 5 comps
| Address | Beds | Baths | Sqft | Rent | $/sqft | DOM | Units | Dist |
|---|---|---|---|---|---|---|---|---|
| 1219 Port Arthur Ter Leesville, LA | 3.0 | 2.0 | 1800 | $1,400 | $0.78 | 45d | 1 | 0.61mi |
| 10 Katherine Loop Leesville, LA | 3.0 | 2.0 | 1106 | $1,100 | $0.99 | 45d | 1 | 0.75mi |
| 207 Belview Rd Leesville, LA | 3.0 | 1.5 | 1300 | $1,200 | $0.92 | 45d | 1 | 0.96mi |
| 347 Watson Rd Unit 20 Leesville, LA | 3.0 | 1.0 | 1160 | $595 | $0.51 | 45d | 1 | 1.34mi |
| 347 Watson Rd Unit 12 Leesville, LA | 2.0 | 1.0 | 1160 | $575 | $0.50 | 45d | 1 | 1.34mi |
Listing history 5 events
-
2026-06-02days on market $159,700 Active 6 DOM
-
2026-06-01days on market $159,700 Active 5 DOM
-
2026-05-31days on market $159,700 Active 4 DOM
-
2026-05-31days on market $159,700 Active 3 DOM
-
2026-05-28$159,700 Active
ⓘ Source: listings_history table (triggers on properties + properties_extension) + one-shot
backfill from property_details.listing_events for pre-trigger history.
Nearby sold comps map
Loading sold comps map…
Walkable amenities ~0.75 mi
Loading nearby amenities…
Taxation est. · year 1
- Rental income
- $15,806
- − Mortgage interest
- −$8,946
- − Property taxes
- −$2,396
- − Insurance
- −$798
- − Repairs & maintenance
- −$1,265
- − Management
- −$1,265
- − Depreciation
- −$4,646
- Taxable loss
- −$3,508
- Est. tax savings @ 24.0%
- +$842
- After-tax cash flow
- $85/yr
For passive investors: Depreciation is non-cash, so a rental often shows a tax loss while cash-flowing — sheltering income. Rental losses are passive: they offset passive income freely, and up to $25,000/yr can offset ordinary (W-2) income if you actively participate and your MAGI is under $100k (phasing out to $0 by $150k); unused losses carry forward. On sale, claimed depreciation is recaptured at up to 25%, and gains may owe capital-gains tax (a 1031 exchange can defer both). Figures are a year-1 estimate at your 24.0% rate — not tax advice; consult a CPA.
Condition & rehab AI · 12 photos
This home is in good condition with a good condition score of 75. It has a cosmetic rehab level and requires minimal repairs and maintenance. The highest-ROI updates would be painting, landscaping, HVAC maintenance, and kitchen and bathroom updates to increase its resale and rental value.
Value-add opportunities
- Both Painting exterior and interior walls — Fresh paint can enhance curb appeal and interior aesthetics.
- Both Landscaping and curb appeal improvements — Enhances the home's appeal and can attract more buyers or renters.
- Both HVAC maintenance or upgrade — A well-maintained HVAC system can improve comfort and energy efficiency, attracting more buyers or renters.
- Both Kitchen and bathroom updates — Modernizing these spaces can increase the home's value and attract more buyers or renters.
- Both Landscaping and curb appeal improvements — Enhances the home's appeal and can attract more buyers or renters.
Renovation cost estimate screening
Value-add ROI direction
- Both Painting exterior and interior walls — Fresh paint can enhance curb appeal and interior aesthetics. ↑
- Both Landscaping and curb appeal improvements — Enhances the home's appeal and can attract more buyers or renters. ↑
- Both HVAC maintenance or upgrade — A well-maintained HVAC system can improve comfort and energy efficiency, attracting more buyers or renters. ↑
- Both Kitchen and bathroom updates — Modernizing these spaces can increase the home's value and attract more buyers or renters. ↑
- Both Landscaping and curb appeal improvements — Enhances the home's appeal and can attract more buyers or renters. ↑
ⓘ Cost ranges are severity-bucket heuristics (US national rule-of-thumb). Get contractor quotes + a written scope before underwriting a rehab budget.
Schools (NCES district)
- District
- Vernon Parish
- NCES district ID
- 2201830
- Math proficiency
- 35% ▼ -42.00%
- Reading proficiency
- 51% ▼ -32.00%
- Median HH income
- $44,822
- Composite
- 36.42/100
- National rank
- #4674
- State rank
- #18 of 98 in LA
Livability — Leesville
- Score
- 73/100
- State rank
- #30
- US rank
- #5046
Category grades
Schools grade is shown separately in the Schools card above.
Census & demographics
- Census place
- Leesville, LA
- County
- Vernon Parish · 21,275 people
- City population
- 21,275
- Metro
- Fort Polk South, LA
- Population (ZIP)
- 21,275
- Household income
- $55,925
- Rent vs Own
- Severe rent burden
- 659.0
Population outlook (Vernon County) Hauer SSP2
- Today (2025)
- 45,401 people
- By 2030
- 43,015 · -5.3%
- By 2040
- 38,171 · -15.9%
- By 2050
- 34,087 · -24.9%
- By 2075
- 28,267 · -37.7%
- By 2100
- 25,486 · -43.9%
Race, ethnicity, and origin ACS 2023
- Neighborhood character
- Predominantly White (72%)
- Race & ethnicity
- White 72% Black 16% Hispanic / Latino 6% Two or more races 5% Asian 2% Native American 1%
- Hispanic origin (detail)
- Mexican 3% Puerto Rican 1%
- Common ancestry
- Lithuanian 3% Slovak 1% Romanian 1%
- Foreign-born
- 3% · Canada, South Korea, Vietnam
- Languages at home
- 94% English-only · Spanish 3% French/Haitian/Cajun 1%
Political lean MEDSL · Vernon
- 2024 margin
- Solid R (+67.9) · D 15.6% · R 83.4% · Other 1.0%
- 2008→2024 swing
- -14.5pp toward R · 2008: -53.4pp · 2024: -67.9pp
- All cycles
- 2024: R+67.9 2020: R+64.9 2016: R+65.0 2012: R+57.5 2008: R+53.4
Not yet ingested
- Civics
- —
Market trends
- HPI YoY
- ▼ -61.06%
- Current HPI
- 128.8849
- Rent YoY
- ▲ 9.60%
- Metro
- Fort Polk South, LA
- State GDP YoY
- ▲ 3.29%
- F500 in state
- 10
Industry mix (Fortune 500 HQ in LA)
| Industry | F500 HQs | Revenue |
|---|---|---|
| Telecommunications | 2 | $23B |
|
||
| Utilities | 1 | $12B |
|
||
| Wholesale / Distribution | 1 | $5B |
|
||
| Advertising | 1 | $2B |
|
||
Price history
1 event — show timeline
- 2026-05-28 Listed $159,700 GFPAR
Cash-flow waterfall
monthlySold comps — $/sqft
last 12 mo · ≤1 miLoading sold comps…