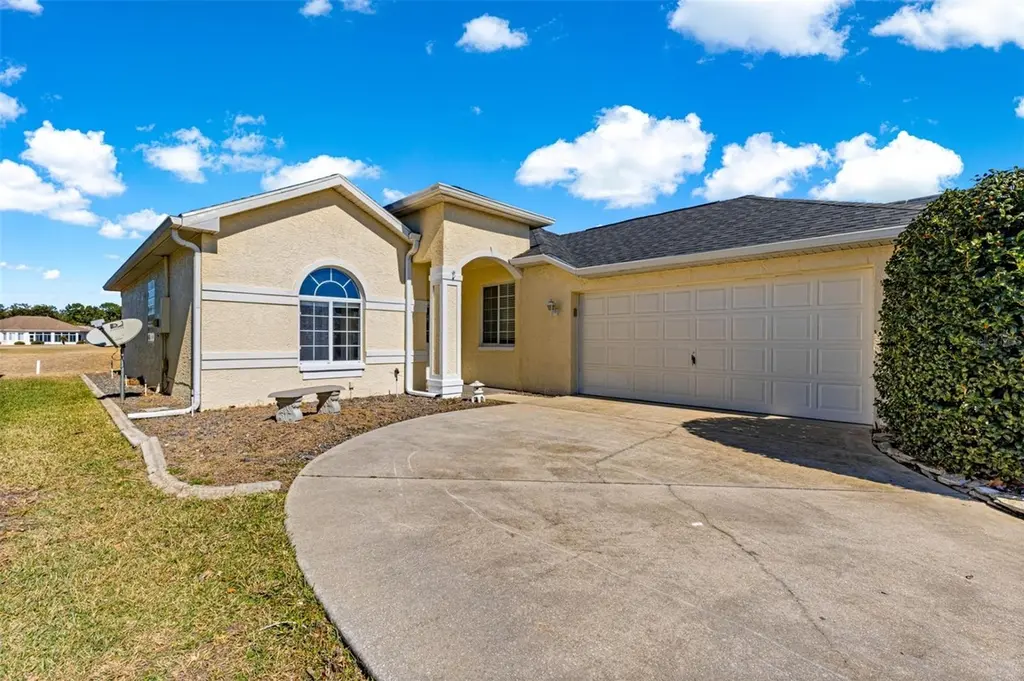
2380 NW 53rd Avenue Rd · Ocala, FL
Flood risk 1/10 · Minimal
- FEMA flood zone
- X (unshaded)
- Chance of flooding over 30 yrs
- 0.0%
- Est. flood insurance / yr
- $507 – $1,088
Fire risk 4/10 · Minor
- Est. fire insurance / yr
- $947 – $1,759
Heat risk 8/10 · Major
- Hot days now (above 107°F)
- 7 days/yr
- Hot days in 30 yrs
- 23 days/yr
Wind risk 9/10 · Severe
- Chance of severe wind over 30 yrs
- 99.0%
Air-quality risk 3/10 · Minor
- Unhealthy air days now
- 3 days/yr
- Unhealthy air days in 30 yrs
- 3 days/yr
Risk factors via First Street. Map © Google.
Why this score? — see what drove the D- grade
The composite is a weighted blend of 9 inputs, each scored 0–100. Each bar is that input's sub-score; the figure is the points it added to the 100-point composite (weight × sub-score).
- ARV discount +12.4/15.0
- Cash flow +7.0/30.0
- Rent growth +5.0/5.0
- Schools +3.6/10.0
- 1% rule +3.5/10.0
- Livability +3.5/5.0
- Condition / age +2.5/5.0
- DSCR +1.2/10.0
- Appreciation +0.0/10.0
$254,000
🖨 Deal sheet (PDF) 📄 Offer letter ✓ Due diligence
Listing remarks MLS
Wonderful 3 Bed / 2 Bath home on the Golf Course with side entry garage and updated Florida Room. Open floor plan and great location. The home has spacious, high ceilings and plenty of natural light. There is a large enclosed lanai accessible by two sets of sliding glass doors from the living/dining area that overlooks the 10th Green. The master bedroom has a walk-in closet and the master bath offers a linen closet, a dual sink vanity, a walk-in tiled shower, as well as a large soaking tub. The front bedroom could also be a great office, with yet another bedroom for guests. The side entry 2 car garage is spacious and clean, and the interior laundry room is just off the kitchen leading to the garage. All appliances are included (refrigerator, range, microwave, dishwasher, and washer/dryer). Enjoy the peaceful surroundings of the community, but with the convenience of a shopping plaza and restaurants just across from the manned gated entry. This location is close to Ocala?s World Equestrian Center, and is easy access to I-75 for travel to other Central Florida attractions such as Disney World, Universal Studios, Sea World, etc. Amenities within Ocala Palms are a active club house; two pools ? an indoor heated pool, as well as an Olympic size outdoor pool; tennis, bocce, and shuffleboard courts; an exercise room; library; and an activities room with pool and ping pong tables. ROOF REPLACED/2018 HVAC/2017
Key facts
- Walk-in tiled shower
- Walk-in closet
- Updated florida room
Tags
Neighborhood map
What this means for you Summary
Snapshot
- This is a 2-bed/2.0-bath single-family listed at $254k.
Deal economics
- At list price, monthly cash flow is $-367 ($-4k/yr) — negative.
- To cash-flow at today's rent, offer at most $189k (25.5% below list).
- To meet the 1% rule (rent ≥ 1% of price), the offer needs to be $216k (15.0% below list).
- Recommended offer: $189k (25.5% below list) — sets the bar for cash-flow.
Location & tenants
- Location reads 69/100 on livability (#476 in FL) — a middle-class / working-renter tenant base. Strengths: cost of living A+, housing A+, health & safety A+; Watch: crime F, amenities F, commute F.
- Marion (rural): math 42% / reading 43% proficiency, ranked #61 of 73 in FL (top 84%) — families likely to look elsewhere, expect single-tenant / working-renter base with shorter leases; 61% free/reduced lunch — lower-income household profile, screen leases tightly.
- Zoned schools: Liberty Middle School (math 40% / reading 41%, grade F, #360 of 571 statewide, top 64%, 1,365 students, 54% FRL); West Port High School (math 34% / reading 52%, grade F, #255 of 667 statewide, top 39%, 2,906 students, 52% FRL).
- Market conditions: Rents rising fast (+11.1%/yr); 670 active listings in the ZIP; 29 comparable units currently listed for rent nearby; rentals at typical pace (median 23d on market — plan ~3-4 weeks tenant-placement turnaround); 7,071 units permitted in Marion County in 2024 (534 in 5+ unit buildings).
- This rent runs 39% of the median local income ($66k/yr) — at the standard rent-burdened threshold; future hikes will face affordability resistance.
Forward outlook
- Local home prices are declining (-3.0%/yr); year-one equity from $2k of loan paydown is wiped out by about $8k of value loss. Plan a longer hold.
- Marion County population projected at +13% by 2050 — modest demand growth; plan on rents tracking national, not racing it.
Negotiation context
- It's been on market 107 days — a 9% lower offer ($231k) is reasonable based on typical stale-listing flexibility.
Risks & watch-outs
- Climate carrying-cost: severe wind risk, 99% chance of damaging wind over 30y; extreme-heat days projected 7→23/yr by 2055 (HVAC capex compounding) — expect insurance premiums to compound above CPI over the hold.
Questions for the listing agent
- What do current leases actually rent for vs. the listed asking? Can we see a recent rent roll and the last 12 months of T-12 income?
- It's been on market 107 days. Have you received any prior offers? Is the seller open to a 26% concession, seller financing, or rate buy-down credit?
- What does the HOA fee cover, when was the last increase, and are there any pending special assessments or reserve-fund shortfalls?
- Why hasn't it sold? Are there any deal-killer items the seller is aware of (foundation, flood, title, zoning, code violations)?
- Is there a deadline driving the sale (1031 exchange, divorce, estate, relocation)? That informs how much negotiation room exists.
- Crime grade is F in this area — have there been break-ins, vandalism, or insurance claims at this property in the last 3 years? What carrier currently insures it and at what premium?
- The area grade is low — what's the realistic commute time and amenity access for the typical tenant pool here? Any planned neighborhood developments (good or bad) we should know about?
- What's the average days-on-market for RENTAL listings here right now (not sales)? A rising rental-DOM trend means longer vacancies and softer asking-rent achievability than the comps imply.
- What's the recent tenant-quality profile in this submarket — average credit score on applications, eviction rate, late-payment / NSF rate, and stable-employment percentage? A property-management company in the area should have these aggregated.
- How much new for-sale + rental construction is in the pipeline within 1–3 miles? Heavy new supply typically softens prices + rents 12–24 months out; constrained supply supports both.
Investment metrics
- 1% rule
- 0.85% ✗
- Cap rate
- 4.56%
- Cash-on-cash
- -6.20%
- DSCR
- 0.72
- GRM
- 9.8
CMA / ARV
- ARV (median comp)
- $285,096
- List price
- $254,000
- Delta
- -10.91%
- Verdict
- UNDERPRICED
- Comps
- 20 within 1.0 mi
Show comp detail 10 sales within ~0.75 mi
| Address | Dist | Beds/Ba | Sqft | Sold | Price | $/sf | Match |
|---|---|---|---|---|---|---|---|
| 5535 NW 23rd Pl | 0.09mi | 3/2.0 (+1) | 1,485 (0%) | 2mo | $280,000 | $189 | 89 |
| 5520 NW 26th Ln | 0.13mi | 3/2.0 (+1) | 1,526 (+3%) | 8mo | $215,000 | $141 | 78 |
| 2439 NW 55th Avenue Rd | 0.06mi | 3/2.0 (+1) | 1,514 (+2%) | 17mo | $240,000 | $159 | 75 |
| 5160 NW 25th Loop | 0.35mi | 2/2.0 | 1,569 (+6%) | 8mo | $237,500 | $151 | 68 |
| 5190 NW 26th Ln | 0.34mi | 2/2.0 | 1,344 (-10%) | 2mo | $215,000 | $160 | 66 |
| 2218 NW 50th Ave | 0.54mi | 2/2.0 | 1,544 (+4%) | 6mo | $230,000 | $149 | 63 |
| 5405 NW 25th Loop | 0.17mi | 2/2.0 | 1,590 (+7%) | 22mo | $275,000 | $173 | 62 |
| 4998 NW 30th Pl | 0.61mi | 3/2.0 (+1) | 1,476 (-1%) | 9mo | $259,000 | $175 | 58 |
| 2251 NW 50th Ave | 0.56mi | 2/2.0 | 1,341 (-10%) | 5mo | $249,900 | $186 | 54 |
| 5361 NW 33rd Pl | 0.69mi | 2/2.0 | 1,318 (-11%) | 4mo | $230,000 | $175 | 46 |
Match score weights: distance 35% · size 25% · config 20% · recency 20%. Top-matched comps best support the ARV.
Projected returns pro-forma
-3.0% appreciation · 8.0% rent growth · sell at horizon
- IRR
- -20.3%
- Equity multiple
- 0.26×
- Total profit
- $-52,902
- Equity at exit
- $37,872
- IRR
- -4.0%
- Equity multiple
- 0.67×
- Total profit
- $-23,295
- Equity at exit
- $21,961
Cash invested: $71,120 (down + closing). Projections, not guarantees.
Landlord ↔ Tenant lean methodology
- Overall (STATE)
- 87 Strongly Landlord-Friendly
- State Florida
- 87 Strongly Landlord-Friendly · R+3
- County
- — inherits STATE
- City
- — inherits STATE
ZIP-level market 34482
- Rents YoY
- 11.1%
- Active inventory
- 670
- Price-to-rent
- 9.8×
Monthly cashflow live
- Estimated rent
- $2,160 high interval (Pro) →
- Mortgage (P&I)
- −$1,332
- Tax from tax record
- −$342 /mo · $4,103/yr
- Insurance
- −$106
- HOA
- −$294
- Vacancy / Maint / Mgmt
- −$454
- Net cashflow
- $-367
Break-even live
Sensitivity live
| Price | -10% $-223 | -5% $-295 | +0% $-367 | +5% $-439 | +10% $-511 |
|---|---|---|---|---|---|
| Rent | -10% $-538 | -5% $-453 | +0% $-367 | +5% $-282 | +10% $-197 |
| Rate | -1.0pp $-239 | -0.5pp $-303 | base $-367 | +0.5pp $-433 | +1.0pp $-500 |
UW: 25.0% down · 7.5% · 30yr · 1.5% tax · 5.0% vac · 8.0% maint · 8.0% mgmt
Financing live
Cash to close
- Down payment
- $63,500
- Closing costs
- $7,620
- Reserves months
- —
- Total cash needed
- —
Loan-product check · same deal, 3 products live
Conventional
25% down · 7.5% · 30yr
- Down + closing
- —
- Monthly P&I
- —
- Monthly cashflow
- —
- DSCR
- —
- Eligible?
- —
Personal DTI + credit; lowest rate.
DSCR
20% down · 8.5% · 30yr
- Down + closing
- —
- Monthly P&I
- —
- Monthly cashflow
- —
- DSCR
- —
- Eligible?
- —
No personal income docs; deal must DSCR.
Hard money
10% down · 12.0% · 12mo
- Down + closing
- —
- Monthly P&I
- —
- Monthly cashflow
- —
- DSCR
- —
- Eligible?
- —
Short-term bridge; refi at stabilization.
Rent comps 29 comps
| Address | Beds | Baths | Sqft | Rent | $/sqft | DOM | Units | Dist |
|---|---|---|---|---|---|---|---|---|
| 5399 NW 18th St Ocala, FL | 2.0 | 2.0 | 1085 | $2,100 | $1.94 | 23d | 1 | 0.48mi |
| 5399 NW 18th St Ocala, FL | 2.0 | 2.0 | 1085 | $2,100 | $1.94 | 15d | 1 | 0.48mi |
| 5353 N US Highway 27 Ocala, FL | 1.0–3.0 | 1.0–2.0 | 1169 | $1,785 | $1.53 | 23d | 1 | 0.52mi |
| 1918 NW 50th Cir Ocala, FL | 2.0 | 2.0 | 1061 | $2,200 | $2.07 | 23d | 1 | 0.54mi |
| 2048 NW 50th Ave Ocala, FL | 2.0 | 2.0 | 1062 | $2,250 | $2.12 | 23d | 1 | 0.55mi |
| 2038 NW 50th Ave Ocala, FL | 2.0 | 2.0 | 1062 | $2,250 | $2.12 | 23d | 1 | 0.56mi |
| 2028 NW 50th Ave Ocala, FL | 2.0 | 2.0 | 1066 | $1,595 | $1.50 | 23d | 1 | 0.56mi |
| 5361 NW 33rd Pl Ocala, FL | 2.0 | 2.0 | 1318 | $2,500 | $1.90 | 23d | 1 | 0.70mi |
| 5333 NW 33rd Pl Ocala, FL | 2.0 | 2.0 | 1368 | $2,300 | $1.68 | 15d | 1 | 0.71mi |
| 3384 NW 54th Ct Ocala, FL | 2.0 | 2.5 | 1722 | $2,300 | $1.34 | 23d | 1 | 0.71mi |
| 5471 NW 34th St Ocala, FL | 2.0 | 2.0 | 1318 | $2,900 | $2.20 | 23d | 1 | 0.74mi |
| 3335 NW 52nd Avenue Rd Ocala, FL | 2.0 | 2.5 | 1318 | $2,500 | $1.90 | 23d | 1 | 0.75mi |
| 1527 NW 57th Ct Unit 1 Ocala, FL | 3.0 | 2.0 | 1460 | $1,550 | $1.06 | 23d | 1 | 0.76mi |
| 5191 NW 34th St Ocala, FL | 2.0 | 2.0 | 1318 | $2,400 | $1.82 | 23d | 1 | 0.81mi |
| 5423 NW 35th Lane Rd Ocala, FL | 2.0 | 2.0 | 1656 | $3,200 | $1.93 | 23d | 1 | 0.86mi |
| 5048 NW 35th St Ocala, FL | 3.0 | 2.0 | 1552 | $1,900 | $1.22 | 15d | 1 | 0.87mi |
| 5811 NW 10th St Unit 5811 Ocala, FL | 3.0 | 2.0 | 1162 | $1,649 | $1.42 | 23d | 1 | 1.05mi |
| 1017 NW 57th Ct Unit 1019 Ocala, FL | 3.0 | 2.0 | 1162 | $1,649 | $1.42 | 23d | 1 | 1.05mi |
| 985 NW 57th Ct Unit 987 Ocala, FL | 3.0 | 2.0 | 1162 | $1,697 | $1.46 | 23d | 1 | 1.07mi |
| 985 NW 57th Ct Unit 985 Ocala, FL | 3.0 | 2.0 | 1162 | $1,649 | $1.42 | 23d | 1 | 1.07mi |
| 933 NW 57th Ct Unit 935 Ocala, FL | 3.0 | 2.0 | 1162 | $1,649 | $1.42 | 23d | 1 | 1.11mi |
| 4859 NW 35th Lane Rd Ocala, FL | 2.0 | 2.0 | 1666 | $2,495 | $1.50 | 23d | 1 | 1.21mi |
| 5530 NW 40th Loop Ocala, FL | 3.0 | 2.0 | 1622 | $2,000 | $1.23 | 23d | 1 | 1.24mi |
| 4122 NW 48th Terrace Rd Ocala, FL | 2.0 | 2.0 | 1816 | $1,999 | $1.10 | 15d | 1 | 1.32mi |
| 4743 NW 39th Street Rd Ocala, FL | 3.0 | 2.0 | 1565 | $2,500 | $1.60 | 23d | 1 | 1.36mi |
| 4395 NW 55th Ter Ocala, FL | 3.0 | 2.0 | 1853 | $2,700 | $1.46 | 23d | 1 | 1.43mi |
| 4110 NW 44th Cir Ocala, FL | 3.0 | 2.0 | 1610 | $2,400 | $1.49 | 15d | 1 | 1.45mi |
| 4111 NW 44th Cir Ocala, FL | 3.0 | 2.0 | 1505 | $2,300 | $1.53 | 15d | 1 | 1.48mi |
| 4078 NW 44th Cir Ocala, FL | 3.0 | 2.0 | 1504 | $2,500 | $1.66 | 23d | 1 | 1.49mi |
HOA detail
- Monthly dues
- $294 · $3,528/yr
- Likely covers
- poolsecurity
Listing history 17 events
-
2026-06-22days on market $254,000 Active 107 DOM
-
2026-06-18days on market $254,000 Active 104 DOM
-
2026-06-17days on market $254,000 Active 103 DOM
-
2026-06-16days on market $254,000 Active 102 DOM
-
2026-06-15days on market $254,000 Active 101 DOM
-
2026-06-14days on market $254,000 Active 99 DOM
-
2026-06-13days on market $254,000 Active 98 DOM
-
2026-06-10days on market $254,000 Active 96 DOM
-
2026-06-09days on market $254,000 Active 95 DOM
-
2026-06-08days on market $254,000 Active 94 DOM
-
2026-06-07days on market $254,000 Active 93 DOM
-
2026-06-03days on market $254,000 Active 89 DOM
-
2026-06-02days on market $254,000 Active 88 DOM
-
2026-06-01days on market $254,000 Active 87 DOM
-
2026-05-31days on market $254,000 Active 86 DOM
-
2026-05-30days on market $254,000 Active 85 DOM
-
2026-03-06$274,000 Active 1428-char remark
Show marketing remark (1428 chars)
Wonderful 3 Bed / 2 Bath home on the Golf Course with side entry garage and updated Florida Room. Open floor plan and great location. The home has spacious, high ceilings and plenty of natural light. There is a large enclosed lanai accessible by two sets of sliding glass doors from the living/dining area that overlooks the 10th Green. The master bedroom has a walk-in closet and the master bath offers a linen closet, a dual sink vanity, a walk-in tiled shower, as well as a large soaking tub. The front bedroom could also be a great office, with yet another bedroom for guests. The side entry 2 car garage is spacious and clean, and the interior laundry room is just off the kitchen leading to the garage. All appliances are included (refrigerator, range, microwave, dishwasher, and washer/dryer). Enjoy the peaceful surroundings of the community, but with the convenience of a shopping plaza and restaurants just across from the manned gated entry. This location is close to Ocala?s World Equestrian Center, and is easy access to I-75 for travel to other Central Florida attractions such as Disney World, Universal Studios, Sea World, etc. Amenities within Ocala Palms are a active club house; two pools ? an indoor heated pool, as well as an Olympic size outdoor pool; tennis, bocce, and shuffleboard courts; an exercise room; library; and an activities room with pool and ping pong tables. ROOF REPLACED/2018 HVAC/2017
ⓘ Source: listings_history table (triggers on properties + properties_extension) + one-shot
backfill from property_details.listing_events for pre-trigger history.
Tax reassessment forecast FL · Resets to sale price
- Current annual tax
- $4,103 · $342/mo
- Projected year-2 tax
- $4,103 · $342/mo
- Expected delta
- $0/yr ($0/mo · 0.0%)
ⓘ Screening estimate from a state-policy table — verify with the county assessor before closing.
Climate risk First Street
- Flood 1/10 Low FEMA zone X (unshaded) · 0% chance over 30 yrs
- Wildfire 4/10 Moderate
- Heat 8/10 Severe 7 d/yr ≥107°F today · 23 d/yr by 30 yrs out
- Wind 9/10 Extreme 99% chance of damaging wind over 30 yrs
- Air quality 3/10 Moderate 3 unhealthy d/yr today · 3 by 30 yrs out
Nearby sold comps map
Loading sold comps map…
Walkable amenities ~0.75 mi
Loading nearby amenities…
Taxation est. · year 1
- Rental income
- $25,922
- − Mortgage interest
- −$14,228
- − Property taxes
- −$4,103
- − Insurance
- −$1,270
- − Repairs & maintenance
- −$2,074
- − Management
- −$2,074
- − HOA
- −$3,528
- − Depreciation
- −$7,389
- Taxable loss
- −$8,743
- Est. tax savings @ 24.0%
- +$2,098
- After-tax cash flow
- $-2,308/yr
For passive investors: Depreciation is non-cash, so a rental often shows a tax loss while cash-flowing — sheltering income. Rental losses are passive: they offset passive income freely, and up to $25,000/yr can offset ordinary (W-2) income if you actively participate and your MAGI is under $100k (phasing out to $0 by $150k); unused losses carry forward. On sale, claimed depreciation is recaptured at up to 25%, and gains may owe capital-gains tax (a 1031 exchange can defer both). Figures are a year-1 estimate at your 24.0% rate — not tax advice; consult a CPA.
Schools (NCES district)
- District
- Marion
- NCES district ID
- 1201260
- Math proficiency
- 42% ▼ -7.00%
- Reading proficiency
- 43% ▼ -4.00%
- Median HH income
- $40,015
- Composite
- 35.61/100
- National rank
- #4890
- State rank
- #61 of 73 in FL
Livability — Ocala
- Score
- 69/100
- State rank
- #476
- US rank
- #8461
Category grades
Schools grade is shown separately in the Schools card above.
Census & demographics
- County
- Marion County · 315,796 people
- City population
- 263,375
- Metro
- Ocala, FL
- Population (ZIP)
- 22,807
- Household income
- $65,901
- Rent vs Own
- Severe rent burden
- 282.0
Population outlook (Marion County) Hauer SSP2
- Today (2025)
- 365,905 people
- By 2030
- 376,768 · +3.0%
- By 2040
- 396,555 · +8.4%
- By 2050
- 412,723 · +12.8%
- By 2075
- 446,090 · +21.9%
- By 2100
- 436,193 · +19.2%
Race, ethnicity, and origin ACS 2023
- Neighborhood character
- Majority White (63%)
- Race & ethnicity
- White 63% Hispanic / Latino 19% Black 14% Two or more races 12%
- Hispanic origin (detail)
- Mexican 6% Puerto Rican 9% Cuban 2%
- Common ancestry
- Lithuanian 2% Romanian 2% Slovak 2%
- Foreign-born
- 10% · Canada
- Languages at home
- 81% English-only · Spanish 16% Other Indo-European 1%
Political lean MEDSL · Marion
- 2024 margin
- Solid R (+31.6) · D 33.8% · R 65.5%
- 2008→2024 swing
- -20.0pp toward R · 2008: -11.6pp · 2024: -31.6pp
- All cycles
- 2024: R+31.6 2020: R+25.9 2016: R+26.2 2012: R+16.2 2008: R+11.6
Not yet ingested
- Civics
- —
Market trends
- HPI YoY
- ▼ -133.62%
- Current HPI
- 194.3857
- Rent YoY
- ▲ 11.12%
- Metro
- Ocala, FL
- State GDP YoY
- ▲ 3.28%
- F500 in state
- 36
Industry mix (Fortune 500 HQ in FL)
| Industry | F500 HQs | Revenue |
|---|---|---|
| Industrial Technology | 2 | $29B |
|
||
| Insurance | 2 | $17B |
|
||
| Retail | 1 | $60B |
|
||
| Technology Distribution | 1 | $58B |
|
||
| Homebuilding | 1 | $35B |
|
||
| Technology Manufacturing | 1 | $35B |
|
||
Price history
1 event — show timeline
- 2026-03-06 Listed $274,000 Stellar MLS as Distributed by MLS Grid
Property tax history
+13.5%/yrLatest (2025): $4,103 · +13.9% YoY. Source: county tax records.
Cash-flow waterfall
monthlySold comps — $/sqft
last 12 mo · ≤1 miLoading sold comps…