 🏗️ New Construction
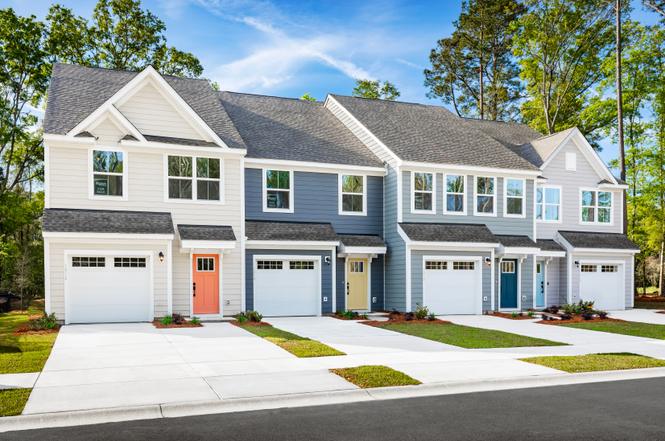
NEW!! Odessa Plan · Navassa, NC
Flood risk 1/10 · Minimal
- FEMA flood zone
- X (unshaded)
- Chance of flooding over 30 yrs
- 0.0%
- Est. flood insurance / yr
- $507 – $1,088
Fire risk 6/10 · Moderate
- Est. fire insurance / yr
- $906 – $1,684
Heat risk 9/10 · Severe
- Hot days now (above 106°F)
- 7 days/yr
- Hot days in 30 yrs
- 17 days/yr
Wind risk 8/10 · Major
- Chance of severe wind over 30 yrs
- 98.0%
Air-quality risk 2/10 · Minimal
- Unhealthy air days now
- 1 days/yr
- Unhealthy air days in 30 yrs
- 1 days/yr
Risk factors via First Street. Map © Google.
Why this score? — see what drove the D- grade
The composite is a weighted blend of 9 inputs, each scored 0–100. Each bar is that input's sub-score; the figure is the points it added to the 100-point composite (weight × sub-score).
- Cash flow +10.8/30.0
- ARV discount +7.5/15.0
- Condition / age +4.8/5.0
- Schools +3.9/10.0
- Livability +3.5/5.0
- 1% rule +3.2/10.0
- DSCR +3.1/10.0
- Rent growth +2.8/5.0
- Appreciation +0.0/10.0
$249,990
🖨 Deal sheet (PDF) 📄 Offer letter ✓ Due diligence
Listing remarks
Live close to Wilmington and the coast without the high price tag at Lakes at Riverbend Villas in Navassa, NC-where everyday living feels simple, connected, and relaxed. The Odessa is thoughtfully designed for modern lifestyles, blending open-concept living with smart functionality in a low-maintenance community. Step inside to a welcoming foyer that leads to a bright, spacious family room-perfect for gathering or unwinding. The kitchen is the heart of the home, featuring an oversized island that flows seamlessly into the dining area, making entertaining easy and everyday meals effortless. Upstairs, you'll find three comfortable bedrooms, including a private owner's suite with a large walk-
Key facts
- Double bowl vanity
- Large foyer
- Linen closet
Tags
Property features AI
Finance
- Other: Address: Navassa, NC 28451
- Financial info: List price $249,990
Exterior
- Parking: 1 parking space
- Utilities: Central air (electric cooling)
- Home design: New construction single-family plan (Odessa)
- Exterior features: Living area approximately 1567
Interior
- Bedrooms: 3 bedrooms
- Bathrooms: 2 full bathrooms and 1 half bathroom (2.5 total)
- Heating & cooling: Central air conditioning
- Interior features: Active listing for a new construction plan named "Odessa"
Neighborhood map
What this means for you Summary
Snapshot
- This is a 3-bed/2.5-bath townhouse listed at $250k. Condition is rated excellent.
Deal economics
- At list price, monthly cash flow is $-125 ($-1k/yr) — negative.
- The deal already cash-flows at list — no discount required.
- To meet the 1% rule (rent ≥ 1% of price), the offer needs to be $225k (9.8% below list).
- Recommended offer: $225k (9.8% below list) — sets the bar for 1% rule.
- Cap rate 5.8% vs local median 3.3% in Navassa — top-decile yield for the area; either an underpriced asset or a hidden risk that comps aren't pricing in. Stress-test before assuming the spread holds.
Location & tenants
- Location reads 70/100 on livability (#141 in NC) — a middle-class / working-renter tenant base. Strengths: cost of living A+, housing A+, health & safety A+; Watch: amenities F, commute F, employment F.
- Brunswick County Schools (rural): math 45% / reading 47% proficiency, ranked #82 of 178 in NC (top 46%) — families likely to look elsewhere, expect single-tenant / working-renter base with shorter leases.
- Zoned schools: Lincoln Elementary (math 44% / reading 37%, grade F, #682 of 1,410 statewide, top 49%, 675 students, 100% FRL); Leland Middle (math 26% / reading 36%, grade F, #326 of 475 statewide, top 69%, 780 students, 100% FRL); North Brunswick High (math 57% / reading 49%, grade C-, #281 of 535 statewide, top 53%, 1,450 students, 100% FRL) — zoned schools average 100% FRL vs 53% district-wide (46 pts higher); higher-poverty schools than district average — tighter screening recommended.
- Market conditions: Rents rising (+1.2%/yr); 1224 active listings in the ZIP; 2 comparable units currently listed for rent nearby; solid renter incomes; 6,112 units permitted in Brunswick County in 2024 (990 in 5+ unit buildings).
- This rent runs 33% of the median local income ($81k/yr) — at the standard rent-burdened threshold; future hikes will face affordability resistance.
Forward outlook
- Local home prices are declining (-3.0%/yr); year-one equity from $2k of loan paydown is wiped out by about $8k of value loss. Plan a longer hold.
- Brunswick County population projected at +36% by 2050 — long-run rental-demand tailwind backs the buy-and-hold thesis.
Negotiation context
- It's been on market 109 days — a 9% lower offer ($227k) is reasonable based on typical stale-listing flexibility.
Risks & watch-outs
- Climate carrying-cost: severe wind risk, 98% chance of damaging wind over 30y; major wildfire risk; extreme-heat days projected 7→17/yr by 2055 (HVAC capex compounding) — expect insurance premiums to compound above CPI over the hold.
Questions for the listing agent
- What do current leases actually rent for vs. the listed asking? Can we see a recent rent roll and the last 12 months of T-12 income?
- It's been on market 109 days. Have you received any prior offers? Is the seller open to a 10% concession, seller financing, or rate buy-down credit?
- Why hasn't it sold? Are there any deal-killer items the seller is aware of (foundation, flood, title, zoning, code violations)?
- Is there a deadline driving the sale (1031 exchange, divorce, estate, relocation)? That informs how much negotiation room exists.
- Schools are F-rated, which usually means shorter tenancies and higher turnover. Who's the typical renter profile here, and what's been the actual vacancy rate?
- The area grade is low — what's the realistic commute time and amenity access for the typical tenant pool here? Any planned neighborhood developments (good or bad) we should know about?
- What's the average days-on-market for RENTAL listings here right now (not sales)? A rising rental-DOM trend means longer vacancies and softer asking-rent achievability than the comps imply.
- What's the recent tenant-quality profile in this submarket — average credit score on applications, eviction rate, late-payment / NSF rate, and stable-employment percentage? A property-management company in the area should have these aggregated.
- How much new for-sale + rental construction is in the pipeline within 1–3 miles? Heavy new supply typically softens prices + rents 12–24 months out; constrained supply supports both.
Investment metrics
- 1% rule
- 0.82% ✗
- Cap rate
- 5.75%
- Cash-on-cash
- -1.94%
- DSCR
- 0.91
- GRM
- 10.2
CMA / ARV
- ARV (on-the-fly)
- $275,792
- Comps found
- 12
Show comp detail 12 sales within ~0.75 mi
| Address | Dist | Beds/Ba | Sqft | Sold | Price | $/sf | Match |
|---|---|---|---|---|---|---|---|
| 3324 Primrose Dr | 0.09mi | 3/2.5 | 1,628 (+4%) | 1mo | $259,000 | $159 | 88 |
| 3171 Edgehill Dr | 0.10mi | 3/2.5 | 1,633 (+4%) | 1mo | $280,000 | $171 | 88 |
| 3320 Primrose Dr | 0.02mi | 3/2.5 | 1,634 (+4%) | 6mo | $307,675 | $188 | 87 |
| 3340 Primrose Dr | 0.12mi | 3/2.5 | 1,628 (+4%) | 3mo | $284,865 | $175 | 86 |
| 4182 Farmfield Dr | 0.11mi | 3/2.5 | 1,628 (+4%) | 4mo | $276,895 | $170 | 86 |
| 3342 Primrose Dr | 0.13mi | 3/2.5 | 1,628 (+4%) | 3mo | $300,340 | $184 | 85 |
| 3322 Primrose Dr | 0.09mi | 3/2.5 | 1,628 (+4%) | 6mo | $286,130 | $176 | 85 |
| 4194 Farmfield Dr | 0.15mi | 3/2.5 | 1,628 (+4%) | 3mo | $269,990 | $166 | 84 |
| 3109 Edgehill Dr | 0.02mi | 3/2.5 | 1,634 (+4%) | 11mo | $294,245 | $180 | 83 |
| 1007 Autumn Gate Dr | 0.07mi | 3/2.5 | 1,634 (+4%) | 10mo | $278,722 | $171 | 81 |
| 1011 Autumn Gate Dr | 0.07mi | 3/2.5 | 1,634 (+4%) | 11mo | $296,525 | $181 | 81 |
| 3170 Edgehill Dr | 0.13mi | 3/2.5 | 1,442 (-8%) | 2mo | $275,000 | $191 | 79 |
Match score weights: distance 35% · size 25% · config 20% · recency 20%. Top-matched comps best support the ARV.
Projected returns pro-forma
-3.0% appreciation · 1.24% rent growth · sell at horizon
- IRR
- -21.5%
- Equity multiple
- 0.27×
- Total profit
- $-56,527
- Equity at exit
- $41,121
- IRR
- -19.9%
- Equity multiple
- 0.03×
- Total profit
- $-74,859
- Equity at exit
- $23,845
Cash invested: $77,222 (down + closing). Projections, not guarantees.
Landlord ↔ Tenant lean methodology
- Overall (STATE)
- 85 Strongly Landlord-Friendly
- State North Carolina
- 85 Strongly Landlord-Friendly · R+3
- County
- — inherits STATE
- City
- — inherits STATE
ZIP-level market 28451
- Rents YoY
- 1.2%
- Active inventory
- 1224
- Price-to-rent
- 9.2×
Monthly cashflow live
- Estimated rent
- $2,255 medium interval (Pro) →
- Mortgage (P&I)
- −$1,446
- Tax est. 1.5%
- −$345 /mo · $4,137/yr
- Insurance
- −$115
- HOA
- −$0
- Vacancy / Maint / Mgmt
- −$473
- Net cashflow
- $-125
Break-even live
Sensitivity live
| Price | -10% $66 | -5% $-29 | +0% $-125 | +5% $-220 | +10% $-315 |
|---|---|---|---|---|---|
| Rent | -10% $-303 | -5% $-214 | +0% $-125 | +5% $-36 | +10% $53 |
| Rate | -1.0pp $14 | -0.5pp $-55 | base $-125 | +0.5pp $-196 | +1.0pp $-269 |
UW: 25.0% down · 7.5% · 30yr · 1.5% tax · 5.0% vac · 8.0% maint · 8.0% mgmt
Financing live
Cash to close
- Down payment
- $68,948
- Closing costs
- $8,274
- Reserves months
- —
- Total cash needed
- —
Loan-product check · same deal, 3 products live
Conventional
25% down · 7.5% · 30yr
- Down + closing
- —
- Monthly P&I
- —
- Monthly cashflow
- —
- DSCR
- —
- Eligible?
- —
Personal DTI + credit; lowest rate.
DSCR
20% down · 8.5% · 30yr
- Down + closing
- —
- Monthly P&I
- —
- Monthly cashflow
- —
- DSCR
- —
- Eligible?
- —
No personal income docs; deal must DSCR.
Hard money
10% down · 12.0% · 12mo
- Down + closing
- —
- Monthly P&I
- —
- Monthly cashflow
- —
- DSCR
- —
- Eligible?
- —
Short-term bridge; refi at stabilization.
Rent comps 2 comps
| Address | Beds | Baths | Sqft | Rent | $/sqft | DOM | Units | Dist |
|---|---|---|---|---|---|---|---|---|
| 3160 Edgehill Dr Navassa, NC | 3.0 | 2.5 | 1432 | $2,319 | $1.62 | 16d | 1 | 0.10mi |
| 867 Ashlar Cir Leland, NC | 3.0 | 2.0 | 1696 | $2,300 | $1.36 | 25d | 1 | 0.25mi |
Listing history 16 events
-
2026-06-22days on market $249,990 Active 109 DOM
-
2026-06-18days on market $249,990 Active 106 DOM
-
2026-06-17days on market $249,990 Active 105 DOM
-
2026-06-16days on market $249,990 Active 104 DOM
-
2026-06-15days on market $249,990 Active 103 DOM
-
2026-06-14days on market $249,990 Active 101 DOM
-
2026-06-13days on market $249,990 Active 100 DOM
-
2026-06-10days on market $249,990 Active 98 DOM
-
2026-06-09days on market $249,990 Active 97 DOM
-
2026-06-08days on market $249,990 Active 96 DOM
-
2026-06-07days on market $249,990 Active 95 DOM
-
2026-06-05days on market $249,990 Active 92 DOM
-
2026-06-02days on market $249,990 Active 90 DOM
-
2026-06-01days on market $249,990 Active 89 DOM
-
2026-05-31days on market $249,990 Active 88 DOM
-
2026-05-30days on market $249,990 Active 87 DOM
ⓘ Source: listings_history table (triggers on properties + properties_extension) + one-shot
backfill from property_details.listing_events for pre-trigger history.
Climate risk First Street
- Flood 1/10 Low FEMA zone X (unshaded) · 0% chance over 30 yrs
- Wildfire 6/10 Major
- Heat 9/10 Extreme 7 d/yr ≥106°F today · 17 d/yr by 30 yrs out
- Wind 8/10 Severe 98% chance of damaging wind over 30 yrs
- Air quality 2/10 Low 1 unhealthy d/yr today · 1 by 30 yrs out
Nearby sold comps map
Loading sold comps map…
Walkable amenities ~0.75 mi
Loading nearby amenities…
Taxation est. · year 1
- Rental income
- $27,056
- − Mortgage interest
- −$15,449
- − Property taxes
- −$4,137
- − Insurance
- −$1,379
- − Repairs & maintenance
- −$2,164
- − Management
- −$2,164
- − Depreciation
- −$8,023
- Taxable loss
- −$6,261
- Est. tax savings @ 24.0%
- +$1,503
- After-tax cash flow
- $5/yr
For passive investors: Depreciation is non-cash, so a rental often shows a tax loss while cash-flowing — sheltering income. Rental losses are passive: they offset passive income freely, and up to $25,000/yr can offset ordinary (W-2) income if you actively participate and your MAGI is under $100k (phasing out to $0 by $150k); unused losses carry forward. On sale, claimed depreciation is recaptured at up to 25%, and gains may owe capital-gains tax (a 1031 exchange can defer both). Figures are a year-1 estimate at your 24.0% rate — not tax advice; consult a CPA.
Condition & rehab AI · 13 photos
This Odessa plan townhouse in Navassa, NC is in excellent condition with a modern kitchen, well-maintained bathrooms, and a clean exterior. It offers a great opportunity for a move-in-ready home with potential for further updates to enhance its value.
Value-add opportunities
- Both Painting the exterior and interior walls — Fresh paint can enhance curb appeal and interior aesthetics.
- Both Updating the flooring — New flooring can improve the overall look and feel of the home.
- Both Upgrading the kitchen appliances — Modern appliances can make the kitchen more functional and appealing to potential buyers/renters.
Renovation cost estimate screening
Value-add ROI direction
- Both Painting the exterior and interior walls — Fresh paint can enhance curb appeal and interior aesthetics. ↑
- Both Updating the flooring — New flooring can improve the overall look and feel of the home. ↑
- Both Upgrading the kitchen appliances — Modern appliances can make the kitchen more functional and appealing to potential buyers/renters. ↑
ⓘ Cost ranges are severity-bucket heuristics (US national rule-of-thumb). Get contractor quotes + a written scope before underwriting a rehab budget.
Schools (NCES district)
- District
- Brunswick County Schools
- NCES district ID
- 3700420
- Math proficiency
- 45% ▲ 4.00%
- Reading proficiency
- 47% ▲ 4.00%
- Median HH income
- $47,494
- Composite
- 39.23/100
- National rank
- #4011
- State rank
- #82 of 178 in NC
Livability — Navassa
- Score
- 70/100
- State rank
- #141
- US rank
- #8091
Category grades
Schools grade is shown separately in the Schools card above.
Census & demographics
- Census place
- Navassa, NC
- County
- Brunswick County · 131,536 people
- Metro
- Myrtle Beach-Conway-North Myrtle Beach, SC-NC
- Population (ZIP)
- 46,933
- Household income
- $81,481
- Rent vs Own
- Severe rent burden
- 1049.0
Population outlook (Brunswick County) Hauer SSP2
- Today (2025)
- 152,111 people
- By 2030
- 165,705 · +8.9%
- By 2040
- 188,494 · +23.9%
- By 2050
- 206,228 · +35.6%
- By 2075
- 237,876 · +56.4%
- By 2100
- 251,451 · +65.3%
Race, ethnicity, and origin ACS 2023
- Neighborhood character
- Predominantly White (71%)
- Race & ethnicity
- White 71% Black 12% Hispanic / Latino 11% Two or more races 8%
- Hispanic origin (detail)
- Mexican 7% Puerto Rican 1%
- Common ancestry
- Slovak 2% Lithuanian 2% Romanian 2%
- Foreign-born
- 5% · Canada
- Languages at home
- 91% English-only · Spanish 7% Other Indo-European 1%
Political lean MEDSL · Brunswick
- 2024 margin
- Strong R (+24.9) · D 37.2% · R 62.0%
- 2008→2024 swing
- -6.9pp toward R · 2008: -17.9pp · 2024: -24.9pp
- All cycles
- 2024: R+24.9 2020: R+25.0 2016: R+28.7 2012: R+22.2 2008: R+17.9
Not yet ingested
- Civics
- —
Market trends
- HPI YoY
- ▼ -99.99%
- Current HPI
- 148.6217
- Rent YoY
- ▲ 1.24%
- Metro
- Myrtle Beach-Conway-North Myrtle Beach, SC-NC
- State GDP YoY
- ▲ 3.28%
- F500 in state
- 26
Industry mix (Fortune 500 HQ in NC)
| Industry | F500 HQs | Revenue |
|---|---|---|
| Financial Services | 2 | $213B |
|
||
| Retail | 2 | $95B |
|
||
| Industrial Conglomerate | 1 | $38B |
|
||
| Metals / Steel | 1 | $35B |
|
||
| Utilities | 1 | $30B |
|
||
| Industrial Machinery | 1 | $19B |
|
||
Cash-flow waterfall
monthlySold comps — $/sqft
last 12 mo · ≤1 miLoading sold comps…