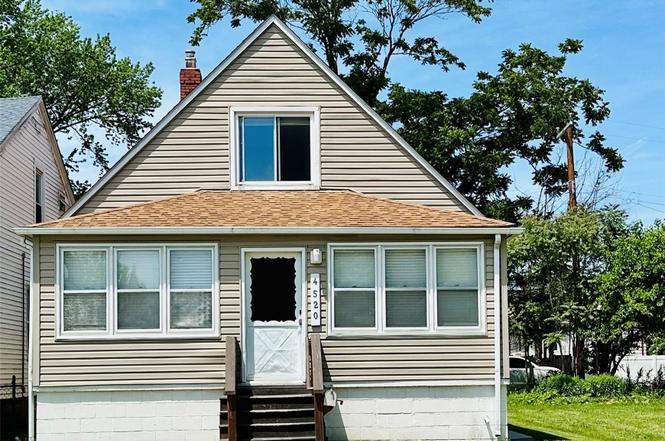
4520 5th St · Ecorse, MI
Flood risk 1/10 · Minimal
- FEMA flood zone
- X (unshaded)
- Chance of flooding over 30 yrs
- 0.0%
- Est. flood insurance / yr
- $507 – $1,088
Fire risk 1/10 · Minimal
- Est. fire insurance / yr
- $784 – $1,456
Heat risk 3/10 · Minor
- Hot days now (above 97°F)
- 7 days/yr
- Hot days in 30 yrs
- 15 days/yr
Wind risk 2/10 · Minimal
- Chance of severe wind over 30 yrs
- —
Air-quality risk 3/10 · Minor
- Unhealthy air days now
- 3 days/yr
- Unhealthy air days in 30 yrs
- 5 days/yr
Risk factors via First Street. Map © Google.
Why this score? — see what drove the C+ grade
The composite is a weighted blend of 9 inputs, each scored 0–100. Each bar is that input's sub-score; the figure is the points it added to the 100-point composite (weight × sub-score).
- Cash flow +25.5/30.0
- Appreciation +10.0/10.0
- DSCR +8.4/10.0
- 1% rule +6.2/10.0
- Livability +3.5/5.0
- ARV discount +2.5/15.0
- Rent growth +2.5/5.0
- Condition / age +2.5/5.0
- Schools +0.3/10.0
$119,900
🖨 Deal sheet (PDF) 📄 Offer letter ✓ Due diligence
Listing remarks MLS
Updated, move-in ready, 4-bedroom home offering flexibility, comfort, and charm! Relax and unwind on the enclosed front porch, a wonderful extra space that adds to this home's appeal. There are 2 spacious bedrooms located on the main floor, with 2 additional upstairs, providing plenty of space. Enjoy the large dining room, perfect for everyday meals and entertaining. Freshly painted throughout with brand-new carpeting, this home is ready for its next owner. City sidewalks and a functional floor plan complete the package. BAVAI
Key facts
- Large dining room
- Enclosed front porch
- 3,049 sq ft lot
Tags
Property features AI
Exterior
- Parking: No garage
- Utilities: Public water; Public sewer
- Home design: Single-family residence; Two levels; Ground-level entry
- Construction: Aluminum siding; Block foundation
- Exterior features: Paved road access; Lot dimensions approximately 30 x 100 (0.07 acre)
Interior
- Kitchen: Dishwasher; Disposal; Microwave; Free-standing gas oven; Free-standing refrigerator
- Bedrooms: Total of 7 rooms (bedroom count not specified)
- Bathrooms: One full bathroom
- Heating & cooling: Forced air heating (natural gas); Central air conditioning
- Interior features: Gas water heater; Dishwasher; Disposal; Microwave; Free-standing gas oven; Free-standing refrigerator; Unfinished basement
- Laundry & utility: Gas water heater
Neighborhood map
What this means for you Summary
Snapshot
- This is a 4-bed/1.0-bath single-family listed at $120k.
Deal economics
- At list price, monthly cash flow is $279 ($3k/yr) — positive.
- The deal already cash-flows at list — no discount required.
- Meets the 1% rule at list price ($1k rent vs $120k).
Location & tenants
- Location reads 69/100 on livability (#348 in MI) — a middle-class / working-renter tenant base. Strengths: commute A+, cost of living A+, housing A+; Watch: health & safety D+, crime F, amenities F.
- Ecorse Public Schools (suburban): math 3% / reading 7% proficiency, ranked #536 of 540 in MI (top 99%) — low school quality limits family demand, transient renter base, plan for 1-2y turnover; 80% free/reduced lunch — lower-income household profile, screen leases tightly.
- Zoned schools: Ralph J Bunche Academy (math 10% / reading 10%, grade F, #1,230 of 1,397 statewide, top 91%, 318 students, 90% FRL); Grandport Elementary Academy (math 2% / reading 8%, grade F, #488 of 493 statewide, top 100%, 335 students, 89% FRL); Ecorse Community High School (math 5% / reading 15%, grade F, #659 of 713 statewide, top 97%, 296 students, 81% FRL).
- Market conditions: 60 active listings in the ZIP; 4 comparable units currently listed for rent nearby; rentals leasing fast (median 7d on market — plan ~1-2 weeks tenant-placement turnaround); 2,639 units permitted in Wayne County in 2024 (1,216 in 5+ unit buildings).
Forward outlook
- In year one you build about $13k of equity ($829 loan paydown + $12k appreciation (10.0% local appreciation)).
- Wayne County population projected at -17% by 2050 — secular population decline; favor cash flow + early exit over multi-decade hold.
- At projected returns (10.0% appreciation + 3.0% rent growth), your $34k cash investment doubles in ~2 years — after that, you're playing with house money.
- By year 3, paydown + projected appreciation supports a ~$32k cash-out refi (75% LTV) — recoverable capital for the next deal without selling this one.
Negotiation context
- Only 11 days on market — expect competitive offers; lowballing is unlikely to land.
- 7 sale attempts since 28y ago with the ask held roughly flat each time — persistent listings suggest the price (not the market) is what's stuck; bring a comps-based counter.
- Current owner paid $9k; list at $120k implies a 1232% gain — meaningful room to come down on a strong offer.
Risks & watch-outs
- Watch-outs: built in 1928 — expect roof / HVAC / electrical / plumbing capex.
Questions for the listing agent
- Built in 1928 — when were the roof, HVAC, electrical panel, plumbing, and water heater last replaced?
- Is there a deadline driving the sale (1031 exchange, divorce, estate, relocation)? That informs how much negotiation room exists.
- Schools are F-rated, which usually means shorter tenancies and higher turnover. Who's the typical renter profile here, and what's been the actual vacancy rate?
- Crime grade is F in this area — have there been break-ins, vandalism, or insurance claims at this property in the last 3 years? What carrier currently insures it and at what premium?
- What's the average days-on-market for RENTAL listings here right now (not sales)? A rising rental-DOM trend means longer vacancies and softer asking-rent achievability than the comps imply.
- What's the recent tenant-quality profile in this submarket — average credit score on applications, eviction rate, late-payment / NSF rate, and stable-employment percentage? A property-management company in the area should have these aggregated.
- How much new for-sale + rental construction is in the pipeline within 1–3 miles? Heavy new supply typically softens prices + rents 12–24 months out; constrained supply supports both.
Investment metrics
- 1% rule
- 1.12% ✓
- Cap rate
- 9.09%
- Cash-on-cash
- 9.98%
- DSCR
- 1.44
- GRM
- 7.4
CMA / ARV
- ARV (on-the-fly)
- $107,910
- Comps found
- 12
Show comp detail 12 sales within ~0.75 mi
| Address | Dist | Beds/Ba | Sqft | Sold | Price | $/sf | Match |
|---|---|---|---|---|---|---|---|
| 277 White St | 0.13mi | 3/1.0 (-1) | 1,007 (+2%) | 6mo | $151,000 | $150 | 82 |
| 4635 5th St | 0.21mi | 3/1.0 (-1) | 965 (-2%) | 1mo | $99,900 | $104 | 80 |
| 4405 7th St | 0.18mi | 4/1.0 | 1,056 (+7%) | 6mo | $23,500 | $22 | 75 |
| 4548 8th St | 0.17mi | 3/1.0 (-1) | 1,077 (+9%) | 2mo | $109,000 | $101 | 71 |
| 239 White St | 0.07mi | 3/1.0 (-1) | 1,100 (+11%) | 4mo | $120,000 | $109 | 70 |
| 483 Park Ave | 0.38mi | 3/2.0 (-1) | 988 (-0%) | 3mo | $206,000 | $209 | 70 |
| 350 Labadie St | 0.38mi | 3/1.0 (-1) | 960 (-3%) | 3mo | $99,000 | $103 | 70 |
| 4260 Pitt St | 0.59mi | 3/1.5 (-1) | 998 (+1%) | 2mo | $31,000 | $31 | 63 |
| 2458 River Dr | 0.49mi | 3/1.0 (-1) | 1,078 (+9%) | 1mo | $144,000 | $134 | 56 |
| 525 Mill St | 0.52mi | 3/1.0 (-1) | 1,070 (+8%) | 6mo | $196,000 | $183 | 52 |
| 4345 10th St | 0.37mi | 3/2.0 (-1) | 1,118 (+13%) | 3mo | $116,000 | $104 | 49 |
| 568 Garfield Ave | 0.48mi | 3/1.0 (-1) | 1,116 (+13%) | 4mo | $142,000 | $127 | 48 |
Match score weights: distance 35% · size 25% · config 20% · recency 20%. Top-matched comps best support the ARV.
Projected returns pro-forma
10.0% appreciation · 3.0% rent growth · sell at horizon
- IRR
- 31.6%
- Equity multiple
- 3.47×
- Total profit
- $83,077
- Equity at exit
- $108,015
- IRR
- 27.3%
- Equity multiple
- 7.87×
- Total profit
- $230,652
- Equity at exit
- $232,939
Cash invested: $33,572 (down + closing). Projections, not guarantees.
Landlord ↔ Tenant lean methodology
- Overall (STATE)
- 62 Landlord-Friendly
- State Michigan
- 62 Landlord-Friendly · EVEN
- County
- — inherits STATE
- City
- — inherits STATE
ZIP-level market 48229
- Home prices YoY
- 33.9%
- Active inventory
- 60
- Price-to-rent
- 7.4×
Monthly cashflow live
- Estimated rent
- $1,348 medium interval (Pro) →
- Mortgage (P&I)
- −$629
- Tax from tax record
- −$107 /mo · $1,286/yr
- Insurance
- −$50
- HOA
- −$0
- Vacancy / Maint / Mgmt
- −$283
- Net cashflow
- $279
Break-even live
Sensitivity live
| Price | -10% $347 | -5% $313 | +0% $279 | +5% $245 | +10% $211 |
|---|---|---|---|---|---|
| Rent | -10% $173 | -5% $226 | +0% $279 | +5% $332 | +10% $386 |
| Rate | -1.0pp $340 | -0.5pp $310 | base $279 | +0.5pp $248 | +1.0pp $217 |
UW: 25.0% down · 7.5% · 30yr · 1.5% tax · 5.0% vac · 8.0% maint · 8.0% mgmt
Financing live
Cash to close
- Down payment
- $29,975
- Closing costs
- $3,597
- Reserves months
- —
- Total cash needed
- —
Loan-product check · same deal, 3 products live
Conventional
25% down · 7.5% · 30yr
- Down + closing
- —
- Monthly P&I
- —
- Monthly cashflow
- —
- DSCR
- —
- Eligible?
- —
Personal DTI + credit; lowest rate.
DSCR
20% down · 8.5% · 30yr
- Down + closing
- —
- Monthly P&I
- —
- Monthly cashflow
- —
- DSCR
- —
- Eligible?
- —
No personal income docs; deal must DSCR.
Hard money
10% down · 12.0% · 12mo
- Down + closing
- —
- Monthly P&I
- —
- Monthly cashflow
- —
- DSCR
- —
- Eligible?
- —
Short-term bridge; refi at stabilization.
Rent comps 4 comps
| Address | Beds | Baths | Sqft | Rent | $/sqft | DOM | Units | Dist |
|---|---|---|---|---|---|---|---|---|
| 168 Bondie St Wyandotte, MI | 3.0 | 1.0 | 1080 | $1,295 | $1.20 | 6d | 1 | 0.94mi |
| 170 Bondie St Wyandotte, MI | 3.0 | 1.0 | 1080 | $1,399 | $1.30 | 4d | 1 | 0.94mi |
| 3575 S Ethel St Detroit, MI | 3.0 | 1.0 | 894 | $1,350 | $1.51 | 19d | 1 | 1.18mi |
| 1159 McKinley St Wyandotte, MI | 3.0 | 1.0 | 1050 | $1,350 | $1.29 | 0d | 1 | 1.41mi |
Listing history 7 events
-
2026-06-21days on market $119,900 Active 11 DOM
-
2026-06-18days on market $119,900 Active 8 DOM
-
2026-06-17days on market $119,900 Active 7 DOM
-
2026-06-16days on market $119,900 Active 6 DOM
-
2026-06-15days on market $119,900 Active 5 DOM
-
2026-06-13remarks 533-char remark
-
2026-06-13$119,900 Active 3 DOM
ⓘ Source: listings_history table (triggers on properties + properties_extension) + one-shot
backfill from property_details.listing_events for pre-trigger history.
Tax reassessment forecast MI · Partial reset (capped growth)
- Current annual tax
- $1,286 · $107/mo
- Projected year-2 tax
- $1,566 · $131/mo
- Expected delta
- +$280/yr (+$23/mo · 21.8%)
ⓘ Screening estimate from a state-policy table — verify with the county assessor before closing.
Climate risk First Street
- Flood 1/10 Low FEMA zone X (unshaded) · 0% chance over 30 yrs
- Wildfire 1/10 Low
- Heat 3/10 Moderate 7 d/yr ≥97°F today · 15 d/yr by 30 yrs out
- Wind 2/10 Low
- Air quality 3/10 Moderate 3 unhealthy d/yr today · 5 by 30 yrs out
Nearby sold comps map
Loading sold comps map…
Walkable amenities ~0.75 mi
Loading nearby amenities…
Taxation est. · year 1
- Rental income
- $16,179
- − Mortgage interest
- −$6,716
- − Property taxes
- −$1,286
- − Insurance
- −$600
- − Repairs & maintenance
- −$1,294
- − Management
- −$1,294
- − Depreciation
- −$3,488
- Taxable income
- $1,500
- Est. tax owed @ 24.0%
- −$360
- After-tax cash flow
- $2,990/yr
For passive investors: Depreciation is non-cash, so a rental often shows a tax loss while cash-flowing — sheltering income. Rental losses are passive: they offset passive income freely, and up to $25,000/yr can offset ordinary (W-2) income if you actively participate and your MAGI is under $100k (phasing out to $0 by $150k); unused losses carry forward. On sale, claimed depreciation is recaptured at up to 25%, and gains may owe capital-gains tax (a 1031 exchange can defer both). Figures are a year-1 estimate at your 24.0% rate — not tax advice; consult a CPA.
Schools (NCES district)
- District
- Ecorse Public Schools
- NCES district ID
- 2612930
- Math proficiency
- 3% ▼ -4.00%
- Reading proficiency
- 7% ▼ -6.00%
- Median HH income
- $28,957
- Composite
- 3.46/100
- National rank
- #10075
- State rank
- #536 of 540 in MI
Livability — Ecorse
- Score
- 69/100
- State rank
- #348
- US rank
- #8880
Category grades
Schools grade is shown separately in the Schools card above.
Census & demographics
- Census place
- Ecorse, MI
- City population
- 9,166
- Population (ZIP)
- 9,166
Population outlook (Wayne County) Hauer SSP2
- Today (2025)
- 1,675,273 people
- By 2030
- 1,620,300 · -3.3%
- By 2040
- 1,502,341 · -10.3%
- By 2050
- 1,384,039 · -17.4%
- By 2075
- 1,124,592 · -32.9%
- By 2100
- 881,193 · -47.4%
Race, ethnicity, and origin ACS 2023
- Neighborhood character
- Diverse neighborhood (Simpson 0.69)
- Race & ethnicity
- Black 45% White 26% Hispanic / Latino 21% Two or more races 15% Native American 4%
- Hispanic origin (detail)
- Mexican 18% Puerto Rican 1%
- Common ancestry
- Lithuanian 3% Romanian 2% Slovak 1%
- Foreign-born
- 4% · Canada, Guatemala, Jamaica
- Languages at home
- 86% English-only · Spanish 13%
Political lean MEDSL · Wayne
- 2024 margin
- Strong D (+29.0) · D 62.7% · R 33.7% · Other 3.6%
- 2008→2024 swing
- -20.5pp toward R · 2008: 49.5pp · 2024: 29.0pp
- All cycles
- 2024: D+29.0 2020: D+38.1 2016: D+37.3 2012: D+46.9 2008: D+49.5
Not yet ingested
- Civics
- —
Market trends
- HPI YoY
- ▲ 102.51%
- Current HPI
- 404.5927
- Rent YoY
- —
- Metro
- —
- State GDP YoY
- ▲ 1.37%
- F500 in state
- 28
Industry mix (Fortune 500 HQ in MI)
| Industry | F500 HQs | Revenue |
|---|---|---|
| Automotive Parts | 3 | $48B |
|
||
| Automotive | 2 | $372B |
|
||
| Chemicals | 1 | $45B |
|
||
| Automotive Retail | 1 | $29B |
|
||
| Healthcare / Medical Devices | 1 | $23B |
|
||
| Automotive Technology | 1 | $20B |
|
||
Price history
+203.5% since first listed16 events — show timeline
- 2026-06-11 Listed $119,900 MiRealSource-MiMLS
- 2026-06-11 Listed $119,900 REALCOMP
- 2026-06-10 Coming Soon $119,900 MiRealSource-MiMLS
- 2012-12-21 Sold (MLS) $9,000 MiRealSource-MiMLS
- 2012-12-21 Sold (MLS) $9,000 REALCOMP
- 2012-12-10 Listing Removed — MiRealSource-MiMLS
- 2012-12-10 Listing Removed — REALCOMP
- 2012-12-06 Listed $9,500 MiRealSource-MiMLS
- 2012-12-06 Listed $9,500 REALCOMP
- 2008-09-27 Listing Removed — REALCOMP
- 2007-10-03 Listed $79,900 REALCOMP
- 1999-02-17 Sold (Public Records) $39,500 Public Records
- 1998-12-14 Sold (MLS) $39,500 MiRealSource-MiMLS
- 1998-12-14 Sold (MLS) $39,500 REALCOMP
- 1998-10-15 Listed $39,500 MiRealSource-MiMLS
- 1998-10-15 Listed $39,500 REALCOMP
Property tax history
-2.0%/yrLatest (2025): $1,286 · -0.3% YoY. Source: county tax records.
Cash-flow waterfall
monthlySold comps — $/sqft
last 12 mo · ≤1 miLoading sold comps…