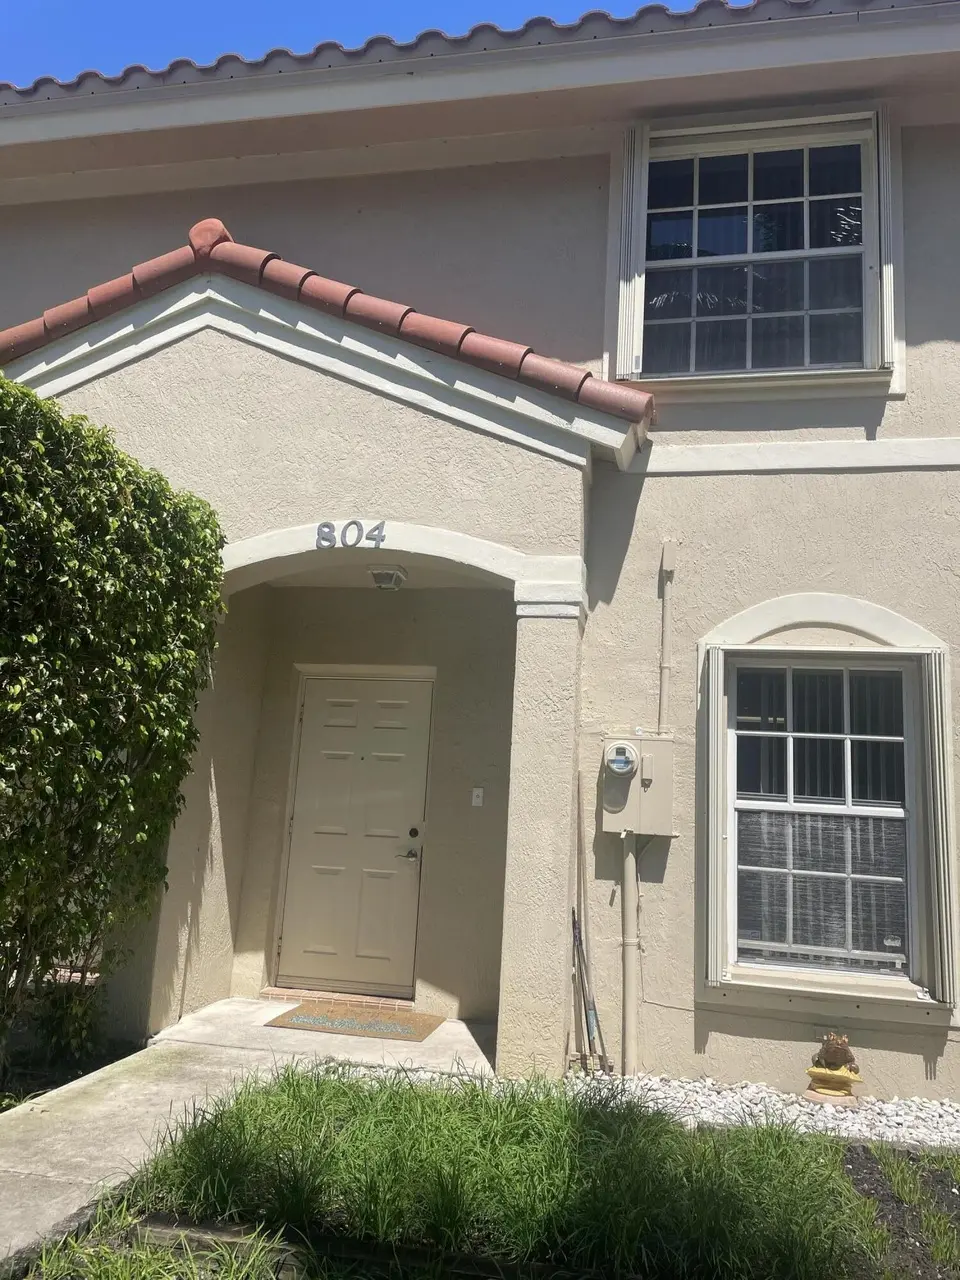
804 Summit Lake Dr · Pine Air, FL
Flood risk 1/10 · Minimal
- FEMA flood zone
- X (unshaded)
- Chance of flooding over 30 yrs
- 0.0%
- Est. flood insurance / yr
- $507 – $1,088
Fire risk 1/10 · Minimal
- Est. fire insurance / yr
- $947 – $1,759
Heat risk 9/10 · Severe
- Hot days now (above 105°F)
- 3 days/yr
- Hot days in 30 yrs
- 10 days/yr
Wind risk 10/10 · Severe
- Chance of severe wind over 30 yrs
- 99.0%
Air-quality risk 2/10 · Minimal
- Unhealthy air days now
- 1 days/yr
- Unhealthy air days in 30 yrs
- 1 days/yr
Risk factors via First Street. Map © Google.
Why this score? — see what drove the D grade
The composite is a weighted blend of 9 inputs, each scored 0–100. Each bar is that input's sub-score; the figure is the points it added to the 100-point composite (weight × sub-score).
- Cash flow +13.0/30.0
- ARV discount +7.5/15.0
- Schools +4.3/10.0
- DSCR +3.9/10.0
- 1% rule +3.8/10.0
- Livability +3.7/5.0
- Rent growth +2.7/5.0
- Condition / age +2.5/5.0
- Appreciation +0.0/10.0
$299,000
🖨 Deal sheet (PDF) 📄 Offer letter ✓ Due diligence
Listing remarks MLS
ONLY TWO YEARS NEW, EAT-IN-KITCHEN. TWO MASTER SUITES. NICE SIZE LIVING AREA, WASHER, DRYER IN UNIT. PRIVATE BACK AREA. PLEASE DO NOT LET CAT OUT
Key facts
- $325 HOA
- Parking
- Community pool
Property features AI
Finance
- Other: Pets allowed with breed restrictions
- HOA & community: Homeowners association with $325 monthly fee; HOA covers maintenance of grounds, common areas and recreation facility; Community amenities include a pool, playground and picnic area
Exterior
- Parking: Open parking; 2 open parking spaces (1 total parking indicated)
- Utilities: Public water; Public sewer; Sewer available; Water available
- Home design: Townhouse; 2 stories; Resale property; Faces north
- Construction: CBS construction; Spanish tile roof
- Exterior features: Fenced yard; Not waterfront
Interior
- Kitchen: Dishwasher; Electric range; Microwave; Refrigerator
- Bedrooms: No main-level bedrooms noted
- Flooring: Ceramic tile; Wood
- Bathrooms: 2 full bathrooms and 1 half bathroom (3 total); 1 bathroom on the main level
- Heating & cooling: Central heating; Central air conditioning; Ceiling fan(s); Electric cooling
- Interior features: Walk-in closet(s); Unfurnished
- Laundry & utility: Laundry on the main level
Neighborhood map
What this means for you Summary
Snapshot
- This is a 2-bed/2.5-bath townhouse listed at $299k.
Deal economics
- At list price, monthly cash flow is $-18 ($-214/yr) — negative.
- To cash-flow at today's rent, offer at most $296k (1.1% below list).
- To meet the 1% rule (rent ≥ 1% of price), the offer needs to be $263k (12.0% below list).
- Recommended offer: $263k (12.0% below list) — sets the bar for 1% rule.
Location & tenants
- Location reads 74/100 on livability (#270 in FL, #4,410 nationally) — a middle-class / working-renter tenant base. Strengths: crime A+, housing A+, health & safety A; Watch: employment C-, amenities F, commute F.
- Palm Beach (suburban): math 46% / reading 53% proficiency, ranked #34 of 73 in FL (top 47%) — families likely to look elsewhere, expect single-tenant / working-renter base with shorter leases.
- Zoned schools: Berkshire Elementary School (math 46% / reading 51%, grade D, #1,152 of 2,144 statewide, top 55%, 1,046 students, 70% FRL); Palm Springs Middle School (math 27% / reading 38%, grade F, #443 of 571 statewide, top 78%, 1,521 students, 72% FRL); John I. Leonard High School (math 17% / reading 35%, grade F, #494 of 667 statewide, top 75%, 3,549 students, 67% FRL) — zoned schools average 70% FRL vs 52% district-wide (18 pts higher); higher-poverty schools than district average — tighter screening recommended.
- Zoned-school proficiency averages 36% at this address vs 50% district-wide (-14 pts) — the specific schools serving this property underperform the Palm Beach average; the district grade overstates school quality for this exact location.
- Market conditions: Rents flat; 100 active listings in the ZIP; 9 comparable units currently listed for rent nearby; rentals at typical pace (median 26d on market — plan ~3-4 weeks tenant-placement turnaround); solid renter incomes; 3,974 units permitted in Palm Beach County in 2024 (1,012 in 5+ unit buildings).
- This rent runs 41% of the median local income ($77k/yr) — at the standard rent-burdened threshold; future hikes will face affordability resistance.
Forward outlook
- Local home prices are declining (-3.0%/yr); year-one equity from $2k of loan paydown is wiped out by about $9k of value loss. Plan a longer hold.
- Palm Beach County population projected at +30% by 2050 — long-run rental-demand tailwind backs the buy-and-hold thesis.
Negotiation context
- It's been on market 84 days — a 6% lower offer ($281k) is reasonable based on typical stale-listing flexibility.
- 3 sale attempts since 25y ago; this cycle's ask has dropped $31k (9%) from the opening price — seller is motivated, your offer sets the floor, not the list.
- Current owner paid $150k; list at $299k implies a 99% gain — meaningful room to come down on a strong offer.
Risks & watch-outs
- Climate carrying-cost: severe wind risk, 99% chance of damaging wind over 30y; extreme-heat days projected 3→10/yr by 2055 (HVAC capex compounding) — expect insurance premiums to compound above CPI over the hold.
Questions for the listing agent
- What do current leases actually rent for vs. the listed asking? Can we see a recent rent roll and the last 12 months of T-12 income?
- It's been on market 84 days. Have you received any prior offers? Is the seller open to a 12% concession, seller financing, or rate buy-down credit?
- What does the HOA fee cover, when was the last increase, and are there any pending special assessments or reserve-fund shortfalls?
- Why hasn't it sold? Are there any deal-killer items the seller is aware of (foundation, flood, title, zoning, code violations)?
- Is there a deadline driving the sale (1031 exchange, divorce, estate, relocation)? That informs how much negotiation room exists.
- Schools are A-rated — typically a magnet for longer-tenancy family renters. What's the average tenant stay here, and is there a school-zone premium baked into asking?
- The area grade is low — what's the realistic commute time and amenity access for the typical tenant pool here? Any planned neighborhood developments (good or bad) we should know about?
- What's the average days-on-market for RENTAL listings here right now (not sales)? A rising rental-DOM trend means longer vacancies and softer asking-rent achievability than the comps imply.
- What's the recent tenant-quality profile in this submarket — average credit score on applications, eviction rate, late-payment / NSF rate, and stable-employment percentage? A property-management company in the area should have these aggregated.
- How much new for-sale + rental construction is in the pipeline within 1–3 miles? Heavy new supply typically softens prices + rents 12–24 months out; constrained supply supports both.
Investment metrics
- 1% rule
- 0.88% ✗
- Cap rate
- 6.22%
- Cash-on-cash
- -0.26%
- DSCR
- 0.99
- GRM
- 9.5
CMA / ARV
No comps found within radius.
Projected returns pro-forma
-3.0% appreciation · 0.68% rent growth · sell at horizon
- IRR
- -19.4%
- Equity multiple
- 0.34×
- Total profit
- $-55,532
- Equity at exit
- $44,582
- IRR
- -17.9%
- Equity multiple
- 0.13×
- Total profit
- $-73,092
- Equity at exit
- $25,852
Cash invested: $83,720 (down + closing). Projections, not guarantees.
Landlord ↔ Tenant lean methodology
- Overall (STATE)
- 87 Strongly Landlord-Friendly
- State Florida
- 87 Strongly Landlord-Friendly · R+3
- County
- — inherits STATE
- City
- — inherits STATE
ZIP-level market 33406
- Rents YoY
- 0.7%
- Active inventory
- 100
- Price-to-rent
- 9.5×
Monthly cashflow live
- Estimated rent
- $2,630 high interval (Pro) →
- Mortgage (P&I)
- −$1,568
- Tax from tax record
- −$78 /mo · $939/yr
- Insurance
- −$125
- HOA
- −$325
- Vacancy / Maint / Mgmt
- −$552
- Net cashflow
- $-18
Break-even live
Sensitivity live
| Price | -10% $151 | -5% $67 | +0% $-18 | +5% $-102 | +10% $-187 |
|---|---|---|---|---|---|
| Rent | -10% $-226 | -5% $-122 | +0% $-18 | +5% $86 | +10% $190 |
| Rate | -1.0pp $133 | -0.5pp $58 | base $-18 | +0.5pp $-95 | +1.0pp $-174 |
UW: 25.0% down · 7.5% · 30yr · 1.5% tax · 5.0% vac · 8.0% maint · 8.0% mgmt
Financing live
Cash to close
- Down payment
- $74,750
- Closing costs
- $8,970
- Reserves months
- —
- Total cash needed
- —
Loan-product check · same deal, 3 products live
Conventional
25% down · 7.5% · 30yr
- Down + closing
- —
- Monthly P&I
- —
- Monthly cashflow
- —
- DSCR
- —
- Eligible?
- —
Personal DTI + credit; lowest rate.
DSCR
20% down · 8.5% · 30yr
- Down + closing
- —
- Monthly P&I
- —
- Monthly cashflow
- —
- DSCR
- —
- Eligible?
- —
No personal income docs; deal must DSCR.
Hard money
10% down · 12.0% · 12mo
- Down + closing
- —
- Monthly P&I
- —
- Monthly cashflow
- —
- DSCR
- —
- Eligible?
- —
Short-term bridge; refi at stabilization.
Rent comps 9 comps
| Address | Beds | Baths | Sqft | Rent | $/sqft | DOM | Units | Dist |
|---|---|---|---|---|---|---|---|---|
| 1148 Summit Trail Cir Unit D West Palm Beach, FL | 3.0 | 2.0 | 1332 | $3,100 | $2.33 | 16d | 1 | 1.08mi |
| 1051 Summit Place Cir Unit D West Palm Beach, FL | 3.0 | 2.0 | 1332 | $2,600 | $1.95 | 26d | 1 | 1.20mi |
| 5360 Kim Ct West Palm Beach, FL | 3.0 | 2.0 | 1407 | $3,100 | $2.20 | 26d | 1 | 1.25mi |
| 1364 Climbing Rose Ln West Palm Beach, FL | 3.0 | 2.0 | 1492 | $2,700 | $1.81 | 26d | 1 | 1.39mi |
| 2200 Springdale Blvd #214 Palm Springs, FL | 1.0 | 1.5 | 756 | $1,550 | $2.05 | 4d | 1 | 1.46mi |
| 555 Kirk Rd Palm Springs, FL | 2.0 | 2.0 | 875 | $2,749 | $3.14 | 14d | 1 | 1.47mi |
| 555 Kirk Rd Palm Springs, FL | 2.0 | 2.0 | 875 | $3,194 | $3.65 | 24d | 1 | 1.47mi |
| 4591 Purdy Ln Unit 2 West Palm Beach, FL | 3.0 | 2.0 | 850 | $3,000 | $3.53 | 26d | 1 | 1.48mi |
| 4591 Purdy Ln Unit 1 West Palm Beach, FL | 2.0 | 1.0 | 900 | $2,350 | $2.61 | 26d | 1 | 1.48mi |
HOA detail
- Monthly dues
- $325 · $3,900/yr
Listing history 24 events
-
2026-06-21days on market $299,000 Active 84 DOM
-
2026-06-18days on market $299,000 Active 81 DOM
-
2026-06-17days on market $299,000 Active 80 DOM
-
2026-06-16days on market $299,000 Active 79 DOM
-
2026-06-15days on market $299,000 Active 78 DOM
-
2026-06-13days on market $299,000 Active 76 DOM
-
2026-06-09days on market $299,000 Active 72 DOM
-
2026-06-08days on market $299,000 Active 71 DOM
-
2026-06-07days on market $299,000 Active 70 DOM
-
2026-06-04days on market $299,000 Active 67 DOM
-
2026-06-03days on market $299,000 Active 66 DOM
-
2026-06-02days on market $299,000 Active 65 DOM
-
2026-06-01days on market $299,000 Active 64 DOM
-
2026-05-31days on market $299,000 Active 63 DOM
-
2026-04-13price $299,000
-
2026-03-29$330,000 Active
-
2004-11-24soldstatus $150,000
-
2004-11-22soldstatus $150 145-char remark
Show marketing remark (145 chars)
ONLY TWO YEARS NEW, EAT-IN-KITCHEN. TWO MASTER SUITES. NICE SIZE LIVING AREA, WASHER, DRYER IN UNIT. PRIVATE BACK AREA. PLEASE DO NOT LET CAT OUT
-
2004-11-01historical 145-char remark
Show marketing remark (145 chars)
ONLY TWO YEARS NEW, EAT-IN-KITCHEN. TWO MASTER SUITES. NICE SIZE LIVING AREA, WASHER, DRYER IN UNIT. PRIVATE BACK AREA. PLEASE DO NOT LET CAT OUT
-
2004-10-11$149,900 145-char remark
Show marketing remark (145 chars)
ONLY TWO YEARS NEW, EAT-IN-KITCHEN. TWO MASTER SUITES. NICE SIZE LIVING AREA, WASHER, DRYER IN UNIT. PRIVATE BACK AREA. PLEASE DO NOT LET CAT OUT
-
2002-01-22soldstatus $104,500
-
2002-01-11soldstatus $104,500 143-char remark
Show marketing remark (143 chars)
BEAUTIFUL BRAND NEW TWNHOUSE ,TILE THROUGHOUT EXCEPT BEDROOMS. CLOSE TO EVERYTHING. MUST SEE - QUICK SALE - SHOW IT - WILL SELL ITSELF. LOCKBOX
-
2002-01-01historical 143-char remark
Show marketing remark (143 chars)
BEAUTIFUL BRAND NEW TWNHOUSE ,TILE THROUGHOUT EXCEPT BEDROOMS. CLOSE TO EVERYTHING. MUST SEE - QUICK SALE - SHOW IT - WILL SELL ITSELF. LOCKBOX
-
2001-11-13$104,900 143-char remark
Show marketing remark (143 chars)
BEAUTIFUL BRAND NEW TWNHOUSE ,TILE THROUGHOUT EXCEPT BEDROOMS. CLOSE TO EVERYTHING. MUST SEE - QUICK SALE - SHOW IT - WILL SELL ITSELF. LOCKBOX
ⓘ Source: listings_history table (triggers on properties + properties_extension) + one-shot
backfill from property_details.listing_events for pre-trigger history.
Tax reassessment forecast FL · Resets to sale price
- Current annual tax
- $939 · $78/mo
- Projected year-2 tax
- $2,482 · $207/mo
- Expected delta
- +$1,543/yr (+$129/mo · 164.2%)
ⓘ Screening estimate from a state-policy table — verify with the county assessor before closing.
Climate risk First Street
- Flood 1/10 Low FEMA zone X (unshaded) · 0% chance over 30 yrs
- Wildfire 1/10 Low
- Heat 9/10 Extreme 3 d/yr ≥105°F today · 10 d/yr by 30 yrs out
- Wind 10/10 Extreme 99% chance of damaging wind over 30 yrs
- Air quality 2/10 Low 1 unhealthy d/yr today · 1 by 30 yrs out
Nearby sold comps map
Loading sold comps map…
Walkable amenities ~0.75 mi
Loading nearby amenities…
Taxation est. · year 1
- Rental income
- $31,564
- − Mortgage interest
- −$16,749
- − Property taxes
- −$939
- − Insurance
- −$1,495
- − Repairs & maintenance
- −$2,525
- − Management
- −$2,525
- − HOA
- −$3,900
- − Depreciation
- −$8,698
- Taxable loss
- −$5,267
- Est. tax savings @ 24.0%
- +$1,264
- After-tax cash flow
- $1,050/yr
For passive investors: Depreciation is non-cash, so a rental often shows a tax loss while cash-flowing — sheltering income. Rental losses are passive: they offset passive income freely, and up to $25,000/yr can offset ordinary (W-2) income if you actively participate and your MAGI is under $100k (phasing out to $0 by $150k); unused losses carry forward. On sale, claimed depreciation is recaptured at up to 25%, and gains may owe capital-gains tax (a 1031 exchange can defer both). Figures are a year-1 estimate at your 24.0% rate — not tax advice; consult a CPA.
Schools (NCES district)
- District
- Palm Beach
- NCES district ID
- 1201500
- Math proficiency
- 46% ▼ -16.00%
- Reading proficiency
- 53% ▼ -4.00%
- Median HH income
- $53,943
- Composite
- 42.72/100
- National rank
- #3160
- State rank
- #34 of 73 in FL
Livability — Pine Air
- Score
- 74/100
- State rank
- #270
- US rank
- #4410
Category grades
Schools grade is shown separately in the Schools card above.
Census & demographics
- County
- Palm Beach County · 1,438,312 people
- Metro
- Miami-Fort Lauderdale-Pompano Beach, FL
- Population (ZIP)
- 26,945
- Household income
- $77,075
- Rent vs Own
- Severe rent burden
- 768.0
Population outlook (Palm Beach County) Hauer SSP2
- Today (2025)
- 1,637,487 people
- By 2030
- 1,743,255 · +6.5%
- By 2040
- 1,948,712 · +19.0%
- By 2050
- 2,132,979 · +30.3%
- By 2075
- 2,530,027 · +54.5%
- By 2100
- 2,706,979 · +65.3%
Race, ethnicity, and origin ACS 2023
- Neighborhood character
- Diverse neighborhood (Simpson 0.59)
- Race & ethnicity
- Hispanic / Latino 54% White 33% Two or more races 29% Black 8% Asian 3%
- Hispanic origin (detail)
- Mexican 8% Puerto Rican 5% Cuban 17% Dominican 5% Salvadoran 1%
- Common ancestry
- Hispanic 3% Lithuanian 2% Romanian 1%
- Foreign-born
- 39% · Canada, Jamaica, Vietnam
- Languages at home
- 45% English-only · Spanish 49% French/Haitian/Cajun 2% Other Indo-European 1%
Political lean MEDSL · Palm Beach
- 2024 margin
- Toss-up / Even · D 50.0% · R 49.2%
- 2008→2024 swing
- -22.1pp toward R · 2008: 22.9pp · 2024: 0.8pp
- All cycles
- 2024: D+0.8 2020: D+12.8 2016: D+15.3 2012: D+17.0 2008: D+22.9
Not yet ingested
- Civics
- —
Market trends
- HPI YoY
- ▼ -384.39%
- Current HPI
- 441.2523
- Rent YoY
- ▲ 0.68%
- Metro
- Miami-Fort Lauderdale-Pompano Beach, FL
- State GDP YoY
- ▲ 3.28%
- F500 in state
- 36
Industry mix (Fortune 500 HQ in FL)
| Industry | F500 HQs | Revenue |
|---|---|---|
| Industrial Technology | 2 | $29B |
|
||
| Insurance | 2 | $17B |
|
||
| Retail | 1 | $60B |
|
||
| Technology Distribution | 1 | $58B |
|
||
| Homebuilding | 1 | $35B |
|
||
| Technology Manufacturing | 1 | $35B |
|
||
Price history
+185.0% since first listed10 events — show timeline
- 2026-04-13 Price Changed $299,000 Beaches MLS
- 2026-03-29 Listed $330,000 Beaches MLS
- 2004-11-24 Sold (Public Records) $150,000 Public Records
- 2004-11-22 Sold (MLS) $150 Beaches MLS
- 2004-11-01 Listing Removed — Beaches MLS
- 2004-10-11 Listed $149,900 Beaches MLS
- 2002-01-22 Sold (Public Records) $104,500 Public Records
- 2002-01-11 Sold (MLS) $104,500 Beaches MLS
- 2002-01-01 Listing Removed — Beaches MLS
- 2001-11-13 Listed $104,900 Beaches MLS
Property tax history
+0.8%/yrLatest (2025): $939 · +2.4% YoY. Source: county tax records.
Cash-flow waterfall
monthlySold comps — $/sqft
last 12 mo · ≤1 miLoading sold comps…