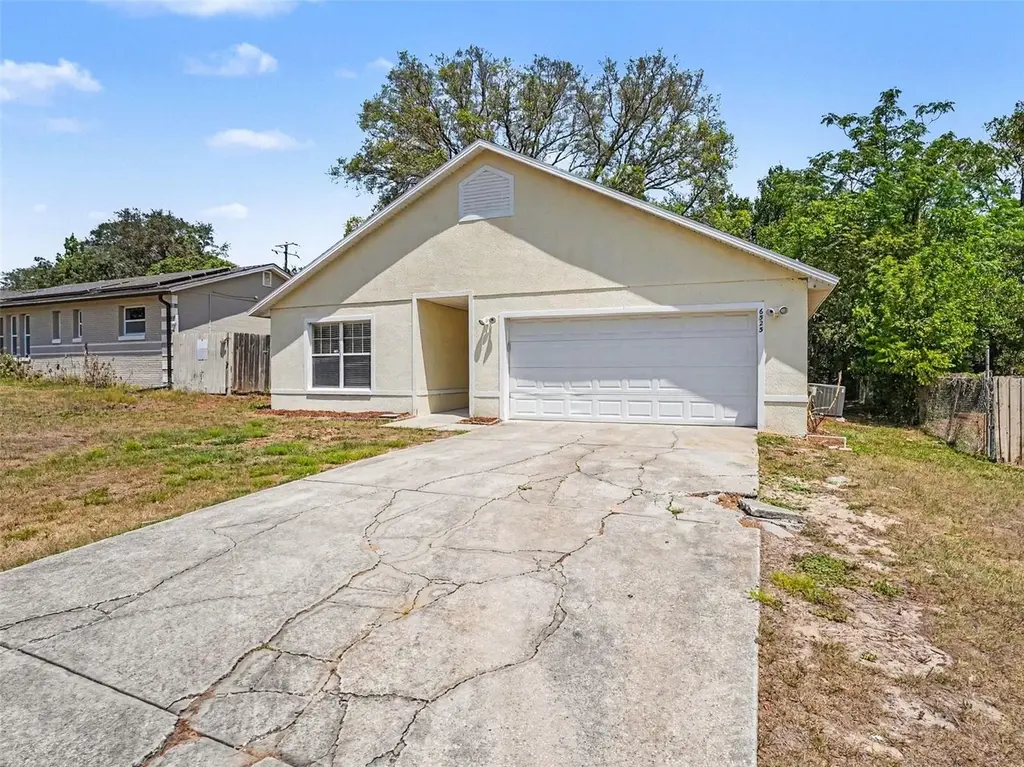
6525 Aladdin Dr · Pine Hills, FL
Flood risk 1/10 · Minimal
- FEMA flood zone
- X (unshaded)
- Chance of flooding over 30 yrs
- 0.0%
- Est. flood insurance / yr
- $507 – $1,088
Fire risk 1/10 · Minimal
- Est. fire insurance / yr
- $947 – $1,759
Heat risk 9/10 · Severe
- Hot days now (above 108°F)
- 7 days/yr
- Hot days in 30 yrs
- 23 days/yr
Wind risk 9/10 · Severe
- Chance of severe wind over 30 yrs
- 99.0%
Air-quality risk 1/10 · Minimal
- Unhealthy air days now
- 0 days/yr
- Unhealthy air days in 30 yrs
- 0 days/yr
Risk factors via First Street. Map © Google.
Why this score? — see what drove the D+ grade
The composite is a weighted blend of 9 inputs, each scored 0–100. Each bar is that input's sub-score; the figure is the points it added to the 100-point composite (weight × sub-score).
- Cash flow +14.3/30.0
- ARV discount +13.2/15.0
- DSCR +4.4/10.0
- 1% rule +4.3/10.0
- Schools +4.1/10.0
- Livability +3.7/5.0
- Condition / age +2.5/5.0
- Rent growth +1.8/5.0
- Appreciation +0.0/10.0
$244,900
🖨 Deal sheet (PDF) 📄 Offer letter ✓ Due diligence
Listing remarks MLS
SHORT SALE- well kept home built in 2001. Vaulted ceilings, split floor plan.
Key facts
- 8,273 sq ft lot
- 2 garage spots
- Built 2001
Property features AI
Finance
- Other: Property type: Residential - Single Family Residence; Zoning: R-1AA; Lot about 0.19 acre (0 to less than 1/4 acre)
- HOA & community: Pets allowed
Exterior
- Parking: Attached garage; 2-car garage
- Utilities: Public water; Public sewer; Cable available; Electricity available
- Home design: Single family residence; One story; Home faces south
- Construction: Block, stone and frame construction; Shingle roof; Slab foundation; Built with public records living area of 1298 sq ft
- Exterior features: Covered patio/porch; Deck; Patio; Porch; French doors; Exterior lighting; Private mailbox; Rain gutters; Sliding doors; Level, paved lot in county
Interior
- Kitchen: Disposal; Stone countertops
- Bedrooms: 3 bedrooms
- Flooring: Carpet; Ceramic tile
- Bathrooms: 2 full bathrooms
- Heating & cooling: Central heating; Central air conditioning
- Interior features: Ceiling fans; Stone countertops; Walk-in closets; Disposal; Family room
- Laundry & utility: Laundry room; Laundry in kitchen
Neighborhood map
What this means for you Summary
Snapshot
- This is a 3-bed/2.0-bath single-family listed at $245k.
Deal economics
- At list price, monthly cash flow is $45 ($541/yr) — positive.
- The deal already cash-flows at list — no discount required.
- To meet the 1% rule (rent ≥ 1% of price), the offer needs to be $228k (6.8% below list).
- Recommended offer: $228k (6.8% below list) — sets the bar for 1% rule.
- Cap rate 6.5% vs local median 4.8% in Pine Hills — top-decile yield for the area; either an underpriced asset or a hidden risk that comps aren't pricing in. Stress-test before assuming the spread holds.
Location & tenants
- Location reads 73/100 on livability (#317 in FL) — a middle-class / working-renter tenant base. Strengths: commute A+, cost of living A+, housing A+; Watch: crime D+, employment D, amenities F.
- Orange (suburban): math 46% / reading 51% proficiency, ranked #43 of 73 in FL (top 59%) — families likely to look elsewhere, expect single-tenant / working-renter base with shorter leases.
- Zoned schools: Lake Gem Elementary (math 32% / reading 36%, grade F, #1,744 of 2,144 statewide, top 82%, 566 students, 71% FRL); Meadowbrook Middle (math 24% / reading 24%, grade F, #532 of 571 statewide, top 94%, 957 students, 78% FRL); Maynard Evans High (math 12% / reading 27%, grade F, #562 of 667 statewide, top 85%, 2,417 students, 69% FRL) — zoned schools average 73% FRL vs 56% district-wide (16 pts higher); higher-poverty schools than district average — tighter screening recommended.
- Zoned-school proficiency averages 26% at this address vs 48% district-wide (-23 pts) — the specific schools serving this property underperform the Orange average; the district grade overstates school quality for this exact location.
- Market conditions: Rents soft (-2.7%/yr); 181 active listings in the ZIP; 14 comparable units currently listed for rent nearby; rentals at typical pace (median 20d on market — plan ~3-4 weeks tenant-placement turnaround); 8,053 units permitted in Orange County in 2024 (3,133 in 5+ unit buildings).
- This rent runs 43% of the median local income ($63k/yr) — at the standard rent-burdened threshold; future hikes will face affordability resistance.
Forward outlook
- Local home prices are declining (-3.0%/yr); year-one equity from $2k of loan paydown is wiped out by about $7k of value loss. Plan a longer hold.
- Orange County population projected at +52% by 2050 — long-run rental-demand tailwind backs the buy-and-hold thesis.
Negotiation context
- Only 14 days on market — expect competitive offers; lowballing is unlikely to land.
- 2 sale attempts since 15y ago with the ask held roughly flat each time — persistent listings suggest the price (not the market) is what's stuck; bring a comps-based counter.
- Current owner paid $102k; list at $245k implies a 139% gain — meaningful room to come down on a strong offer.
Risks & watch-outs
- Climate carrying-cost: severe wind risk, 99% chance of damaging wind over 30y; extreme-heat days projected 7→23/yr by 2055 (HVAC capex compounding) — expect insurance premiums to compound above CPI over the hold.
Questions for the listing agent
- Is there a deadline driving the sale (1031 exchange, divorce, estate, relocation)? That informs how much negotiation room exists.
- Schools are B-rated — typically a magnet for longer-tenancy family renters. What's the average tenant stay here, and is there a school-zone premium baked into asking?
- Crime grade is D in this area — have there been break-ins, vandalism, or insurance claims at this property in the last 3 years? What carrier currently insures it and at what premium?
- The area grade is low — what's the realistic commute time and amenity access for the typical tenant pool here? Any planned neighborhood developments (good or bad) we should know about?
- What's the average days-on-market for RENTAL listings here right now (not sales)? A rising rental-DOM trend means longer vacancies and softer asking-rent achievability than the comps imply.
- What's the recent tenant-quality profile in this submarket — average credit score on applications, eviction rate, late-payment / NSF rate, and stable-employment percentage? A property-management company in the area should have these aggregated.
- How much new for-sale + rental construction is in the pipeline within 1–3 miles? Heavy new supply typically softens prices + rents 12–24 months out; constrained supply supports both.
Investment metrics
- 1% rule
- 0.93% ✗
- Cap rate
- 6.51%
- Cash-on-cash
- 0.79%
- DSCR
- 1.04
- GRM
- 8.9
CMA / ARV
- ARV (on-the-fly)
- $280,368
- Comps found
- 11
Show comp detail 11 sales within ~0.75 mi
| Address | Dist | Beds/Ba | Sqft | Sold | Price | $/sf | Match |
|---|---|---|---|---|---|---|---|
| 5342 Broken Pine Cir | 0.38mi | 3/2.0 | 1,210 (-7%) | 0mo | $325,000 | $269 | 71 |
| 6311 Boylston Way | 0.57mi | 3/2.0 | 1,342 (+3%) | 2mo | $287,000 | $214 | 66 |
| 6807 Galle Ct | 0.13mi | 3/2.0 | 1,475 (+14%) | 10mo | $178,000 | $121 | 63 |
| 6911 Crescent Ridge Rd | 0.58mi | 3/2.0 | 1,366 (+5%) | 3mo | $360,000 | $264 | 62 |
| 5915 Groveline Dr | 0.44mi | 3/2.0 | 1,448 (+12%) | 4mo | $270,000 | $186 | 57 |
| 5555 Chatham Woods Ct | 0.46mi | 3/2.0 | 1,264 (-3%) | 21mo | $345,000 | $273 | 57 |
| 5502 Park Hurst Dr | 0.54mi | 3/2.0 | 1,436 (+11%) | 4mo | $310,000 | $216 | 54 |
| 6233 Sparling Hills Cir | 0.64mi | 3/2.0 | 1,352 (+4%) | 15mo | $280,000 | $207 | 50 |
| 7125 Clarcona Ocoee Rd | 0.66mi | 3/2.0 | 1,352 (+4%) | 23mo | $299,950 | $222 | 43 |
| 6830 Merganser Dr | 0.73mi | 3/2.0 | 1,457 (+12%) | 4mo | $336,000 | $231 | 42 |
| 7131 Clarcona Ocoee Rd | 0.69mi | 3/2.0 | 1,444 (+11%) | 10mo | $262,500 | $182 | 41 |
Match score weights: distance 35% · size 25% · config 20% · recency 20%. Top-matched comps best support the ARV.
Projected returns pro-forma
-3.0% appreciation · 0.0% rent growth · sell at horizon
- IRR
- -18.6%
- Equity multiple
- 0.37×
- Total profit
- $-43,429
- Equity at exit
- $36,515
- IRR
- -18.9%
- Equity multiple
- 0.13×
- Total profit
- $-59,676
- Equity at exit
- $21,174
Cash invested: $68,572 (down + closing). Projections, not guarantees.
Landlord ↔ Tenant lean methodology
- Overall (STATE)
- 87 Strongly Landlord-Friendly
- State Florida
- 87 Strongly Landlord-Friendly · R+3
- County
- — inherits STATE
- City
- — inherits STATE
ZIP-level market 32818
- Home prices YoY
- -22.5%
- Rents YoY
- -2.7%
- Active inventory
- 181
- Price-to-rent
- 8.9×
Monthly cashflow live
- Estimated rent
- $2,284 high interval (Pro) →
- Mortgage (P&I)
- −$1,284
- Tax from tax record
- −$373 /mo · $4,471/yr
- Insurance
- −$102
- HOA
- −$0
- Vacancy / Maint / Mgmt
- −$480
- Net cashflow
- $45
Break-even live
Sensitivity live
| Price | -10% $184 | -5% $114 | +0% $45 | +5% $-24 | +10% $-94 |
|---|---|---|---|---|---|
| Rent | -10% $-135 | -5% $-45 | +0% $45 | +5% $135 | +10% $225 |
| Rate | -1.0pp $168 | -0.5pp $107 | base $45 | +0.5pp $-18 | +1.0pp $-83 |
UW: 25.0% down · 7.5% · 30yr · 1.5% tax · 5.0% vac · 8.0% maint · 8.0% mgmt
Financing live
Cash to close
- Down payment
- $61,225
- Closing costs
- $7,347
- Reserves months
- —
- Total cash needed
- —
Loan-product check · same deal, 3 products live
Conventional
25% down · 7.5% · 30yr
- Down + closing
- —
- Monthly P&I
- —
- Monthly cashflow
- —
- DSCR
- —
- Eligible?
- —
Personal DTI + credit; lowest rate.
DSCR
20% down · 8.5% · 30yr
- Down + closing
- —
- Monthly P&I
- —
- Monthly cashflow
- —
- DSCR
- —
- Eligible?
- —
No personal income docs; deal must DSCR.
Hard money
10% down · 12.0% · 12mo
- Down + closing
- —
- Monthly P&I
- —
- Monthly cashflow
- —
- DSCR
- —
- Eligible?
- —
Short-term bridge; refi at stabilization.
Rent comps 14 comps
| Address | Beds | Baths | Sqft | Rent | $/sqft | DOM | Units | Dist |
|---|---|---|---|---|---|---|---|---|
| 6933 Rembrandt Dr Orlando, FL | 4.0 | 2.0 | 1628 | $2,500 | $1.54 | 19d | 1 | 0.23mi |
| 6138 Ranier Dr Orlando, FL | 3.0 | 2.0 | 1314 | $1,980 | $1.51 | 22d | 1 | 0.58mi |
| 5632 Lunsford Dr Orlando, FL | 4.0 | 2.0 | 1250 | $2,295 | $1.84 | 24d | 1 | 0.60mi |
| 7232 Lazy Hill Dr Unit 1545829P Orlando, FL | 3.0 | 2.0 | 1216 | $3,122 | $2.57 | 16d | 1 | 0.60mi |
| 7224 Valiant Ct Orlando, FL | 3.0 | 1.0 | 1160 | $1,950 | $1.68 | 19d | 1 | 0.74mi |
| 6560 Whirlaway Cir Unit -1 Orlando, FL | 3.0 | 2.0 | 1530 | $2,150 | $1.41 | 6d | 1 | 0.92mi |
| 6556 Viewpoint Ct Orlando, FL | 3.0 | 2.0 | 1300 | $1,941 | $1.49 | 0d | 1 | 0.98mi |
| 4006 Luan Dr Orlando, FL | 3.0 | 2.0 | 1717 | $2,095 | $1.22 | 26d | 1 | 1.06mi |
| 6433 Sardina Blvd Orlando, FL | 3.0 | 2.0 | 1590 | $2,230 | $1.40 | 26d | 1 | 1.10mi |
| 3723 Narroline Dr Orlando, FL | 3.0 | 2.0 | 1370 | $2,000 | $1.46 | 9d | 1 | 1.30mi |
| 3723 Narroline Dr Orlando, FL | 3.0 | 2.0 | 1370 | $2,000 | $1.46 | 0d | 1 | 1.30mi |
| 5419 Stirrup Way Orlando, FL | 3.0 | 2.0 | 1420 | $2,000 | $1.41 | 26d | 1 | 1.38mi |
| 3639 Shalimar Ct Orlando, FL | 4.0 | 2.0 | 1136 | $1,796 | $1.58 | 24d | 1 | 1.38mi |
| 9301 Summit Dr Orlando, FL | 3.0 | 1.0–2.0 | 1012 | $2,495 | $2.47 | 0d | 48 | 1.48mi |
Listing history 8 events
-
2026-05-18status Pending
-
2026-05-04$244,900 Active
-
2013-04-24soldstatus $102,446
-
2011-08-08soldstatus $55,000
-
2011-07-06soldstatus $55,000 77-char remark
Show marketing remark (77 chars)
SHORT SALE- well kept home built in 2001. Vaulted ceilings, split floor plan.
-
2011-03-15$79,900 77-char remark
Show marketing remark (77 chars)
SHORT SALE- well kept home built in 2001. Vaulted ceilings, split floor plan.
-
2001-08-22soldstatus $98,500
-
1976-06-01soldstatus $179,900
ⓘ Source: listings_history table (triggers on properties + properties_extension) + one-shot
backfill from property_details.listing_events for pre-trigger history.
Tax reassessment forecast FL · Resets to sale price
- Current annual tax
- $4,471 · $373/mo
- Projected year-2 tax
- $4,471 · $373/mo
- Expected delta
- $0/yr ($0/mo · 0.0%)
ⓘ Screening estimate from a state-policy table — verify with the county assessor before closing.
Climate risk First Street
- Flood 1/10 Low FEMA zone X (unshaded) · 0% chance over 30 yrs
- Wildfire 1/10 Low
- Heat 9/10 Extreme 7 d/yr ≥108°F today · 23 d/yr by 30 yrs out
- Wind 9/10 Extreme 99% chance of damaging wind over 30 yrs
- Air quality 1/10 Low 0 unhealthy d/yr today · 0 by 30 yrs out
Nearby sold comps map
Loading sold comps map…
Walkable amenities ~0.75 mi
Loading nearby amenities…
Taxation est. · year 1
- Rental income
- $27,403
- − Mortgage interest
- −$13,718
- − Property taxes
- −$4,471
- − Insurance
- −$1,224
- − Repairs & maintenance
- −$2,192
- − Management
- −$2,192
- − Depreciation
- −$7,124
- Taxable loss
- −$3,520
- Est. tax savings @ 24.0%
- +$845
- After-tax cash flow
- $1,386/yr
For passive investors: Depreciation is non-cash, so a rental often shows a tax loss while cash-flowing — sheltering income. Rental losses are passive: they offset passive income freely, and up to $25,000/yr can offset ordinary (W-2) income if you actively participate and your MAGI is under $100k (phasing out to $0 by $150k); unused losses carry forward. On sale, claimed depreciation is recaptured at up to 25%, and gains may owe capital-gains tax (a 1031 exchange can defer both). Figures are a year-1 estimate at your 24.0% rate — not tax advice; consult a CPA.
Schools (NCES district)
- District
- Orange
- NCES district ID
- 1201440
- Math proficiency
- 46% ▼ -9.00%
- Reading proficiency
- 51% ▼ -2.00%
- Median HH income
- $49,350
- Composite
- 41.47/100
- National rank
- #3461
- State rank
- #43 of 73 in FL
Livability — Pine Hills
- Score
- 73/100
- State rank
- #317
- US rank
- #5362
Category grades
Schools grade is shown separately in the Schools card above.
Census & demographics
- Census place
- Pine Hills, FL
- County
- Orange County · 1,471,359 people
- City population
- 60,203
- Metro
- Orlando-Kissimmee-Sanford, FL
- Population (ZIP)
- 59,114
- Household income
- $63,061
- Rent vs Own
- Severe rent burden
- 2059.0
Population outlook (Orange County) Hauer SSP2
- Today (2025)
- 1,618,226 people
- By 2030
- 1,787,404 · +10.5%
- By 2040
- 2,125,621 · +31.4%
- By 2050
- 2,454,016 · +51.6%
- By 2075
- 3,173,711 · +96.1%
- By 2100
- 3,607,781 · +122.9%
Race, ethnicity, and origin ACS 2023
- Neighborhood character
- Predominantly Black (69%)
- Race & ethnicity
- Black 69% Hispanic / Latino 14% White 10% Two or more races 6% Asian 3%
- Hispanic origin (detail)
- Mexican 3% Puerto Rican 5% Cuban 1%
- Common ancestry
- Hispanic 21% Estonian 1% Romanian 1%
- Foreign-born
- 40% · Canada, Vietnam, China
- Languages at home
- 59% English-only · French/Haitian/Cajun 25% Spanish 11% Vietnamese 2%
Political lean MEDSL · Orange
- 2024 margin
- D (+13.6) · D 56.1% · R 42.5% · Other 1.3%
- 2008→2024 swing
- -5.0pp toward R · 2008: 18.6pp · 2024: 13.6pp
- All cycles
- 2024: D+13.6 2020: D+23.1 2016: D+24.6 2012: D+18.2 2008: D+18.6
Not yet ingested
- Civics
- —
Market trends
- HPI YoY
- ▼ -93.40%
- Current HPI
- 321.5821
- Rent YoY
- ▼ -2.66%
- Metro
- Orlando-Kissimmee-Sanford, FL
- State GDP YoY
- ▲ 3.28%
- F500 in state
- 36
Industry mix (Fortune 500 HQ in FL)
| Industry | F500 HQs | Revenue |
|---|---|---|
| Industrial Technology | 2 | $29B |
|
||
| Insurance | 2 | $17B |
|
||
| Retail | 1 | $60B |
|
||
| Technology Distribution | 1 | $58B |
|
||
| Homebuilding | 1 | $35B |
|
||
| Technology Manufacturing | 1 | $35B |
|
||
Price history
+36.1% since first listed8 events — show timeline
- 2026-05-18 Pending — Stellar MLS as Distributed by MLS Grid
- 2026-05-04 Listed $244,900 Stellar MLS as Distributed by MLS Grid
- 2013-04-24 Sold (Public Records) $102,446 Public Records
- 2011-08-08 Sold (Public Records) $55,000 Public Records
- 2011-07-06 Sold (MLS) $55,000 Stellar MLS as Distributed by MLS Grid
- 2011-03-15 Listed $79,900 Stellar MLS as Distributed by MLS Grid
- 2001-08-22 Sold (Public Records) $98,500 Public Records
- 1976-06-01 Sold (Public Records) $179,900 Public Records
Property tax history
+9.2%/yrLatest (2025): $4,471 · +9.3% YoY. Source: county tax records.
Cash-flow waterfall
monthlySold comps — $/sqft
last 12 mo · ≤1 miLoading sold comps…