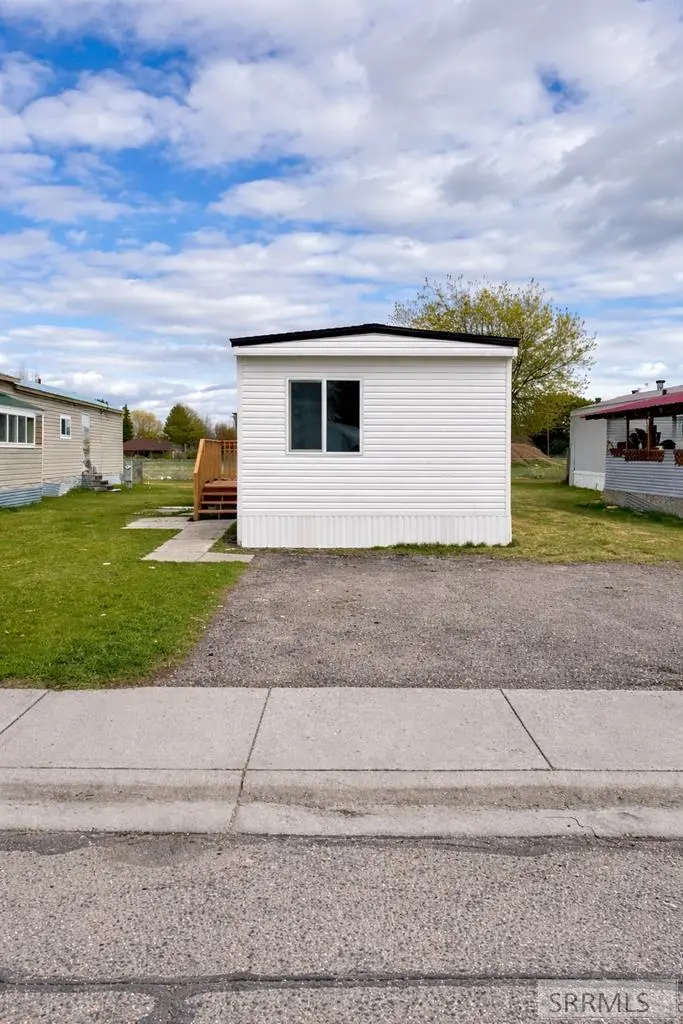
275 W Oak St #55 · Shelley, ID
Flood risk No data
- FEMA flood zone
- —
- Chance of flooding over 30 yrs
- —
- Est. flood insurance / yr
- —
Fire risk No data
- Est. fire insurance / yr
- —
Heat risk No data
- Hot days now (above threshold)
- —
- Hot days in 30 yrs
- —
Wind risk No data
- Chance of severe wind over 30 yrs
- —
Air-quality risk No data
- Unhealthy air days now
- —
- Unhealthy air days in 30 yrs
- —
Risk factors via First Street. Map © Google.
Why this score? — see what drove the B grade
The composite is a weighted blend of 9 inputs, each scored 0–100. Each bar is that input's sub-score; the figure is the points it added to the 100-point composite (weight × sub-score).
- Cash flow +30.0/30.0
- DSCR +10.0/10.0
- 1% rule +8.8/10.0
- ARV discount +7.5/15.0
- Schools +4.1/10.0
- Condition / age +4.0/5.0
- Livability +3.6/5.0
- Rent growth +2.5/5.0
- Appreciation +0.0/10.0
$65,000
🖨 Deal sheet 📄 Offer letter ✓ Due diligence
Listing remarks
Located at 275 W Oak St #55 in Shelley, this 3-bedroom, 1-bath manufactured home offers an affordable and move-in ready opportunity with several recent updates already completed. Major improvements include new siding, a new roof, and a brand new HVAC system, along with updated flooring and fresh interior paint throughout. The kitchen features ample cabinet space, an island, and includes a range/oven and refrigerator. Outside, you have an established yard, with no direct backyard neighbors. Conveniently located near a park and with quick access to the old highway for commuting. Schedule your showing today! Lot rent is $475 per month.
Key facts
- New siding
- Updated flooring
- Ample cabinet space
Tags
Property features AI
Exterior
- Parking: Concrete parking area
- Utilities: Public water; Public sewer
- Home design: One level; Single-story manufactured home; Manufactured home without land
- Construction: Vinyl siding
- Exterior features: Concrete parking
Interior
- Kitchen: Refrigerator
- Flooring: Carpet; Vinyl
- Bathrooms: 1 full bathroom
- Heating & cooling: Forced air heating
- Interior features: Refrigerator included; Crawl space basement
Neighborhood map
What this means for you Summary
Snapshot
- This is a 3-bed/1.0-bath manufactured listed at $65k. Condition is rated good.
Deal economics
- At list price, monthly cash flow is $261 ($3k/yr) — positive.
- The deal already cash-flows at list — no discount required.
- Meets the 1% rule at list price ($899 rent vs $65k).
- Recommended offer: $63k (3.0% below list) — sets the bar for market timing.
Location & tenants
- Location reads 72/100 on livability (#46 in ID) — a middle-class / working-renter tenant base. Strengths: cost of living A+, housing A+, crime A-; Watch: health & safety C-, schools D+, amenities F.
- Shelley Joint District (town): math 40% / reading 56% proficiency, ranked #39 of 92 in ID (top 42%) — families likely to look elsewhere, expect single-tenant / working-renter base with shorter leases.
- Market conditions: 141 active listings in the ZIP; 1 comparable units currently listed for rent nearby; 251 units permitted in Bingham County in 2024 (0 in 5+ unit buildings).
Forward outlook
- Local home prices are declining (-3.0%/yr); year-one equity from $449 of loan paydown is wiped out by about $2k of value loss. Plan a longer hold.
- Bingham County population projected at -23% by 2050 — secular population decline; favor cash flow + early exit over multi-decade hold.
- At projected returns (-3.0% appreciation + 3.0% rent growth), your $18k cash investment doubles in ~7 years — after that, you're playing with house money.
Negotiation context
- It's been on market 52 days — a 3% lower offer ($63k) is reasonable based on typical stale-listing flexibility.
- 2 sale attempts; this cycle's ask has dropped $5k (7%) from the opening price — seller is motivated, your offer sets the floor, not the list.
Questions for the listing agent
- It's been on market 52 days. Have you received any prior offers? Is the seller open to a 3% concession, seller financing, or rate buy-down credit?
- Is there a deadline driving the sale (1031 exchange, divorce, estate, relocation)? That informs how much negotiation room exists.
- Schools are D-rated, which usually means shorter tenancies and higher turnover. Who's the typical renter profile here, and what's been the actual vacancy rate?
- What's the average days-on-market for RENTAL listings here right now (not sales)? A rising rental-DOM trend means longer vacancies and softer asking-rent achievability than the comps imply.
- What's the recent tenant-quality profile in this submarket — average credit score on applications, eviction rate, late-payment / NSF rate, and stable-employment percentage? A property-management company in the area should have these aggregated.
- How much new for-sale + rental construction is in the pipeline within 1–3 miles? Heavy new supply typically softens prices + rents 12–24 months out; constrained supply supports both.
Investment metrics
- 1% rule
- 1.38% ✓
- Cap rate
- 11.11%
- Cash-on-cash
- 17.21%
- DSCR
- 1.77
- GRM
- 6.0
CMA / ARV
No comps found within radius.
Projected returns pro-forma
-3.0% appreciation · 3.0% rent growth · sell at horizon
- IRR
- 8.5%
- Equity multiple
- 1.34×
- Total profit
- $6,105
- Equity at exit
- $9,692
- IRR
- 17.8%
- Equity multiple
- 2.47×
- Total profit
- $26,777
- Equity at exit
- $5,620
Cash invested: $18,200 (down + closing). Projections, not guarantees.
Landlord ↔ Tenant lean methodology
- Overall (STATE)
- 91 Strongly Landlord-Friendly
- State Idaho
- 91 Strongly Landlord-Friendly · R+18
- County
- — inherits STATE
- City
- — inherits STATE
ZIP-level market 83274
- Active inventory
- 141
- Price-to-rent
- 6.0×
Monthly cashflow live
- Estimated rent
- $899 medium interval (Pro) →
- Mortgage (P&I)
- −$341
- Tax est. 1.5%
- −$81 /mo · $975/yr
- Insurance
- −$27
- HOA
- −$0
- Vacancy / Maint / Mgmt
- −$189
- Net cashflow
- $261
Break-even live
UW: 25.0% down · 7.5% · 30yr · 1.5% tax · 5.0% vac · 8.0% maint · 8.0% mgmt
Financing live
Cash to close
- Down payment
- $16,250
- Closing costs
- $1,950
- Reserves months
- —
- Total cash needed
- —
Loan-product check · same deal, 3 products live
Conventional
25% down · 7.5% · 30yr
- Down + closing
- —
- Monthly P&I
- —
- Monthly cashflow
- —
- DSCR
- —
- Eligible?
- —
Personal DTI + credit; lowest rate.
DSCR
20% down · 8.5% · 30yr
- Down + closing
- —
- Monthly P&I
- —
- Monthly cashflow
- —
- DSCR
- —
- Eligible?
- —
No personal income docs; deal must DSCR.
Hard money
10% down · 12.0% · 12mo
- Down + closing
- —
- Monthly P&I
- —
- Monthly cashflow
- —
- DSCR
- —
- Eligible?
- —
Short-term bridge; refi at stabilization.
Rent comps 1 comps
| Address | Beds | Baths | Sqft | Rent | $/sqft | DOM | Units | Dist |
|---|---|---|---|---|---|---|---|---|
| 347 E Center St Shelley, ID | 2.0 | 1.0 | 925 | $899 | $0.97 | 21d | 1 | 0.61mi |
Listing history 11 events
-
2026-06-08status $65,000 Pending 52 DOM
-
2026-06-07days on market $65,000 Active 52 DOM
-
2026-06-05days on market $65,000 Active 49 DOM
-
2026-06-02days on market $65,000 Active 47 DOM
-
2026-06-01days on market $65,000 Active 46 DOM
-
2026-05-31days on market $65,000 Active 45 DOM
-
2026-05-30days on market $65,000 Active 44 DOM
-
2026-05-09status Active
-
2026-04-29status Pending
-
2026-04-27price $65,000
-
2026-04-06$70,000 Active
ⓘ Source: listings_history table (triggers on properties + properties_extension) + one-shot
backfill from property_details.listing_events for pre-trigger history.
Nearby sold comps map
Loading sold comps map…
Walkable amenities ~0.75 mi
Loading nearby amenities…
Taxation est. · year 1
- Rental income
- $10,788
- − Mortgage interest
- −$3,641
- − Property taxes
- −$975
- − Insurance
- −$325
- − Repairs & maintenance
- −$863
- − Management
- −$863
- − Depreciation
- −$1,891
- Taxable income
- $2,230
- Est. tax owed @ 24.0%
- −$535
- After-tax cash flow
- $2,597/yr
For passive investors: Depreciation is non-cash, so a rental often shows a tax loss while cash-flowing — sheltering income. Rental losses are passive: they offset passive income freely, and up to $25,000/yr can offset ordinary (W-2) income if you actively participate and your MAGI is under $100k (phasing out to $0 by $150k); unused losses carry forward. On sale, claimed depreciation is recaptured at up to 25%, and gains may owe capital-gains tax (a 1031 exchange can defer both). Figures are a year-1 estimate at your 24.0% rate — not tax advice; consult a CPA.
Condition & rehab AI · 12 photos
This move-in ready manufactured home has recently undergone several updates, including new siding, roof, HVAC, and interior finishes, making it an attractive investment opportunity.
Value-add opportunities
- Both Paint exterior siding — Enhances curb appeal and value.
- Both Replace carpet with hardwood or tile — Improves aesthetics and is durable.
- Both Install new windows — Better energy efficiency and view.
Renovation cost estimate screening
Value-add ROI direction
- Both Paint exterior siding — Enhances curb appeal and value. ↑
- Both Replace carpet with hardwood or tile — Improves aesthetics and is durable. ↑
- Both Install new windows — Better energy efficiency and view. ↑
ⓘ Cost ranges are severity-bucket heuristics (US national rule-of-thumb). Get contractor quotes + a written scope before underwriting a rehab budget.
Schools (NCES district)
- District
- Shelley Joint District
- NCES district ID
- 1602910
- Math proficiency
- 40% ▼ -2.00%
- Reading proficiency
- 56% ▲ 4.00%
- Median HH income
- $53,142
- Composite
- 41.36/100
- National rank
- #3492
- State rank
- #39 of 92 in ID
Livability — Shelley
- Score
- 72/100
- State rank
- #46
- US rank
- #6231
Category grades
Schools grade is shown separately in the Schools card above.
Census & demographics
- Census place
- Shelley, ID
- Population (ZIP)
- 11,284
Population outlook (Bingham County) Hauer SSP2
- Today (2025)
- 42,176 people
- By 2030
- 40,396 · -4.2%
- By 2040
- 36,693 · -13.0%
- By 2050
- 32,485 · -23.0%
- By 2075
- 21,927 · -48.0%
- By 2100
- 12,716 · -69.9%
Race, ethnicity, and origin ACS 2023
- Neighborhood character
- Predominantly White (86%)
- Race & ethnicity
- White 86% Hispanic / Latino 9% Two or more races 6%
- Hispanic origin (detail)
- Mexican 7%
- Common ancestry
- Italian 4% Slovak 2% Lithuanian 2%
- Foreign-born
- 4% · Canada
- Languages at home
- 90% English-only · Spanish 8% Vietnamese 1%
Political lean MEDSL · Bingham
- 2024 margin
- Solid R (+59.6) · D 18.8% · R 78.4% · Other 2.8%
- 2008→2024 swing
- -14.1pp toward R · 2008: -45.5pp · 2024: -59.6pp
- All cycles
- 2024: R+59.6 2020: R+55.6 2016: R+48.0 2012: R+54.6 2008: R+45.5
Not yet ingested
- Civics
- —
Market trends
- HPI YoY
- ▼ -156.20%
- Current HPI
- 272.7901
- Rent YoY
- —
- Metro
- —
- State GDP YoY
- ▲ 4.51%
- F500 in state
- 6
Industry mix (Fortune 500 HQ in ID)
| Industry | F500 HQs | Revenue |
|---|---|---|
| Retail | 1 | $79B |
|
||
| Technology | 1 | $25B |
|
||
| Food / Agriculture | 1 | $6B |
|
||
Price history
-7.1% since first listed4 events — show timeline
- 2026-05-09 Relisted — SRMLS
- 2026-04-29 Pending — SRMLS
- 2026-04-27 Price Changed $65,000 SRMLS
- 2026-04-06 Listed $70,000 SRMLS
Cash-flow waterfall
monthlySold comps — $/sqft
last 12 mo · ≤1 miLoading sold comps…