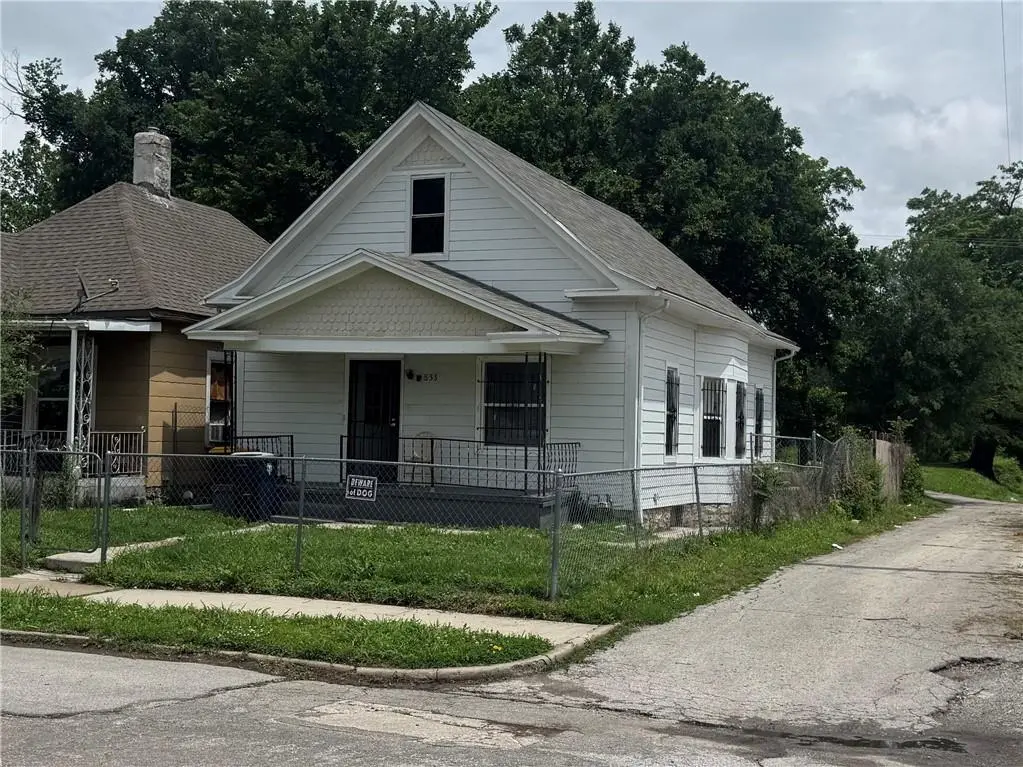
533 Drury Ave · Kansas City, MO
Flood risk 1/10 · Minimal
- FEMA flood zone
- X (unshaded)
- Chance of flooding over 30 yrs
- 0.0%
- Est. flood insurance / yr
- $473 – $860
Fire risk 3/10 · Minor
- Est. fire insurance / yr
- $1,054 – $1,958
Heat risk 4/10 · Minor
- Hot days now (above 106°F)
- 7 days/yr
- Hot days in 30 yrs
- 17 days/yr
Wind risk 2/10 · Minimal
- Chance of severe wind over 30 yrs
- —
Air-quality risk 3/10 · Minor
- Unhealthy air days now
- 2 days/yr
- Unhealthy air days in 30 yrs
- 3 days/yr
Risk factors via First Street. Map © Google.
Why this score? — see what drove the C+ grade
The composite is a weighted blend of 9 inputs, each scored 0–100. Each bar is that input's sub-score; the figure is the points it added to the 100-point composite (weight × sub-score).
- Cash flow +27.7/30.0
- DSCR +9.8/10.0
- ARV discount +7.5/15.0
- 1% rule +6.8/10.0
- Livability +3.9/5.0
- Rent growth +2.5/5.0
- Condition / age +2.5/5.0
- Schools +1.5/10.0
- Appreciation +0.0/10.0
$90,000
🖨 Deal sheet (PDF) 📄 Offer letter ✓ Due diligence
Listing remarks MLS
Great opportunity for a first-time buyer or investor looking to grow their rental portfolio! Clean with good bones, original hardwoods in main living areas and primary bedroom, plus newer wood-like tile flooring in kitchen and bathroom. Large kitchen and bathroom, and nicely-sized fenced lot. Close to highway access, numerous parks, the VA Medical Center, and more.
Key facts
- 4,317 sq ft lot
- Built 1909
- Listed 10 days
Property features AI
Finance
- HOA & community: No association fees
Exterior
- Parking: Other parking
- Utilities: Public water; Public sewer
- Home design: Single-family residence; Residential property; Bungalow style; Entrance on main level
- Construction: Vinyl siding; Composition roof; Approximately 101+ years old
- Exterior features: Front porch; Metal fencing; Located inside city limits on a paved city lot
Interior
- Kitchen: Kitchen on main level with ceramic tile flooring
- Bedrooms: 2 bedrooms (both on the main level)
- Flooring: Wood flooring in dining and living areas and in one bedroom; Carpet in one bedroom; Vinyl flooring
- Bathrooms: 1 full bathroom with ceramic tile and shower-over-tub (main level)
- Heating & cooling: Forced air heating; Electric cooling
- Interior features: Bungalow floor plan; Sun room
- Laundry & utility: Laundry on the main level
Neighborhood map
What this means for you Summary
Snapshot
- This is a 2-bed/1.0-bath single-family listed at $90k.
Deal economics
- At list price, monthly cash flow is $272 ($3k/yr) — positive.
- The deal already cash-flows at list — no discount required.
- Meets the 1% rule at list price ($1k rent vs $90k).
- Cap rate 9.9% vs local median 3.9% in Kansas City — top-decile yield for the area; either an underpriced asset or a hidden risk that comps aren't pricing in. Stress-test before assuming the spread holds.
Location & tenants
- Location reads 78/100 on livability (#28 in MO, #2,671 nationally) — a middle-class / working-renter tenant base. Strengths: amenities A+, commute A+, cost of living A+; Watch: crime F.
- Kansas City 33 (urban): math 12% / reading 24% proficiency, ranked #308 of 324 in MO (top 95%) — low school quality limits family demand, transient renter base, plan for 1-2y turnover; 75% free/reduced lunch — lower-income household profile, screen leases tightly.
- Zoned schools: Ac Prep Elementary (math 12% / reading 27%, grade F, #941 of 1,115 statewide, top 86%, 341 students, 99% FRL); Northeast Middle School (math 4% / reading 9%, grade F, #384 of 391 statewide, top 98%, 555 students, 100% FRL); East High School (math 0% / reading 13%, grade F, #516 of 521 statewide, top 99%, 1,112 students, 100% FRL) — zoned schools average 99% FRL vs 75% district-wide (24 pts higher); higher-poverty schools than district average — tighter screening recommended.
- Market conditions: 61 active listings in the ZIP; 23 comparable units currently listed for rent nearby; rentals leasing fast (median 13d on market — plan ~1-2 weeks tenant-placement turnaround); 4,002 units permitted in Jackson County in 2024 (2,271 in 5+ unit buildings).
Forward outlook
- Local home prices are declining (-3.0%/yr); year-one equity from $622 of loan paydown is wiped out by about $3k of value loss. Plan a longer hold.
- Jackson County population projected at +4% by 2050 — modest demand growth; plan on rents tracking national, not racing it.
- At projected returns (-3.0% appreciation + 3.0% rent growth), your $25k cash investment doubles in ~9 years — after that, you're playing with house money.
Negotiation context
- Only 11 days on market — expect competitive offers; lowballing is unlikely to land.
- 6 sale attempts since 29y ago with the ask held roughly flat each time — persistent listings suggest the price (not the market) is what's stuck; bring a comps-based counter.
Risks & watch-outs
- Watch-outs: built in 1909 — expect roof / HVAC / electrical / plumbing capex.
Questions for the listing agent
- Built in 1909 — when were the roof, HVAC, electrical panel, plumbing, and water heater last replaced?
- Is there a deadline driving the sale (1031 exchange, divorce, estate, relocation)? That informs how much negotiation room exists.
- Crime grade is F in this area — have there been break-ins, vandalism, or insurance claims at this property in the last 3 years? What carrier currently insures it and at what premium?
- What's the average days-on-market for RENTAL listings here right now (not sales)? A rising rental-DOM trend means longer vacancies and softer asking-rent achievability than the comps imply.
- What's the recent tenant-quality profile in this submarket — average credit score on applications, eviction rate, late-payment / NSF rate, and stable-employment percentage? A property-management company in the area should have these aggregated.
- How much new for-sale + rental construction is in the pipeline within 1–3 miles? Heavy new supply typically softens prices + rents 12–24 months out; constrained supply supports both.
Investment metrics
- 1% rule
- 1.18% ✓
- Cap rate
- 9.93%
- Cash-on-cash
- 12.97%
- DSCR
- 1.58
- GRM
- 7.1
CMA / ARV
- ARV (on-the-fly)
- $89,910
- Comps found
- 12
Show comp detail 12 sales within ~0.75 mi
| Address | Dist | Beds/Ba | Sqft | Sold | Price | $/sf | Match |
|---|---|---|---|---|---|---|---|
| 318 Barat Ave | 0.38mi | 2/1.0 | 805 (-1%) | 1mo | $89,500 | $111 | 81 |
| 436 Lawndale Ave | 0.16mi | 2/1.0 | 878 (+8%) | 2mo | $85,000 | $97 | 77 |
| 515 Oakley Ave | 0.08mi | 2/1.0 | 909 (+12%) | 4mo | $90,000 | $99 | 73 |
| 5921 Lexington Ave | 0.37mi | 2/1.0 | 768 (-5%) | 11mo | $109,900 | $143 | 65 |
| 1249 Denver St | 0.71mi | 2/1.0 | 792 (-2%) | 3mo | $45,000 | $57 | 61 |
| 5506 Scarritt Ave | 0.59mi | 2/1.0 | 864 (+7%) | 1mo | $40,000 | $46 | 60 |
| 807 Beacon Ave | 0.57mi | 2/1.0 | 872 (+8%) | 7mo | $140,000 | $161 | 55 |
| 1120 Oakley Ave | 0.53mi | 2/1.0 | 900 (+11%) | 4mo | $125,000 | $139 | 53 |
| 134 N Belmont Blvd | 0.68mi | 2/1.0 | 874 (+8%) | 4mo | $60,000 | $69 | 51 |
| 6024 E 11th St | 0.59mi | 3/2.0 (+1) | 768 (-5%) | 6mo | $98,950 | $129 | 50 |
| 4807 E 7th St | 0.44mi | 2/1.5 | 907 (+12%) | 11mo | $114,900 | $127 | 48 |
| 1220 Topping Ave | 0.64mi | 2/1.5 | 900 (+11%) | 8mo | $80,900 | $90 | 43 |
Match score weights: distance 35% · size 25% · config 20% · recency 20%. Top-matched comps best support the ARV.
Projected returns pro-forma
-3.0% appreciation · 3.0% rent growth · sell at horizon
- IRR
- 2.8%
- Equity multiple
- 1.11×
- Total profit
- $2,752
- Equity at exit
- $13,419
- IRR
- 12.4%
- Equity multiple
- 1.98×
- Total profit
- $24,671
- Equity at exit
- $7,782
Cash invested: $25,200 (down + closing). Projections, not guarantees.
Landlord ↔ Tenant lean methodology
- Overall (STATE)
- 81 Strongly Landlord-Friendly
- State Missouri
- 81 Strongly Landlord-Friendly · R+10
- County
- — inherits STATE
- City
- — inherits STATE
ZIP-level market 64123
- Home prices YoY
- -8.3%
- Active inventory
- 61
- Price-to-rent
- 7.1×
Monthly cashflow live
- Estimated rent
- $1,063 high interval (Pro) →
- Mortgage (P&I)
- −$472
- Tax from tax record
- −$58 /mo · $695/yr
- Insurance
- −$38
- HOA
- −$0
- Vacancy / Maint / Mgmt
- −$223
- Net cashflow
- $272
Break-even live
Sensitivity live
| Price | -10% $323 | -5% $298 | +0% $272 | +5% $247 | +10% $222 |
|---|---|---|---|---|---|
| Rent | -10% $188 | -5% $230 | +0% $272 | +5% $314 | +10% $356 |
| Rate | -1.0pp $318 | -0.5pp $295 | base $272 | +0.5pp $249 | +1.0pp $225 |
UW: 25.0% down · 7.5% · 30yr · 1.5% tax · 5.0% vac · 8.0% maint · 8.0% mgmt
Financing live
Cash to close
- Down payment
- $22,500
- Closing costs
- $2,700
- Reserves months
- —
- Total cash needed
- —
Loan-product check · same deal, 3 products live
Conventional
25% down · 7.5% · 30yr
- Down + closing
- —
- Monthly P&I
- —
- Monthly cashflow
- —
- DSCR
- —
- Eligible?
- —
Personal DTI + credit; lowest rate.
DSCR
20% down · 8.5% · 30yr
- Down + closing
- —
- Monthly P&I
- —
- Monthly cashflow
- —
- DSCR
- —
- Eligible?
- —
No personal income docs; deal must DSCR.
Hard money
10% down · 12.0% · 12mo
- Down + closing
- —
- Monthly P&I
- —
- Monthly cashflow
- —
- DSCR
- —
- Eligible?
- —
Short-term bridge; refi at stabilization.
Rent comps 23 comps
| Address | Beds | Baths | Sqft | Rent | $/sqft | DOM | Units | Dist |
|---|---|---|---|---|---|---|---|---|
| 135 Lawndale Ave Kansas City, MO | 3.0 | 2.0 | 920 | $1,500 | $1.63 | 9d | 1 | 0.38mi |
| 303 White Ave Unit 2 Kansas City, MO | 2.0 | 1.0 | 1060 | $950 | $0.90 | 12d | 1 | 0.46mi |
| 817 White Ave Kansas City, MO | 2.0 | 1.0 | 936 | $925 | $0.99 | 0d | 1 | 0.46mi |
| 6011 E 11th St Kansas City, MO | 3.0 | 1.0 | 900 | $1,200 | $1.33 | 18d | 1 | 0.62mi |
| 445 N Lawndale Ave Kansas City, MO | 2.0 | 1.0 | 700 | $1,200 | $1.71 | 26d | 1 | 0.82mi |
| 611 Ewing Ave Unit B Kansas City, MO | 1.0 | 1.0 | 700 | $800 | $1.14 | 26d | 1 | 0.84mi |
| 611 Ewing Ave Unit A Kansas City, MO | 1.0 | 1.0 | 700 | $800 | $1.14 | 0d | 1 | 0.84mi |
| 1616 Hardesty Ave Unit 1-108 Kansas City, MO | 1.0 | 1.0 | 634 | $1,150 | $1.81 | 23d | 1 | 0.94mi |
| 1603 Elmwood Ave Kansas City, MO | 2.0 | 1.0 | 1064 | $1,006 | $0.95 | 0d | 1 | 1.11mi |
| 3913 Scarritt Ave Apt 2W Kansas City, MO | 1.0 | 1.0 | 700 | $800 | $1.14 | 5d | 1 | 1.12mi |
| 3921 Norledge Ave Unit 2E Kansas City, MO | 2.0 | 1.0 | 900 | $950 | $1.06 | 46d | 1 | 1.14mi |
| 301-307 N Gladstone Blvd Unit 307-42 Kansas City, MO | 1.0 | 1.0 | 650 | $850 | $1.31 | 6d | 1 | 1.15mi |
| 307 N Gladstone Blvd Kansas City, MO | 1.0 | 1.0 | 650 | $850 | $1.31 | 46d | 3 | 1.16mi |
| 3435 E 7th St Kansas City, MO | 2.0 | 1.0 | 970 | $949 | $0.98 | 9d | 1 | 1.21mi |
| 3509 Lexington Ave Unit 3 Kansas City, MO | 1.0 | 1.0 | 680 | $795 | $1.17 | 0d | 1 | 1.21mi |
| 3600 Saint John Ave Unit 109 Kansas City, MO | 1.0 | 1.0 | 680 | $750 | $1.10 | 46d | 1 | 1.22mi |
| 3423 Garner Ave Unit B Kansas City, MO | 2.0 | 1.0 | 800 | $900 | $1.12 | 46d | 1 | 1.25mi |
| 3220 E 10th St Apt 1 Kansas City, MO | 1.0 | 1.0 | 700 | $940 | $1.34 | 0d | 1 | 1.39mi |
| 108 N Indiana Ave Unit 3S Kansas City, MO | 1.0 | 1.0 | 600 | $699 | $1.17 | 46d | 1 | 1.40mi |
| 901 Benton Blvd Unit 7 Kansas City, MO | 2.0 | 1.0 | 1100 | $1,202 | $1.09 | 46d | 1 | 1.42mi |
| 301 Benton Blvd Unit 2 Kansas City, MO | 2.0 | 1.0 | 850 | $1,025 | $1.21 | 26d | 1 | 1.45mi |
| 301 Benton Blvd Unit 3 Kansas City, MO | 2.0 | 1.0 | 850 | $970 | $1.14 | 0d | 1 | 1.45mi |
| 301 Benton Blvd Unit 3 Kansas City, MO | 2.0 | 1.0 | 850 | $970 | $1.14 | 9d | 1 | 1.45mi |
Listing history 9 events
-
2026-06-09days on market $90,000 Active 11 DOM
-
2026-06-08days on market $90,000 Active 10 DOM
-
2026-06-07days on market $90,000 Active 9 DOM
-
2026-06-05remarks 406-char remark
-
2026-06-05days on market $90,000 Active 6 DOM
-
2026-06-03days on market $90,000 Active 5 DOM
-
2026-06-02days on market $90,000 Active 4 DOM
-
2026-06-01days on market $90,000 Active 3 DOM
-
2026-05-31days on market $90,000 Active 2 DOM
ⓘ Source: listings_history table (triggers on properties + properties_extension) + one-shot
backfill from property_details.listing_events for pre-trigger history.
Tax reassessment forecast MO · Resets to sale price
- Current annual tax
- $695 · $58/mo
- Projected year-2 tax
- $873 · $73/mo
- Expected delta
- +$178/yr (+$15/mo · 25.5%)
ⓘ Screening estimate from a state-policy table — verify with the county assessor before closing.
Climate risk First Street
- Flood 1/10 Low FEMA zone X (unshaded) · 0% chance over 30 yrs
- Wildfire 3/10 Moderate
- Heat 4/10 Moderate 7 d/yr ≥106°F today · 17 d/yr by 30 yrs out
- Wind 2/10 Low
- Air quality 3/10 Moderate 2 unhealthy d/yr today · 3 by 30 yrs out
Nearby sold comps map
Loading sold comps map…
Walkable amenities ~0.75 mi
Loading nearby amenities…
Taxation est. · year 1
- Rental income
- $12,758
- − Mortgage interest
- −$5,041
- − Property taxes
- −$695
- − Insurance
- −$450
- − Repairs & maintenance
- −$1,021
- − Management
- −$1,021
- − Depreciation
- −$2,618
- Taxable income
- $1,912
- Est. tax owed @ 24.0%
- −$459
- After-tax cash flow
- $2,811/yr
For passive investors: Depreciation is non-cash, so a rental often shows a tax loss while cash-flowing — sheltering income. Rental losses are passive: they offset passive income freely, and up to $25,000/yr can offset ordinary (W-2) income if you actively participate and your MAGI is under $100k (phasing out to $0 by $150k); unused losses carry forward. On sale, claimed depreciation is recaptured at up to 25%, and gains may owe capital-gains tax (a 1031 exchange can defer both). Figures are a year-1 estimate at your 24.0% rate — not tax advice; consult a CPA.
Schools (NCES district)
- District
- Kansas City 33
- NCES district ID
- 2916400
- Math proficiency
- 12% ▼ -8.00%
- Reading proficiency
- 24% ▬ 0.00%
- Median HH income
- $35,227
- Composite
- 14.8/100
- National rank
- #9387
- State rank
- #308 of 324 in MO
Livability — Kansas City
- Score
- 78/100
- State rank
- #28
- US rank
- #2671
Category grades
Schools grade is shown separately in the Schools card above.
Census & demographics
- Census place
- Kansas City, MO
- County
- Jackson County · 687,798 people
- City population
- 439,467
- Metro
- Kansas City, MO-KS
- Population (ZIP)
- 11,833
- Household income
- $54,443
- Rent vs Own
- Severe rent burden
- 338.0
Population outlook (Jackson County) Hauer SSP2
- Today (2025)
- 719,589 people
- By 2030
- 731,456 · +1.6%
- By 2040
- 746,689 · +3.8%
- By 2050
- 749,289 · +4.1%
- By 2075
- 736,227 · +2.3%
- By 2100
- 668,210 · -7.1%
Race, ethnicity, and origin ACS 2023
- Neighborhood character
- Diverse neighborhood (Simpson 0.64)
- Race & ethnicity
- Hispanic / Latino 48% White 34% Two or more races 25% Black 10% Asian 5% Native American 2%
- Hispanic origin (detail)
- Mexican 37% Puerto Rican 1% Cuban 3%
- Common ancestry
- Italian 2% Arab 2% Romanian 1%
- Foreign-born
- 22% · Canada, Vietnam, Philippines
- Languages at home
- 58% English-only · Spanish 35% Arabic 2% Vietnamese 1%
Political lean MEDSL · Jackson
- 2024 margin
- D (+19.3) · D 58.9% · R 39.5% · Other 1.6%
- 2008→2024 swing
- -6.1pp toward R · 2008: 25.4pp · 2024: 19.3pp
- All cycles
- 2024: D+19.3 2020: D+22.0 2016: D+16.6 2012: D+19.0 2008: D+25.4
Not yet ingested
- Civics
- —
Market trends
- HPI YoY
- ▼ -35.35%
- Current HPI
- 392.4402
- Rent YoY
- —
- Metro
- Kansas City, MO-KS
- State GDP YoY
- ▲ 1.84%
- F500 in state
- 20
Industry mix (Fortune 500 HQ in MO)
| Industry | F500 HQs | Revenue |
|---|---|---|
| Healthcare | 1 | $163B |
|
||
| Insurance | 1 | $21B |
|
||
| Industrial Technology | 1 | $17B |
|
||
| Retail | 1 | $16B |
|
||
| Industrial Distribution | 1 | $10B |
|
||
| Utilities | 1 | $9B |
|
||
Price history
+361.5% since first listed16 events — show timeline
- 2026-05-29 Listed $90,000 Heartland MLS as Distributed by MLS Grid
- 2024-03-03 Rental Removed $950 RENTLY
- 2024-02-22 Listed for Rent $950 RENTLY
- 2023-11-08 Rental Removed $1,245 RENTLY
- 2023-11-04 Listed for Rent $1,245 RENTLY
- 2023-08-29 Sold (Public Records) — Public Records
- 2023-08-25 Sold (MLS) — Heartland MLS as Distributed by MLS Grid
- 2023-08-02 Pending — Heartland MLS as Distributed by MLS Grid
- 2023-07-21 Listed $89,900 Heartland MLS as Distributed by MLS Grid
- 2022-11-07 Listing Removed — Heartland MLS as Distributed by MLS Grid
- 2022-09-02 Listed $95,000 Heartland MLS as Distributed by MLS Grid
- 2017-10-31 Sold (Public Records) — Public Records
- 1997-08-04 Sold (Public Records) — Public Records
- 1997-07-31 Sold (MLS) — Heartland MLS as Distributed by MLS Grid
- 1997-06-21 Listed $19,500 Heartland MLS as Distributed by MLS Grid
- 1990-05-29 Sold (Public Records) — Public Records
Property tax history
+20.3%/yrLatest (2025): $695 · -27.0% YoY. Source: county tax records.
Cash-flow waterfall
monthlySold comps — $/sqft
last 12 mo · ≤1 miLoading sold comps…