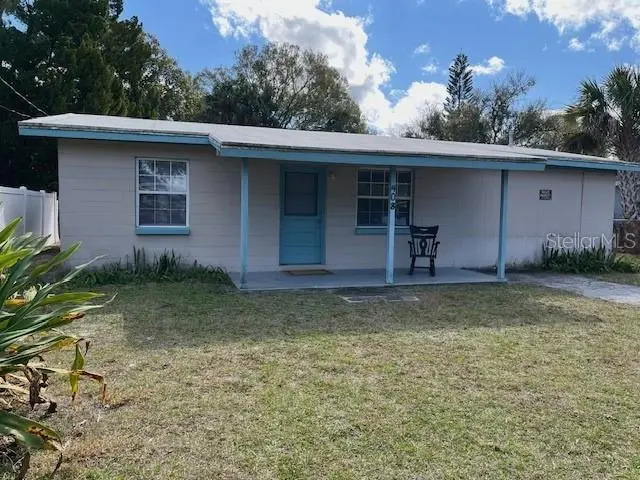
408 Oak St · Port Orange, FL
Flood risk 6/10 · Moderate
- FEMA flood zone
- X (unshaded)
- Chance of flooding over 30 yrs
- 0.56%
- Est. flood insurance / yr
- $507 – $1,088
Fire risk 2/10 · Minimal
- Est. fire insurance / yr
- $947 – $1,759
Heat risk 10/10 · Severe
- Hot days now (above 105°F)
- 7 days/yr
- Hot days in 30 yrs
- 20 days/yr
Wind risk 10/10 · Severe
- Chance of severe wind over 30 yrs
- 99.0%
Air-quality risk 2/10 · Minimal
- Unhealthy air days now
- 1 days/yr
- Unhealthy air days in 30 yrs
- 1 days/yr
Risk factors via First Street. Map © Google.
Why this score? — see what drove the D- grade
The composite is a weighted blend of 9 inputs, each scored 0–100. Each bar is that input's sub-score; the figure is the points it added to the 100-point composite (weight × sub-score).
- Cash flow +10.0/30.0
- ARV discount +7.5/15.0
- Livability +4.0/5.0
- Schools +3.9/10.0
- Rent growth +3.0/5.0
- DSCR +2.9/10.0
- 1% rule +2.8/10.0
- Condition / age +2.5/5.0
- Appreciation +0.0/10.0
$225,000
🖨 Deal sheet (PDF) 📄 Offer letter ✓ Due diligence
Listing remarks MLS
A QUIET GEM------Well taken care of, this property truly Needs To Be Seen!!! New HOT WATER HEATER, Increased HOME ELECTRIC SERVICE TO 200 AMPS, New PAINT, New FANS and BEAUTIFULLY REFINISHED TERRAZZO FLOORING throughout. .. . So Much To See And Still Yet So Much able to be transformed into your Specific Dream Home. Replaced Windows, Large Backyard, Enclosed Carport, added Bonus Room. .. The List goes on and on and on. Definitely will tug on your ownership heart strings. Schedule your showing today and make up your mind as it won't be around long!
Key facts
- Replaced windows
- New fans
- Large backyard
Tags
Neighborhood map
What this means for you Summary
Snapshot
- This is a 2-bed/1.0-bath single-family listed at $225k.
Deal economics
- At list price, monthly cash flow is $-135 ($-2k/yr) — negative.
- To cash-flow at today's rent, offer at most $201k (10.6% below list).
- To meet the 1% rule (rent ≥ 1% of price), the offer needs to be $175k (22.1% below list).
- Recommended offer: $175k (22.1% below list) — sets the bar for 1% rule.
Location & tenants
- Location reads 80/100 on livability (#131 in FL, #1,957 nationally) — a professional / high-income tenant draw. Strengths: housing A+, health & safety A+, cost of living A; Watch: amenities D+, commute D+.
- Volusia (suburban): math 44% / reading 49% proficiency, ranked #47 of 73 in FL (top 64%) — families likely to look elsewhere, expect single-tenant / working-renter base with shorter leases.
- Zoned schools: Port Orange Elementary School (math 67% / reading 67%, grade B+, #450 of 2,144 statewide, top 22%, 361 students, 62% FRL); Silver Sands Middle School (math 50% / reading 52%, grade C, #237 of 571 statewide, top 43%, 1,165 students, 54% FRL); Spruce Creek High School (math 37% / reading 61%, grade D, #193 of 667 statewide, top 29%, 2,569 students, 37% FRL) — zoned schools at 51% FRL track the district average.
- Market conditions: Rents rising (+1.8%/yr); 417 active listings in the ZIP; 11 comparable units currently listed for rent nearby; rentals at typical pace (median 16d on market — plan ~3-4 weeks tenant-placement turnaround); 3,402 units permitted in Volusia County in 2024 (681 in 5+ unit buildings).
Forward outlook
- Local home prices are declining (-3.0%/yr); year-one equity from $2k of loan paydown is wiped out by about $7k of value loss. Plan a longer hold.
- Volusia County population projected at +19% by 2050 — long-run rental-demand tailwind backs the buy-and-hold thesis.
Negotiation context
- It's been on market 144 days — a 12% lower offer ($198k) is reasonable based on typical stale-listing flexibility.
- Current owner paid $29k; list at $225k implies a 676% gain — meaningful room to come down on a strong offer.
Risks & watch-outs
- Watch-outs: built in 1958 — expect roof / HVAC / electrical / plumbing capex.
- Climate carrying-cost: major flood risk; severe wind risk, 99% chance of damaging wind over 30y; extreme-heat days projected 7→20/yr by 2055 (HVAC capex compounding) — expect insurance premiums to compound above CPI over the hold.
Questions for the listing agent
- What do current leases actually rent for vs. the listed asking? Can we see a recent rent roll and the last 12 months of T-12 income?
- It's been on market 144 days. Have you received any prior offers? Is the seller open to a 22% concession, seller financing, or rate buy-down credit?
- Built in 1958 — when were the roof, HVAC, electrical panel, plumbing, and water heater last replaced?
- Why hasn't it sold? Are there any deal-killer items the seller is aware of (foundation, flood, title, zoning, code violations)?
- Is there a deadline driving the sale (1031 exchange, divorce, estate, relocation)? That informs how much negotiation room exists.
- Schools are B-rated — typically a magnet for longer-tenancy family renters. What's the average tenant stay here, and is there a school-zone premium baked into asking?
- The area grade is low — what's the realistic commute time and amenity access for the typical tenant pool here? Any planned neighborhood developments (good or bad) we should know about?
- What's the average days-on-market for RENTAL listings here right now (not sales)? A rising rental-DOM trend means longer vacancies and softer asking-rent achievability than the comps imply.
- What's the recent tenant-quality profile in this submarket — average credit score on applications, eviction rate, late-payment / NSF rate, and stable-employment percentage? A property-management company in the area should have these aggregated.
- How much new for-sale + rental construction is in the pipeline within 1–3 miles? Heavy new supply typically softens prices + rents 12–24 months out; constrained supply supports both.
Investment metrics
- 1% rule
- 0.78% ✗
- Cap rate
- 5.57%
- Cash-on-cash
- -2.57%
- DSCR
- 0.89
- GRM
- 10.7
CMA / ARV
No comps found within radius.
Projected returns pro-forma
-3.0% appreciation · 1.83% rent growth · sell at horizon
- IRR
- -21.9%
- Equity multiple
- 0.25×
- Total profit
- $-47,082
- Equity at exit
- $33,548
- IRR
- -18.7%
- Equity multiple
- 0.04×
- Total profit
- $-60,210
- Equity at exit
- $19,454
Cash invested: $63,000 (down + closing). Projections, not guarantees.
Landlord ↔ Tenant lean methodology
- Overall (STATE)
- 87 Strongly Landlord-Friendly
- State Florida
- 87 Strongly Landlord-Friendly · R+3
- County
- — inherits STATE
- City
- — inherits STATE
ZIP-level market 32127
- Rents YoY
- 1.8%
- Active inventory
- 417
- Price-to-rent
- 10.7×
Monthly cashflow live
- Estimated rent
- $1,752 high interval (Pro) →
- Mortgage (P&I)
- −$1,180
- Tax from tax record
- −$245 /mo · $2,944/yr
- Insurance
- −$94
- HOA
- −$0
- Vacancy / Maint / Mgmt
- −$368
- Net cashflow
- $-135
Break-even live
Sensitivity live
| Price | -10% $-7 | -5% $-71 | +0% $-135 | +5% $-199 | +10% $-262 |
|---|---|---|---|---|---|
| Rent | -10% $-273 | -5% $-204 | +0% $-135 | +5% $-66 | +10% $4 |
| Rate | -1.0pp $-22 | -0.5pp $-78 | base $-135 | +0.5pp $-193 | +1.0pp $-252 |
UW: 25.0% down · 7.5% · 30yr · 1.5% tax · 5.0% vac · 8.0% maint · 8.0% mgmt
Financing live
Cash to close
- Down payment
- $56,250
- Closing costs
- $6,750
- Reserves months
- —
- Total cash needed
- —
Loan-product check · same deal, 3 products live
Conventional
25% down · 7.5% · 30yr
- Down + closing
- —
- Monthly P&I
- —
- Monthly cashflow
- —
- DSCR
- —
- Eligible?
- —
Personal DTI + credit; lowest rate.
DSCR
20% down · 8.5% · 30yr
- Down + closing
- —
- Monthly P&I
- —
- Monthly cashflow
- —
- DSCR
- —
- Eligible?
- —
No personal income docs; deal must DSCR.
Hard money
10% down · 12.0% · 12mo
- Down + closing
- —
- Monthly P&I
- —
- Monthly cashflow
- —
- DSCR
- —
- Eligible?
- —
Short-term bridge; refi at stabilization.
Rent comps 11 comps
| Address | Beds | Baths | Sqft | Rent | $/sqft | DOM | Units | Dist |
|---|---|---|---|---|---|---|---|---|
| 4211 New Haven Ct Port Orange, FL | 2.0 | 2.0 | 902 | $2,000 | $2.22 | 25d | 1 | 0.61mi |
| 5173 Pineland Ave Port Orange, FL | 2.0 | 1.5 | 914 | $1,750 | $1.91 | 25d | 1 | 0.91mi |
| 3230 S Ridgewood Ave South Daytona, FL | 1.0–3.0 | 1.0–2.0 | 1046 | $1,881 | $1.80 | 13d | 27 | 0.92mi |
| 3131 S Ridgewood Ave #203 South Daytona, FL | 2.0 | 2.0 | 1013 | $1,795 | $1.77 | 16d | 1 | 1.03mi |
| 5249 Taylor Ave Port Orange, FL | 2.0 | 2.5 | 672 | $1,650 | $2.46 | 16d | 1 | 1.13mi |
| 980 Canal View Blvd Port Orange, FL | 2.0 | 1.5 | 1024 | $1,448 | $1.41 | 25d | 2 | 1.20mi |
| 722 Cindy Cir Port Orange, FL | 2.0 | 1.5 | 850 | $1,275 | $1.50 | 16d | 1 | 1.26mi |
| 1025 Eagle Lake Trl Port Orange, FL | 1.0 | 1.0 | 576 | $1,185 | $2.06 | 25d | 2 | 1.38mi |
| 940 Village Trl Unit 4-306 Port Orange, FL | 2.0 | 2.0 | 1006 | $2,000 | $1.99 | 16d | 1 | 1.41mi |
| 2 Talo Cir Unit 1531033P Port Orange, FL | 3.0 | 1.5 | 979 | $3,060 | $3.13 | 16d | 1 | 1.44mi |
| 3307 Oak Trail Run #7 Port Orange, FL | 2.0 | 2.0 | 910 | $1,650 | $1.81 | 25d | 1 | 1.48mi |
Listing history 18 events
-
2026-06-22days on market $225,000 Active 144 DOM
-
2026-06-18days on market $225,000 Active 141 DOM
-
2026-06-17days on market $225,000 Active 140 DOM
-
2026-06-16days on market $225,000 Active 139 DOM
-
2026-06-15days on market $225,000 Active 138 DOM
-
2026-06-14days on market $225,000 Active 136 DOM
-
2026-06-10days on market $225,000 Active 133 DOM
-
2026-06-09days on market $225,000 Active 132 DOM
-
2026-06-08days on market $225,000 Active 131 DOM
-
2026-06-07days on market $225,000 Active 130 DOM
-
2026-06-05days on market $225,000 Active 127 DOM
-
2026-06-03days on market $225,000 Active 126 DOM
-
2026-06-03days on market $225,000 Active 125 DOM
-
2026-06-01days on market $225,000 Active 124 DOM
-
2026-05-31days on market $225,000 Active 123 DOM
-
2026-05-31days on market $225,000 Active 122 DOM
-
2026-01-28$225,000 Active 557-char remark
Show marketing remark (557 chars)
A QUIET GEM------Well taken care of, this property truly Needs To Be Seen!!! New HOT WATER HEATER, Increased HOME ELECTRIC SERVICE TO 200 AMPS, New PAINT, New FANS and BEAUTIFULLY REFINISHED TERRAZZO FLOORING throughout. .. . So Much To See And Still Yet So Much able to be transformed into your Specific Dream Home. Replaced Windows, Large Backyard, Enclosed Carport, added Bonus Room. .. The List goes on and on and on. Definitely will tug on your ownership heart strings. Schedule your showing today and make up your mind as it won't be around long!
-
1989-10-01soldstatus $29,000
ⓘ Source: listings_history table (triggers on properties + properties_extension) + one-shot
backfill from property_details.listing_events for pre-trigger history.
Tax reassessment forecast FL · Resets to sale price
- Current annual tax
- $2,944 · $245/mo
- Projected year-2 tax
- $2,944 · $245/mo
- Expected delta
- $0/yr ($0/mo · 0.0%)
ⓘ Screening estimate from a state-policy table — verify with the county assessor before closing.
Climate risk First Street
- Flood 6/10 Major FEMA zone X (unshaded) · 56% chance over 30 yrs
- Wildfire 2/10 Low
- Heat 10/10 Extreme 7 d/yr ≥105°F today · 20 d/yr by 30 yrs out
- Wind 10/10 Extreme 99% chance of damaging wind over 30 yrs
- Air quality 2/10 Low 1 unhealthy d/yr today · 1 by 30 yrs out
Nearby sold comps map
Loading sold comps map…
Walkable amenities ~0.75 mi
Loading nearby amenities…
Taxation est. · year 1
- Rental income
- $21,026
- − Mortgage interest
- −$12,603
- − Property taxes
- −$2,944
- − Insurance
- −$1,125
- − Repairs & maintenance
- −$1,682
- − Management
- −$1,682
- − Depreciation
- −$6,545
- Taxable loss
- −$5,556
- Est. tax savings @ 24.0%
- +$1,334
- After-tax cash flow
- $-284/yr
For passive investors: Depreciation is non-cash, so a rental often shows a tax loss while cash-flowing — sheltering income. Rental losses are passive: they offset passive income freely, and up to $25,000/yr can offset ordinary (W-2) income if you actively participate and your MAGI is under $100k (phasing out to $0 by $150k); unused losses carry forward. On sale, claimed depreciation is recaptured at up to 25%, and gains may owe capital-gains tax (a 1031 exchange can defer both). Figures are a year-1 estimate at your 24.0% rate — not tax advice; consult a CPA.
Schools (NCES district)
- District
- Volusia
- NCES district ID
- 1201920
- Math proficiency
- 44% ▼ -9.00%
- Reading proficiency
- 49% ▼ -3.00%
- Median HH income
- $42,946
- Composite
- 39.2/100
- National rank
- #4019
- State rank
- #47 of 73 in FL
Livability — Port Orange
- Score
- 80/100
- State rank
- #131
- US rank
- #1957
Category grades
Schools grade is shown separately in the Schools card above.
Census & demographics
- Census place
- Port Orange, FL
- County
- Volusia County · 556,871 people
- City population
- 75,051
- Metro
- Deltona-Daytona Beach-Ormond Beach, FL
- Population (ZIP)
- 29,612
- Household income
- $71,676
- Rent vs Own
- Severe rent burden
- 812.0
Population outlook (Volusia County) Hauer SSP2
- Today (2025)
- 572,749 people
- By 2030
- 598,695 · +4.5%
- By 2040
- 644,880 · +12.6%
- By 2050
- 681,451 · +19.0%
- By 2075
- 759,957 · +32.7%
- By 2100
- 778,902 · +36.0%
Race, ethnicity, and origin ACS 2023
- Neighborhood character
- Predominantly White (88%)
- Race & ethnicity
- White 88% Two or more races 6% Hispanic / Latino 4% Black 2% Asian 1%
- Common ancestry
- Romanian 5% Lithuanian 3% Iranian 2%
- Foreign-born
- 6% · Canada
- Languages at home
- 93% English-only · Spanish 3% Other Indo-European 1%
Political lean MEDSL · Volusia
- 2024 margin
- Strong R (+21.8) · D 38.7% · R 60.5%
- 2008→2024 swing
- -27.4pp toward R · 2008: 5.7pp · 2024: -21.8pp
- All cycles
- 2024: R+21.8 2020: R+14.1 2016: R+13.1 2012: R+1.2 2008: D+5.7
Not yet ingested
- Civics
- —
Market trends
- HPI YoY
- ▼ -348.71%
- Current HPI
- 282.5248
- Rent YoY
- ▲ 1.83%
- Metro
- Deltona-Daytona Beach-Ormond Beach, FL
- State GDP YoY
- ▲ 3.28%
- F500 in state
- 36
Industry mix (Fortune 500 HQ in FL)
| Industry | F500 HQs | Revenue |
|---|---|---|
| Industrial Technology | 2 | $29B |
|
||
| Insurance | 2 | $17B |
|
||
| Retail | 1 | $60B |
|
||
| Technology Distribution | 1 | $58B |
|
||
| Homebuilding | 1 | $35B |
|
||
| Technology Manufacturing | 1 | $35B |
|
||
Price history
+675.9% since first listed2 events — show timeline
- 2026-01-28 Listed $225,000 Stellar MLS as Distributed by MLS Grid
- 1989-10-01 Sold (Public Records) $29,000 Public Records
Property tax history
+7.1%/yrLatest (2025): $2,944 · +7.5% YoY. Source: county tax records.
Cash-flow waterfall
monthlySold comps — $/sqft
last 12 mo · ≤1 miLoading sold comps…