3418 Central Ave · Farmington, WV
Flood risk 1/10 · Minimal
- FEMA flood zone
- X (unshaded)
- Chance of flooding over 30 yrs
- 0.0%
- Est. flood insurance / yr
- $473 – $860
Fire risk 3/10 · Minor
- Est. fire insurance / yr
- $787 – $1,461
Heat risk 4/10 · Minor
- Hot days now (above 97°F)
- 7 days/yr
- Hot days in 30 yrs
- 20 days/yr
Wind risk 1/10 · Minimal
- Chance of severe wind over 30 yrs
- 0.0%
Air-quality risk 2/10 · Minimal
- Unhealthy air days now
- 0 days/yr
- Unhealthy air days in 30 yrs
- 1 days/yr
Risk factors via First Street. Map © Google.
Why this score? — see what drove the B+ grade
The composite is a weighted blend of 9 inputs, each scored 0–100. Each bar is that input's sub-score; the figure is the points it added to the 100-point composite (weight × sub-score).
- Cash flow +27.9/30.0
- ARV discount +15.0/15.0
- DSCR +9.9/10.0
- 1% rule +7.5/10.0
- Appreciation +6.8/10.0
- Livability +3.3/5.0
- Schools +3.1/10.0
- Rent growth +2.5/5.0
- Condition / age +2.5/5.0
$89,000
🖨 Deal sheet (PDF) 📄 Offer letter ✓ Due diligence
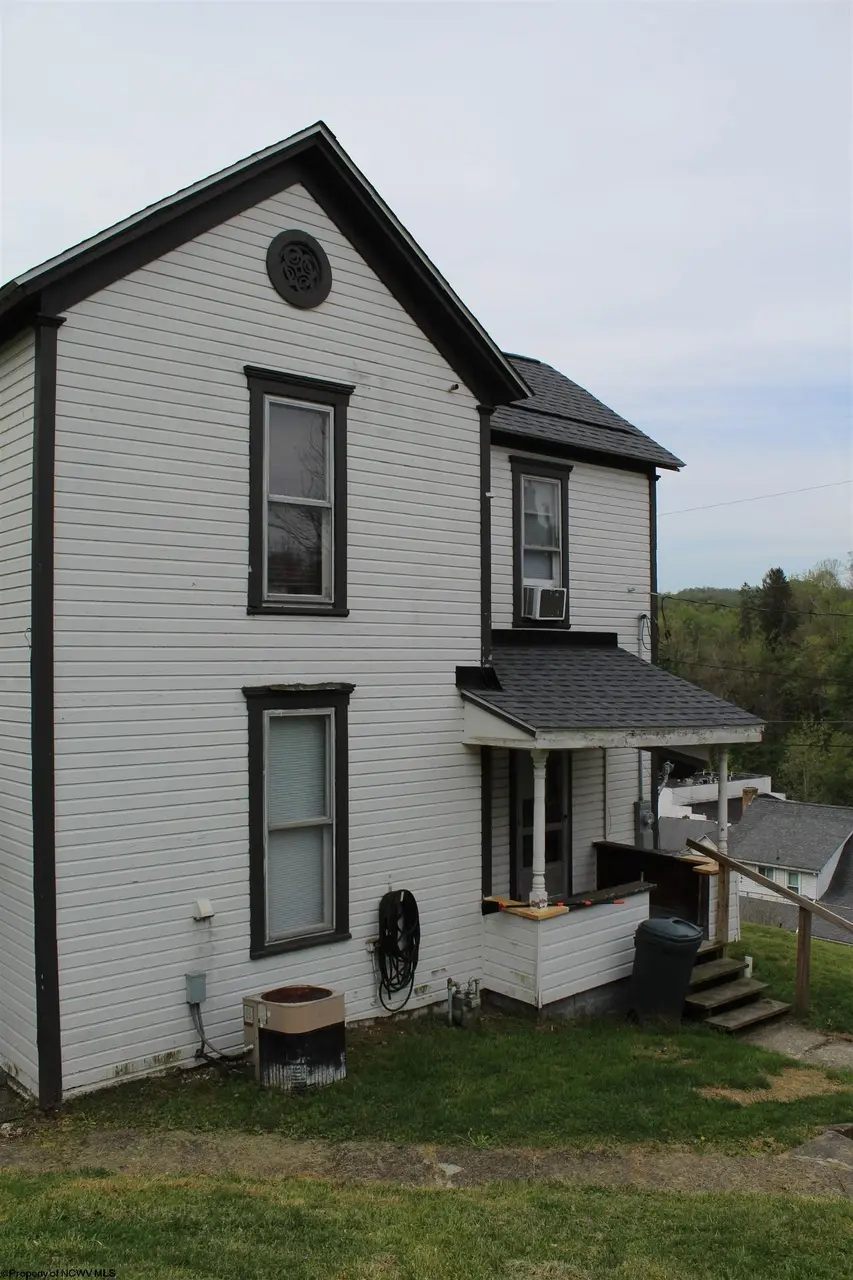
Listing remarks
Check out this Charming older3 story home, beautiful Oak wood work through out this home, oak stair case railing and molding, and Mantels. this home has a newer roof and hot water tank. The 2nd home has been vacant since 1995.it is not livable.
Key facts
- 5,227 sq ft lot
- Garage
- Built 1908
Property features AI
Finance
- Other: Lot size approximately 0.12 acres; Seven total rooms
Exterior
- Parking: Has garage
- Utilities: Public water service; Public sewer service
- Home design: Detached single-family residence; Two-story
- Construction: Frame construction with wood siding
- Exterior features: Shingle roof; Public water; Public sewer
Interior
- Kitchen: Range; Refrigerator; Dishwasher not listed
- Bathrooms: One full bathroom
- Heating & cooling: Natural gas heating; Central air conditioning
- Interior features: Washer and dryer included; Refrigerator; Range; Concrete basement
- Laundry & utility: Washer; Dryer
Neighborhood map
What this means for you Summary
Snapshot
- This is a 3-bed/1.0-bath single-family listed at $89k.
Deal economics
- At list price, monthly cash flow is $275 ($3k/yr) — positive.
- The deal already cash-flows at list — no discount required.
- Meets the 1% rule at list price ($1k rent vs $89k).
- Recommended offer: $86k (3.0% below list) — sets the bar for market timing.
Location & tenants
- Location reads 66/100 on livability (#107 in WV) — a middle-class / working-renter tenant base. Strengths: cost of living A+, housing A+, employment A-; Watch: health & safety C-, amenities F, commute F.
- Marion County Schools (town): math 30% / reading 43% proficiency, ranked #11 of 55 in WV (top 20%) — families likely to look elsewhere, expect single-tenant / working-renter base with shorter leases.
- Zoned schools: Blackshere Elementary School (math 22% / reading 22%, grade F, #324 of 377 statewide, top 89%, 333 students, 0% FRL); Mannington Middle School (math 24% / reading 31%, grade F, #70 of 109 statewide, top 65%, 251 students, 0% FRL); North Marion High School (math 27% / reading 47%, grade F, #32 of 110 statewide, top 34%, 738 students, 0% FRL) — zoned schools average 0% FRL vs 46% district-wide (46 pts lower); this property's tenant base skews higher-income than the district average.
- Market conditions: 5 active listings in the ZIP; 3 units permitted in Marion County in 2024 (0 in 5+ unit buildings).
Forward outlook
- In year one you build about $4k of equity ($615 loan paydown + $3k appreciation (3.7% local appreciation)).
- At projected returns (3.7% appreciation + 3.0% rent growth), your $25k cash investment doubles in ~4 years — after that, you're playing with house money.
- By year 9, paydown + projected appreciation supports a ~$33k cash-out refi (75% LTV) — recoverable capital for the next deal without selling this one.
Negotiation context
- It's been on market 50 days — a 3% lower offer ($86k) is reasonable based on typical stale-listing flexibility.
Risks & watch-outs
- Watch-outs: built in 1908 — expect roof / HVAC / electrical / plumbing capex.
Questions for the listing agent
- It's been on market 50 days. Have you received any prior offers? Is the seller open to a 3% concession, seller financing, or rate buy-down credit?
- Built in 1908 — when were the roof, HVAC, electrical panel, plumbing, and water heater last replaced?
- Is there a deadline driving the sale (1031 exchange, divorce, estate, relocation)? That informs how much negotiation room exists.
- Schools are D-rated, which usually means shorter tenancies and higher turnover. Who's the typical renter profile here, and what's been the actual vacancy rate?
- What's the average days-on-market for RENTAL listings here right now (not sales)? A rising rental-DOM trend means longer vacancies and softer asking-rent achievability than the comps imply.
- What's the recent tenant-quality profile in this submarket — average credit score on applications, eviction rate, late-payment / NSF rate, and stable-employment percentage? A property-management company in the area should have these aggregated.
- How much new for-sale + rental construction is in the pipeline within 1–3 miles? Heavy new supply typically softens prices + rents 12–24 months out; constrained supply supports both.
Investment metrics
- 1% rule
- 1.25% ✓
- Cap rate
- 10.00%
- Cash-on-cash
- 13.24%
- DSCR
- 1.59
- GRM
- 6.7
CMA / ARV
- ARV (on-the-fly)
- $141,400
- Comps found
- 1
Show comp detail 1 sale within ~0.75 mi
| Address | Dist | Beds/Ba | Sqft | Sold | Price | $/sf | Match |
|---|---|---|---|---|---|---|---|
| 4221 Anderson | 0.26mi | 3/1.0 | 1,519 (+8%) | 17mo | $154,000 | $101 | 60 |
Match score weights: distance 35% · size 25% · config 20% · recency 20%. Top-matched comps best support the ARV.
Projected returns pro-forma
3.69% appreciation · 3.0% rent growth · sell at horizon
- IRR
- 21.5%
- Equity multiple
- 2.27×
- Total profit
- $31,552
- Equity at exit
- $43,543
- IRR
- 22.0%
- Equity multiple
- 4.36×
- Total profit
- $83,832
- Equity at exit
- $69,984
Cash invested: $24,920 (down + closing). Projections, not guarantees.
Landlord ↔ Tenant lean methodology
- Overall (STATE)
- 83 Strongly Landlord-Friendly
- State West Virginia
- 83 Strongly Landlord-Friendly · R+22
- County
- — inherits STATE
- City
- — inherits STATE
ZIP-level market 26571
- Home prices YoY
- 2.7%
- Active inventory
- 5
- Price-to-rent
- 6.7×
Monthly cashflow live
- Estimated rent
- $1,112 medium interval (Pro) →
- Mortgage (P&I)
- −$467
- Tax from tax record
- −$100 /mo · $1,200/yr
- Insurance
- −$37
- HOA
- −$0
- Vacancy / Maint / Mgmt
- −$234
- Net cashflow
- $275
Break-even live
Sensitivity live
| Price | -10% $325 | -5% $300 | +0% $275 | +5% $250 | +10% $225 |
|---|---|---|---|---|---|
| Rent | -10% $187 | -5% $231 | +0% $275 | +5% $319 | +10% $363 |
| Rate | -1.0pp $320 | -0.5pp $298 | base $275 | +0.5pp $252 | +1.0pp $228 |
UW: 25.0% down · 7.5% · 30yr · 1.5% tax · 5.0% vac · 8.0% maint · 8.0% mgmt
Financing live
Cash to close
- Down payment
- $22,250
- Closing costs
- $2,670
- Reserves months
- —
- Total cash needed
- —
Loan-product check · same deal, 3 products live
Conventional
25% down · 7.5% · 30yr
- Down + closing
- —
- Monthly P&I
- —
- Monthly cashflow
- —
- DSCR
- —
- Eligible?
- —
Personal DTI + credit; lowest rate.
DSCR
20% down · 8.5% · 30yr
- Down + closing
- —
- Monthly P&I
- —
- Monthly cashflow
- —
- DSCR
- —
- Eligible?
- —
No personal income docs; deal must DSCR.
Hard money
10% down · 12.0% · 12mo
- Down + closing
- —
- Monthly P&I
- —
- Monthly cashflow
- —
- DSCR
- —
- Eligible?
- —
Short-term bridge; refi at stabilization.
Listing history 16 events
-
2026-06-19days on market $89,000 Active 50 DOM
-
2026-06-18days on market $89,000 Active 49 DOM
-
2026-06-17days on market $89,000 Active 48 DOM
-
2026-06-16days on market $89,000 Active 47 DOM
-
2026-06-15days on market $89,000 Active 46 DOM
-
2026-06-14days on market $89,000 Active 44 DOM
-
2026-06-13pricedays on market $89,000 Active 43 DOM
-
2026-06-10days on market $95,000 Active 41 DOM
-
2026-06-09days on market $95,000 Active 40 DOM
-
2026-06-08days on market $95,000 Active 39 DOM
-
2026-06-07days on market $95,000 Active 38 DOM
-
2026-06-02days on market $95,000 Active 33 DOM
-
2026-06-01days on market $95,000 Active 32 DOM
-
2026-05-31days on market $95,000 Active 31 DOM
-
2026-05-30days on market $95,000 Active 30 DOM
-
2026-04-30$95,000 Active
ⓘ Source: listings_history table (triggers on properties + properties_extension) + one-shot
backfill from property_details.listing_events for pre-trigger history.
Tax reassessment forecast WV · Resets to sale price
- Current annual tax
- $1,200 · $100/mo
- Projected year-2 tax
- $1,200 · $100/mo
- Expected delta
- $0/yr ($0/mo · 0.0%)
ⓘ Screening estimate from a state-policy table — verify with the county assessor before closing.
Climate risk First Street
- Flood 1/10 Low FEMA zone X (unshaded) · 0% chance over 30 yrs
- Wildfire 3/10 Moderate
- Heat 4/10 Moderate 7 d/yr ≥97°F today · 20 d/yr by 30 yrs out
- Wind 1/10 Low 0% chance of damaging wind over 30 yrs
- Air quality 2/10 Low 0 unhealthy d/yr today · 1 by 30 yrs out
Nearby sold comps map
Loading sold comps map…
Walkable amenities ~0.75 mi
Loading nearby amenities…
Taxation est. · year 1
- Rental income
- $13,348
- − Mortgage interest
- −$4,985
- − Property taxes
- −$1,200
- − Insurance
- −$445
- − Repairs & maintenance
- −$1,068
- − Management
- −$1,068
- − Depreciation
- −$2,589
- Taxable income
- $1,992
- Est. tax owed @ 24.0%
- −$478
- After-tax cash flow
- $2,821/yr
For passive investors: Depreciation is non-cash, so a rental often shows a tax loss while cash-flowing — sheltering income. Rental losses are passive: they offset passive income freely, and up to $25,000/yr can offset ordinary (W-2) income if you actively participate and your MAGI is under $100k (phasing out to $0 by $150k); unused losses carry forward. On sale, claimed depreciation is recaptured at up to 25%, and gains may owe capital-gains tax (a 1031 exchange can defer both). Figures are a year-1 estimate at your 24.0% rate — not tax advice; consult a CPA.
Schools (NCES district)
- District
- Marion County Schools
- NCES district ID
- 5400720
- Math proficiency
- 30% ▼ -14.00%
- Reading proficiency
- 43% ▼ -8.00%
- Median HH income
- $42,195
- Composite
- 30.8/100
- National rank
- #6145
- State rank
- #11 of 55 in WV
Livability — Farmington
- Score
- 66/100
- State rank
- #107
- US rank
- #11596
Category grades
Schools grade is shown separately in the Schools card above.
Census & demographics
- Census place
- Farmington, WV
- Population (ZIP)
- 1,520
Population outlook (Marion County) Hauer SSP2
- Today (2025)
- 56,923 people
- By 2030
- 56,850 · -0.1%
- By 2040
- 56,469 · -0.8%
- By 2050
- 56,027 · -1.6%
- By 2075
- 55,509 · -2.5%
- By 2100
- 51,082 · -10.3%
Race, ethnicity, and origin ACS 2023
- Neighborhood character
- Predominantly White (98%)
- Race & ethnicity
- White 98% Two or more races 2%
- Common ancestry
- Romanian 6% Serbian 2% Italian 2%
- Languages at home
- 99% English-only · German/W. Germanic 1%
Political lean MEDSL · Marion
- 2024 margin
- Solid R (+31.2) · D 33.2% · R 64.5% · Other 2.3%
- 2008→2024 swing
- -31.7pp toward R · 2008: 0.5pp · 2024: -31.2pp
- All cycles
- 2024: R+31.2 2020: R+28.7 2016: R+33.5 2012: R+14.4 2008: D+0.5
Not yet ingested
- Civics
- —
Market trends
- HPI YoY
- ▲ 3.69%
- Current HPI
- 141.3928
- Rent YoY
- —
- Metro
- —
- State GDP YoY
- —
- F500 in state
- 0
Price history
1 event — show timeline
- 2026-04-30 Listed $95,000 NCWVREIN
Property tax history
+16.5%/yrLatest (2025): $1,200 · +6.0% YoY. Source: county tax records.
Cash-flow waterfall
monthlySold comps — $/sqft
last 12 mo · ≤1 miLoading sold comps…