411 Birchwood Dr · South Lockport, NY
Flood risk 6/10 · Moderate
- FEMA flood zone
- X (unshaded)
- Chance of flooding over 30 yrs
- 0.72%
- Est. flood insurance / yr
- $507 – $1,088
Fire risk 3/10 · Minor
- Est. fire insurance / yr
- $691 – $1,283
Heat risk 2/10 · Minimal
- Hot days now (above 94°F)
- 7 days/yr
- Hot days in 30 yrs
- 15 days/yr
Wind risk 1/10 · Minimal
- Chance of severe wind over 30 yrs
- —
Air-quality risk 2/10 · Minimal
- Unhealthy air days now
- 2 days/yr
- Unhealthy air days in 30 yrs
- 2 days/yr
Risk factors via First Street. Map © Google.
Why this score? — see what drove the B- grade
The composite is a weighted blend of 9 inputs, each scored 0–100. Each bar is that input's sub-score; the figure is the points it added to the 100-point composite (weight × sub-score).
- Cash flow +30.0/30.0
- DSCR +10.0/10.0
- 1% rule +8.8/10.0
- ARV discount +7.5/15.0
- Schools +3.9/10.0
- Rent growth +3.4/5.0
- Livability +3.3/5.0
- Condition / age +2.5/5.0
- Appreciation +0.0/10.0
$107,900
🖨 Deal sheet 📄 Offer letter ✓ Due diligence
Listing remarks
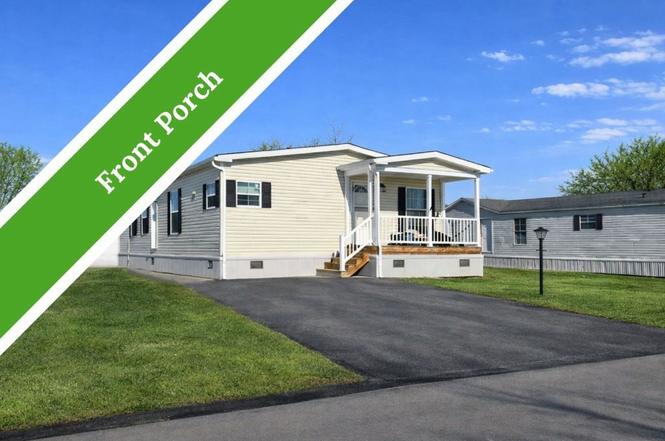
Our brand new homes are arriving and ready for you to call home sweet home! The new Seneca model features a comfortable covered front porch right at your off street parking pad area. The new concrete walkway along side of the home brings right into the large laundry room and has hookups ready for your washer and electric dryer. You will find a handy storage cabinet and open space. The custom backsplash and glass doors add another great feature to finish a contemporary look. A double stainless sink with an upgraded swivel gooseneck faucet complete the overall custom look. The front porch leads you right into the open concept floor plan extending 28 ft. across allowing for family and friend c
Key facts
- Covered front porch
- Concrete walkway
- Custom backsplash
Tags
Property features AI
Finance
- Other: Virtual tour available
- Financial info: List price $109,900
Exterior
- Home design: Single-family property (Spec, Seneca plan); Active listing
- Exterior features: Located at 411 Birchwood Dr, Lockport NY 14094; Living area approximately 1,344
Interior
- Bedrooms: 3 bedrooms
- Bathrooms: 2 full bathrooms
- Interior features: Spec home (Seneca plan)
Neighborhood map
What this means for you Summary
Snapshot
- This is a 3-bed/2.0-bath manufactured listed at $108k.
Deal economics
- At list price, monthly cash flow is $427 ($5k/yr) — positive.
- The deal already cash-flows at list — no discount required.
- Meets the 1% rule at list price ($1k rent vs $108k).
- Recommended offer: $98k (9.0% below list) — sets the bar for market timing.
- Cap rate 11.0% vs local median 1.5% in South Lockport — top-decile yield for the area; either an underpriced asset or a hidden risk that comps aren't pricing in. Stress-test before assuming the spread holds.
Location & tenants
- Location reads 66/100 on livability (#633 in NY) — a middle-class / working-renter tenant base. Strengths: cost of living A+, health & safety A+; Watch: employment D+, schools F, crime F.
- Lockport City School District (town): math 44% / reading 49% proficiency, ranked #452 of 590 in NY (top 77%) — families likely to look elsewhere, expect single-tenant / working-renter base with shorter leases.
- Market conditions: Rents rising (+3.7%/yr); 357 active listings in the ZIP; 1 comparable units currently listed for rent nearby; solid renter incomes; 167 units permitted in Niagara County in 2024 (0 in 5+ unit buildings).
Forward outlook
- Local home prices are declining (-3.0%/yr); year-one equity from $746 of loan paydown is wiped out by about $3k of value loss. Plan a longer hold.
- Niagara County population projected at -19% by 2050 — secular population decline; favor cash flow + early exit over multi-decade hold.
- At projected returns (-3.0% appreciation + 3.7% rent growth), your $30k cash investment doubles in ~7 years — after that, you're playing with house money.
Negotiation context
- It's been on market 104 days — a 9% lower offer ($98k) is reasonable based on typical stale-listing flexibility.
Risks & watch-outs
- Climate carrying-cost: major flood risk — expect insurance premiums to compound above CPI over the hold.
Questions for the listing agent
- It's been on market 104 days. Have you received any prior offers? Is the seller open to a 9% concession, seller financing, or rate buy-down credit?
- Why hasn't it sold? Are there any deal-killer items the seller is aware of (foundation, flood, title, zoning, code violations)?
- Is there a deadline driving the sale (1031 exchange, divorce, estate, relocation)? That informs how much negotiation room exists.
- Schools are F-rated, which usually means shorter tenancies and higher turnover. Who's the typical renter profile here, and what's been the actual vacancy rate?
- Crime grade is F in this area — have there been break-ins, vandalism, or insurance claims at this property in the last 3 years? What carrier currently insures it and at what premium?
- What's the average days-on-market for RENTAL listings here right now (not sales)? A rising rental-DOM trend means longer vacancies and softer asking-rent achievability than the comps imply.
- What's the recent tenant-quality profile in this submarket — average credit score on applications, eviction rate, late-payment / NSF rate, and stable-employment percentage? A property-management company in the area should have these aggregated.
- How much new for-sale + rental construction is in the pipeline within 1–3 miles? Heavy new supply typically softens prices + rents 12–24 months out; constrained supply supports both.
Investment metrics
- 1% rule
- 1.38% ✓
- Cap rate
- 11.05%
- Cash-on-cash
- 16.98%
- DSCR
- 1.76
- GRM
- 6.1
CMA / ARV
- ARV (on-the-fly)
- $55,104
- Comps found
- 12
Show comp detail 12 sales within ~0.75 mi
| Address | Dist | Beds/Ba | Sqft | Sold | Price | $/sf | Match |
|---|---|---|---|---|---|---|---|
| 433 Chestnut Dr | 0.12mi | 3/2.0 | 1,344 (0%) | 5mo | $55,000 | $41 | 90 |
| 525 Applewood Dr | 0.13mi | 2/2.0 (-1) | 1,400 (+4%) | 6mo | $50,000 | $36 | 77 |
| 643 Birchwood Dr | 0.34mi | 3/2.0 | 1,366 (+2%) | 6mo | $69,000 | $51 | 76 |
| 519 Applewood Dr #519 | 0.09mi | 4/2.0 (+1) | 1,456 (+8%) | 5mo | $42,500 | $29 | 72 |
| 1070 Fernwood Dr | 0.55mi | 3/2.0 | 1,344 (0%) | 5mo | $72,000 | $54 | 70 |
| 149 Crestwood Dr | 0.28mi | 3/2.0 | 1,248 (-7%) | 7mo | $25,000 | $20 | 70 |
| 210 Ash St | 0.36mi | 3/2.0 | 1,216 (-10%) | 0mo | $75,000 | $62 | 67 |
| 901 Hollywood Dr | 0.39mi | 3/2.0 | 1,456 (+8%) | 2mo | $82,000 | $56 | 66 |
| 1009 Ridgewood | 0.46mi | 3/2.0 | 1,461 (+9%) | 1mo | $50,000 | $34 | 64 |
| 464 Jim Kelly Dr | 0.37mi | 2/2.0 (-1) | 1,216 (-10%) | 2mo | $55,000 | $45 | 60 |
| 1352 Fernwood Dr | 0.37mi | 2/1.0 (-1) | 1,152 (-14%) | 4mo | $39,000 | $34 | 47 |
| 288 Fox Hunt Dr | 0.46mi | 2/1.0 (-1) | 1,164 (-13%) | 2mo | $45,600 | $39 | 46 |
Match score weights: distance 35% · size 25% · config 20% · recency 20%. Top-matched comps best support the ARV.
Projected returns pro-forma
-3.0% appreciation · 3.67% rent growth · sell at horizon
- IRR
- 9.0%
- Equity multiple
- 1.36×
- Total profit
- $10,768
- Equity at exit
- $16,088
- IRR
- 18.7%
- Equity multiple
- 2.61×
- Total profit
- $48,712
- Equity at exit
- $9,329
Cash invested: $30,212 (down + closing). Projections, not guarantees.
Landlord ↔ Tenant lean methodology
- Overall (STATE)
- 15 Strongly Tenant-Friendly
- State New York
- 15 Strongly Tenant-Friendly · D+10
- County
- — inherits STATE
- City
- — inherits STATE
ZIP-level market 14094
- Rents YoY
- 3.7%
- Active inventory
- 357
- Price-to-rent
- 6.1×
Monthly cashflow live
- Estimated rent
- $1,485 medium interval (Pro) →
- Mortgage (P&I)
- −$566
- Tax est. 1.5%
- −$135 /mo · $1,618/yr
- Insurance
- −$45
- HOA
- −$0
- Vacancy / Maint / Mgmt
- −$312
- Net cashflow
- $427
Break-even live
UW: 25.0% down · 7.5% · 30yr · 1.5% tax · 5.0% vac · 8.0% maint · 8.0% mgmt
Financing live
Cash to close
- Down payment
- $26,975
- Closing costs
- $3,237
- Reserves months
- —
- Total cash needed
- —
Loan-product check · same deal, 3 products live
Conventional
25% down · 7.5% · 30yr
- Down + closing
- —
- Monthly P&I
- —
- Monthly cashflow
- —
- DSCR
- —
- Eligible?
- —
Personal DTI + credit; lowest rate.
DSCR
20% down · 8.5% · 30yr
- Down + closing
- —
- Monthly P&I
- —
- Monthly cashflow
- —
- DSCR
- —
- Eligible?
- —
No personal income docs; deal must DSCR.
Hard money
10% down · 12.0% · 12mo
- Down + closing
- —
- Monthly P&I
- —
- Monthly cashflow
- —
- DSCR
- —
- Eligible?
- —
Short-term bridge; refi at stabilization.
Rent comps 1 comps
| Address | Beds | Baths | Sqft | Rent | $/sqft | DOM | Units | Dist |
|---|---|---|---|---|---|---|---|---|
| 5834 S Transit Rd Lockport, NY | 2.0 | 1.0 | 1200 | $1,600 | $1.33 | 2d | 1 | 1.38mi |
Listing history 15 events
-
2026-06-18days on market $107,900 Active 104 DOM
-
2026-06-17days on market $107,900 Active 103 DOM
-
2026-06-16days on market $107,900 Active 102 DOM
-
2026-06-15days on market $107,900 Active 101 DOM
-
2026-06-13days on market $107,900 Active 99 DOM
-
2026-06-13days on market $107,900 Active 98 DOM
-
2026-06-10days on market $107,900 Active 96 DOM
-
2026-06-09days on market $107,900 Active 95 DOM
-
2026-06-08days on market $107,900 Active 94 DOM
-
2026-06-07days on market $107,900 Active 93 DOM
-
2026-06-05days on market $107,900 Active 90 DOM
-
2026-06-03days on market $107,900 Active 89 DOM
-
2026-06-02days on market $107,900 Active 88 DOM
-
2026-06-01days on market $107,900 Active 87 DOM
-
2026-05-31days on market $107,900 Active 86 DOM
ⓘ Source: listings_history table (triggers on properties + properties_extension) + one-shot
backfill from property_details.listing_events for pre-trigger history.
Climate risk First Street
- Flood 6/10 Major FEMA zone X (unshaded) · 72% chance over 30 yrs
- Wildfire 3/10 Moderate
- Heat 2/10 Low 7 d/yr ≥94°F today · 15 d/yr by 30 yrs out
- Wind 1/10 Low
- Air quality 2/10 Low 2 unhealthy d/yr today · 2 by 30 yrs out
Nearby sold comps map
Loading sold comps map…
Walkable amenities ~0.75 mi
Loading nearby amenities…
Taxation est. · year 1
- Rental income
- $17,819
- − Mortgage interest
- −$6,044
- − Property taxes
- −$1,618
- − Insurance
- −$540
- − Repairs & maintenance
- −$1,426
- − Management
- −$1,426
- − Depreciation
- −$3,139
- Taxable income
- $3,627
- Est. tax owed @ 24.0%
- −$870
- After-tax cash flow
- $4,258/yr
For passive investors: Depreciation is non-cash, so a rental often shows a tax loss while cash-flowing — sheltering income. Rental losses are passive: they offset passive income freely, and up to $25,000/yr can offset ordinary (W-2) income if you actively participate and your MAGI is under $100k (phasing out to $0 by $150k); unused losses carry forward. On sale, claimed depreciation is recaptured at up to 25%, and gains may owe capital-gains tax (a 1031 exchange can defer both). Figures are a year-1 estimate at your 24.0% rate — not tax advice; consult a CPA.
Schools (NCES district)
- District
- Lockport City School District
- NCES district ID
- 3617670
- Math proficiency
- 44% ▼ -7.00%
- Reading proficiency
- 49% ▲ 3.00%
- Median HH income
- $43,793
- Composite
- 39.28/100
- National rank
- #3997
- State rank
- #452 of 590 in NY
Livability — South Lockport
- Score
- 66/100
- State rank
- #633
- US rank
- #11642
Category grades
Schools grade is shown separately in the Schools card above.
Census & demographics
- Census place
- South Lockport, NY
- County
- Niagara County · 157,377 people
- Metro
- Buffalo-Cheektowaga, NY
- Population (ZIP)
- 50,153
- Household income
- $75,427
- Rent vs Own
- Severe rent burden
- 1112.0
Population outlook (Niagara County) Hauer SSP2
- Today (2025)
- 204,149 people
- By 2030
- 197,900 · -3.1%
- By 2040
- 182,239 · -10.7%
- By 2050
- 165,198 · -19.1%
- By 2075
- 129,416 · -36.6%
- By 2100
- 96,222 · -52.9%
Race, ethnicity, and origin ACS 2023
- Neighborhood character
- Predominantly White (84%)
- Race & ethnicity
- White 84% Two or more races 6% Black 6% Hispanic / Latino 3%
- Common ancestry
- Romanian 9% Slovak 2% Lithuanian 2%
- Foreign-born
- 3% · Canada
- Languages at home
- 96% English-only · Spanish 1% Russian/Polish/Slavic 1% Other Indo-European 1%
Political lean MEDSL · Niagara
- 2024 margin
- R (+14.9) · D 42.5% · R 57.5%
- 2008→2024 swing
- -15.9pp toward R · 2008: 1.0pp · 2024: -14.9pp
- All cycles
- 2024: R+14.9 2020: R+9.7 2016: R+19.0 2012: D+0.6 2008: D+1.0
Not yet ingested
- Civics
- —
Market trends
- HPI YoY
- ▼ -262.57%
- Current HPI
- 303.6109
- Rent YoY
- ▲ 3.67%
- Metro
- Buffalo-Cheektowaga, NY
- State GDP YoY
- ▲ 2.60%
- F500 in state
- 92
Industry mix (Fortune 500 HQ in NY)
| Industry | F500 HQs | Revenue |
|---|---|---|
| Financial Services | 10 | $950B |
|
||
| Consumer Goods | 9 | $162B |
|
||
| Insurance | 4 | $225B |
|
||
| Telecommunications | 2 | $144B |
|
||
| Pharmaceuticals | 2 | $112B |
|
||
| Media / Entertainment | 2 | $69B |
|
||
Cash-flow waterfall
monthlySold comps — $/sqft
last 12 mo · ≤1 miLoading sold comps…