402 E State Highway 121 · Lewisville, TX
Flood risk 1/10 · Minimal
- FEMA flood zone
- X (unshaded)
- Chance of flooding over 30 yrs
- 0.0%
- Est. flood insurance / yr
- $507 – $1,088
Fire risk 1/10 · Minimal
- Est. fire insurance / yr
- $1,222 – $2,270
Heat risk 7/10 · Major
- Hot days now (above 109°F)
- 7 days/yr
- Hot days in 30 yrs
- 22 days/yr
Wind risk 5/10 · Moderate
- Chance of severe wind over 30 yrs
- 24.0%
Air-quality risk 3/10 · Minor
- Unhealthy air days now
- 3 days/yr
- Unhealthy air days in 30 yrs
- 4 days/yr
Risk factors via First Street. Map © Google.
Why this score? — see what drove the D grade
The composite is a weighted blend of 9 inputs, each scored 0–100. Each bar is that input's sub-score; the figure is the points it added to the 100-point composite (weight × sub-score).
- Cash flow +15.0/30.0
- ARV discount +7.5/15.0
- 1% rule +5.0/10.0
- DSCR +5.0/10.0
- Schools +4.7/10.0
- Livability +3.5/5.0
- Condition / age +2.5/5.0
- Rent growth +1.7/5.0
- Appreciation +0.0/10.0
$40,000
🖨 Deal sheet 📄 Offer letter ✓ Due diligence
Listing remarks
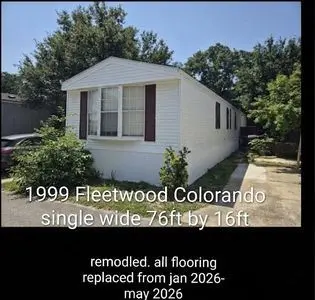
Beautiful, fully remodeled mobile home. We are relocating out of state on July 6 and absolutely need this sold before we leave. Clean title in hand. First serious cash offer takes it! Shed needs replaced. Home is paid off. Driveway fits 2-3 cars, and lot rent is 980 and you must be approved by park. Hranite counters, vessle sinks and a/c was replaced a year ago and half roof replacement april 2026
Key facts
- Built 2017
- Listed 11 days
Neighborhood map
What this means for you Summary
Snapshot
- This is a 3-bed/2.0-bath manufactured listed at $40k.
Deal economics
- At list price, monthly cash flow is $1k ($14k/yr) — positive.
- The deal already cash-flows at list — no discount required.
- Meets the 1% rule at list price ($2k rent vs $40k).
- Cap rate 41.7% vs local median 3.1% in Lewisville — top-decile yield for the area; either an underpriced asset or a hidden risk that comps aren't pricing in. Stress-test before assuming the spread holds.
Location & tenants
- Location reads 69/100 on livability (#440 in TX) — a middle-class / working-renter tenant base. Strengths: housing A+, cost of living A, crime B+; Watch: commute D+, schools D-, amenities F.
- Lewisville ISD (suburban): math 49% / reading 54% proficiency, ranked #109 of 826 in TX (top 13%) — acceptable for families but not a draw, mixed tenant base, ~2y average lease.
- Market conditions: Rents falling (-3.3%/yr); 37 active listings in the ZIP; 34 comparable units currently listed for rent nearby; rentals leasing fast (median 3d on market — plan ~1-2 weeks tenant-placement turnaround); solid renter incomes; 10,531 units permitted in Denton County in 2024 (2,713 in 5+ unit buildings).
Forward outlook
- Local home prices are declining (-3.0%/yr); year-one equity from $277 of loan paydown is wiped out by about $1k of value loss. Plan a longer hold.
- Denton County population projected at +66% by 2050 — long-run rental-demand tailwind backs the buy-and-hold thesis.
- At projected returns (-3.0% appreciation + 0.0% rent growth), your $11k cash investment doubles in ~1 year — after that, you're playing with house money.
Negotiation context
- Only 12 days on market — expect competitive offers; lowballing is unlikely to land.
Risks & watch-outs
- Climate carrying-cost: moderate wind risk, 24% chance of damaging wind over 30y; extreme-heat days projected 7→22/yr by 2055 (HVAC capex compounding) — expect insurance premiums to compound above CPI over the hold.
Questions for the listing agent
- Is there a deadline driving the sale (1031 exchange, divorce, estate, relocation)? That informs how much negotiation room exists.
- Schools are D-rated, which usually means shorter tenancies and higher turnover. Who's the typical renter profile here, and what's been the actual vacancy rate?
- The area grade is low — what's the realistic commute time and amenity access for the typical tenant pool here? Any planned neighborhood developments (good or bad) we should know about?
- What's the average days-on-market for RENTAL listings here right now (not sales)? A rising rental-DOM trend means longer vacancies and softer asking-rent achievability than the comps imply.
- What's the recent tenant-quality profile in this submarket — average credit score on applications, eviction rate, late-payment / NSF rate, and stable-employment percentage? A property-management company in the area should have these aggregated.
- How much new for-sale + rental construction is in the pipeline within 1–3 miles? Heavy new supply typically softens prices + rents 12–24 months out; constrained supply supports both.
Investment metrics
- 1% rule
- 4.60% ✓
- Cap rate
- 41.70%
- Cash-on-cash
- 126.46%
- DSCR
- 6.63
- GRM
- 1.8
CMA / ARV
No comps found within radius.
Projected returns pro-forma
-3.0% appreciation · 0.0% rent growth · sell at horizon
- IRR
- —
- Equity multiple
- 6.65×
- Total profit
- $63,326
- Equity at exit
- $5,964
- IRR
- —
- Equity multiple
- 12.72×
- Total profit
- $131,210
- Equity at exit
- $3,458
Cash invested: $11,200 (down + closing). Projections, not guarantees.
Landlord ↔ Tenant lean methodology
- Overall (STATE)
- 87 Strongly Landlord-Friendly
- State Texas
- 87 Strongly Landlord-Friendly · R+5
- County
- — inherits STATE
- City
- — inherits STATE
ZIP-level market 75057
- Home prices YoY
- -19.8%
- Rents YoY
- -3.3%
- Active inventory
- 37
- Price-to-rent
- 1.8×
Monthly cashflow live
- Estimated rent
- $1,840 high interval (Pro) →
- Mortgage (P&I)
- −$210
- Tax from tax record
- −$47 /mo · $559/yr
- Insurance
- −$17
- HOA
- −$0
- Vacancy / Maint / Mgmt
- −$386
- Net cashflow
- $1,180
Break-even live
UW: 25.0% down · 7.5% · 30yr · 1.5% tax · 5.0% vac · 8.0% maint · 8.0% mgmt
Financing live
Cash to close
- Down payment
- $10,000
- Closing costs
- $1,200
- Reserves months
- —
- Total cash needed
- —
Loan-product check · same deal, 3 products live
Conventional
25% down · 7.5% · 30yr
- Down + closing
- —
- Monthly P&I
- —
- Monthly cashflow
- —
- DSCR
- —
- Eligible?
- —
Personal DTI + credit; lowest rate.
DSCR
20% down · 8.5% · 30yr
- Down + closing
- —
- Monthly P&I
- —
- Monthly cashflow
- —
- DSCR
- —
- Eligible?
- —
No personal income docs; deal must DSCR.
Hard money
10% down · 12.0% · 12mo
- Down + closing
- —
- Monthly P&I
- —
- Monthly cashflow
- —
- DSCR
- —
- Eligible?
- —
Short-term bridge; refi at stabilization.
Rent comps 34 comps
| Address | Beds | Baths | Sqft | Rent | $/sqft | DOM | Units | Dist |
|---|---|---|---|---|---|---|---|---|
| 1090 S Charles St Lewisville, TX | 2.0 | 1.0 | 710 | $1,350 | $1.90 | 16d | 3 | 0.52mi |
| 220 S Shore Pl Lewisville, TX | 3.0 | 2.0 | 1291 | $1,925 | $1.49 | 43d | 1 | 0.58mi |
| 324 N Shore Pl Lewisville, TX | 3.0 | 1.5 | 1160 | $2,150 | $1.85 | 20d | 1 | 0.72mi |
| 843 Harbor Dr Lewisville, TX | 3.0 | 1.0 | 1210 | $2,000 | $1.65 | 43d | 1 | 0.74mi |
| 535 S Mill St Lewisville, TX | 2.0 | 1.0–2.0 | 827 | $2,401 | $2.90 | 2d | 25 | 0.76mi |
| 1531 S State Highway 121 Unit 2118 Lewisville, TX | 2.0 | 2.0 | 1082 | $1,371 | $1.27 | 3d | 1 | 0.81mi |
| 1531 S State Highway 121 Lewisville, TX | 1.0–3.0 | 1.0–2.0 | 928 | $2,024 | $2.18 | 1d | 81 | 0.85mi |
| 200 Oak Knoll Cir Lewisville, TX | 1.0–2.0 | 1.0–2.0 | 820 | $1,273 | $1.55 | 2d | 57 | 0.90mi |
| 100 E Main St Lewisville, TX | 1.0–2.0 | 1.0–2.0 | 1071 | $2,620 | $2.45 | 1d | 17 | 0.90mi |
| 120 Main St Lewisville, TX | 1.0–3.0 | 1.0–2.0 | 1542 | $3,464 | $2.25 | 1d | 13 | 0.94mi |
| 201 W Southwest Pkwy Unit 2118 Lewisville, TX | 2.0 | 2.0 | 884 | $1,283 | $1.45 | 3d | 1 | 0.99mi |
| 201 W Southwest Pkwy Unit 258 Lewisville, TX | 2.0 | 2.0 | 783 | $1,251 | $1.60 | 43d | 1 | 0.99mi |
| 247 E Southwest Pkwy Lewisville, TX | 1.0–2.0 | 1.0–2.0 | 750 | $1,508 | $2.01 | 2d | 23 | 0.99mi |
| 1679 S State Highway 121 Lewisville, TX | 2.0 | 2.0 | 1000 | $1,525 | $1.52 | 24d | 1 | 1.03mi |
| 502 E College St Lewisville, TX | 1.0–2.0 | 1.0–2.0 | 964 | $2,115 | $2.19 | 2d | 38 | 1.04mi |
| 450 S Edna Ave Lewisville, TX | 3.0 | 2.5 | 1371 | $5,000 | $3.65 | 3d | 1 | 1.09mi |
| 248 E Southwest Pkwy Lewisville, TX | 1.0–2.0 | 1.0–2.0 | 764 | $1,474 | $1.93 | 1d | 20 | 1.10mi |
| 396 E Southwest Pkwy Lewisville, TX | 1.0–2.0 | 1.0–2.0 | 744 | $1,342 | $1.80 | 1d | 31 | 1.11mi |
| 400 W Main St Lewisville, TX | 1.0–3.0 | 1.0–2.0 | 1000 | $2,695 | $2.69 | 2d | 39 | 1.19mi |
| 357 E Corporate Dr Lewisville, TX | 1.0–2.0 | 1.0–2.0 | 760 | $1,309 | $1.72 | 1d | 10 | 1.23mi |
| 376 W Walters St Lewisville, TX | 2.0 | 1.0 | 1008 | $1,650 | $1.64 | 43d | 1 | 1.27mi |
| 1902 S State Highway 121 Lewisville, TX | 2.0 | 1.0 | 966 | $1,765 | $1.83 | 43d | 1 | 1.30mi |
| 1902 S State Highway 121 Lewisville, TX | 2.0 | 2.0 | 925 | $1,599 | $1.73 | 24d | 1 | 1.30mi |
| 712 Ridgecrest Dr Lewisville, TX | 3.0 | 2.0 | 1128 | $1,850 | $1.64 | 44d | 1 | 1.33mi |
| 265 E Corporate Dr Unit 3121 Lewisville, TX | 3.0 | 2.0 | 1208 | $1,954 | $1.62 | 12d | 1 | 1.37mi |
| 265 E Corporate Dr Unit 3121 Lewisville, TX | 3.0 | 2.0 | 1208 | $1,911 | $1.58 | 3d | 1 | 1.37mi |
| 265 E Corporate Dr Unit 288 Lewisville, TX | 2.0 | 2.0 | 1108 | $1,651 | $1.49 | 3d | 1 | 1.37mi |
| 265 E Corporate Dr Unit 322 Lewisville, TX | 2.0 | 2.0 | 1000 | $1,424 | $1.42 | 43d | 1 | 1.37mi |
| 760 S Edmonds Ln Lewisville, TX | 2.0 | 1.0 | 753 | $1,459 | $1.94 | 5d | 1 | 1.42mi |
| 2190 Uecker Ln Unit 2223 Lewisville, TX | 3.0 | 2.0 | 1279 | $1,871 | $1.46 | 3d | 1 | 1.43mi |
| 2190 Uecker Ln Unit 2247 Lewisville, TX | 2.0 | 2.0 | 1029 | $1,494 | $1.45 | 43d | 1 | 1.43mi |
| 2190 Uecker Ln Unit 2227 Lewisville, TX | 2.0 | 2.0 | 1029 | $1,461 | $1.42 | 3d | 1 | 1.44mi |
| 247 E Corporate Dr Lewisville, TX | 2.0 | 1.0–2.0 | 781 | $1,548 | $1.98 | 1d | 21 | 1.46mi |
| 350 Continental Dr Lewisville, TX | 1.0–3.0 | 1.0–2.0 | 1004 | $1,888 | $1.88 | 1d | 18 | 1.48mi |
Listing history 10 events
-
2026-06-18days on market $40,000 Active 12 DOM
-
2026-06-17days on market $40,000 Active 11 DOM
-
2026-06-16days on market $40,000 Active 10 DOM
-
2026-06-15days on market $40,000 Active 9 DOM
-
2026-06-13days on market $40,000 Active 7 DOM
-
2026-06-13days on market $40,000 Active 6 DOM
-
2026-06-09days on market $40,000 Active 3 DOM
-
2026-06-08days on market $40,000 Active 2 DOM
-
2026-06-07remarks 400-char remark
-
2026-06-07$40,000 Active 1 DOM
ⓘ Source: listings_history table (triggers on properties + properties_extension) + one-shot
backfill from property_details.listing_events for pre-trigger history.
Tax reassessment forecast TX · Resets to sale price
- Current annual tax
- $559 · $47/mo
- Projected year-2 tax
- $732 · $61/mo
- Expected delta
- +$173/yr (+$14/mo · 30.9%)
ⓘ Screening estimate from a state-policy table — verify with the county assessor before closing.
Climate risk First Street
- Flood 1/10 Low FEMA zone X (unshaded) · 0% chance over 30 yrs
- Wildfire 1/10 Low
- Heat 7/10 Severe 7 d/yr ≥109°F today · 22 d/yr by 30 yrs out
- Wind 5/10 Major 24% chance of damaging wind over 30 yrs
- Air quality 3/10 Moderate 3 unhealthy d/yr today · 4 by 30 yrs out
Nearby sold comps map
Loading sold comps map…
Walkable amenities ~0.75 mi
Loading nearby amenities…
Taxation est. · year 1
- Rental income
- $22,076
- − Mortgage interest
- −$2,241
- − Property taxes
- −$559
- − Insurance
- −$200
- − Repairs & maintenance
- −$1,766
- − Management
- −$1,766
- − Depreciation
- −$1,164
- Taxable income
- $14,380
- Est. tax owed @ 24.0%
- −$3,451
- After-tax cash flow
- $10,712/yr
For passive investors: Depreciation is non-cash, so a rental often shows a tax loss while cash-flowing — sheltering income. Rental losses are passive: they offset passive income freely, and up to $25,000/yr can offset ordinary (W-2) income if you actively participate and your MAGI is under $100k (phasing out to $0 by $150k); unused losses carry forward. On sale, claimed depreciation is recaptured at up to 25%, and gains may owe capital-gains tax (a 1031 exchange can defer both). Figures are a year-1 estimate at your 24.0% rate — not tax advice; consult a CPA.
Schools (NCES district)
- District
- Lewisville ISD
- NCES district ID
- 4827300
- Math proficiency
- 49% ▼ -10.00%
- Reading proficiency
- 54% ▼ -4.00%
- Median HH income
- $82,351
- Composite
- 47.1/100
- National rank
- #2333
- State rank
- #109 of 826 in TX
Livability — Lewisville
- Score
- 69/100
- State rank
- #440
- US rank
- #8991
Category grades
Schools grade is shown separately in the Schools card above.
Census & demographics
- Census place
- Lewisville, TX
- County
- Denton County · 901,654 people
- City population
- 84,871
- Metro
- Dallas-Fort Worth-Arlington, TX
- Population (ZIP)
- 17,958
- Household income
- $82,803
- Rent vs Own
- Severe rent burden
- 975.0
Population outlook (Denton County) Hauer SSP2
- Today (2025)
- 1,053,010 people
- By 2030
- 1,192,269 · +13.2%
- By 2040
- 1,472,920 · +39.9%
- By 2050
- 1,746,506 · +65.9%
- By 2075
- 2,358,497 · +124.0%
- By 2100
- 2,779,183 · +163.9%
Race, ethnicity, and origin ACS 2023
- Neighborhood character
- Diverse neighborhood (Simpson 0.66)
- Race & ethnicity
- Hispanic / Latino 42% White 39% Two or more races 23% Black 11% Asian 3% Native American 2%
- Hispanic origin (detail)
- Mexican 34%
- Common ancestry
- Swedish 1% Slovak 1% Serbian 1%
- Foreign-born
- 17% · Canada, South Korea, Vietnam
- Languages at home
- 62% English-only · Spanish 32% Korean 1% Other Asian/Pacific 1%
Political lean MEDSL · Denton
- 2024 margin
- R (+13.2) · D 42.7% · R 55.8% · Other 1.5%
- 2008→2024 swing
- +11.0pp toward D · 2008: -24.2pp · 2024: -13.2pp
- All cycles
- 2024: R+13.2 2020: R+8.1 2016: R+20.2 2012: R+31.7 2008: R+24.2
Not yet ingested
- Civics
- —
Market trends
- HPI YoY
- ▼ -76.22%
- Current HPI
- 308.1135
- Rent YoY
- ▼ -3.28%
- Metro
- Dallas-Fort Worth-Arlington, TX
- State GDP YoY
- ▲ 3.95%
- F500 in state
- 110
Industry mix (Fortune 500 HQ in TX)
| Industry | F500 HQs | Revenue |
|---|---|---|
| Energy | 16 | $1,198B |
|
||
| Technology | 5 | $198B |
|
||
| Engineering / Construction | 4 | $72B |
|
||
| Energy Services | 3 | $60B |
|
||
| Utilities | 3 | $41B |
|
||
| Healthcare | 2 | $330B |
|
||
Price history
1 event — show timeline
- 2026-06-07 Listed $40,000 FSBO.com
Cash-flow waterfall
monthlySold comps — $/sqft
last 12 mo · ≤1 miLoading sold comps…