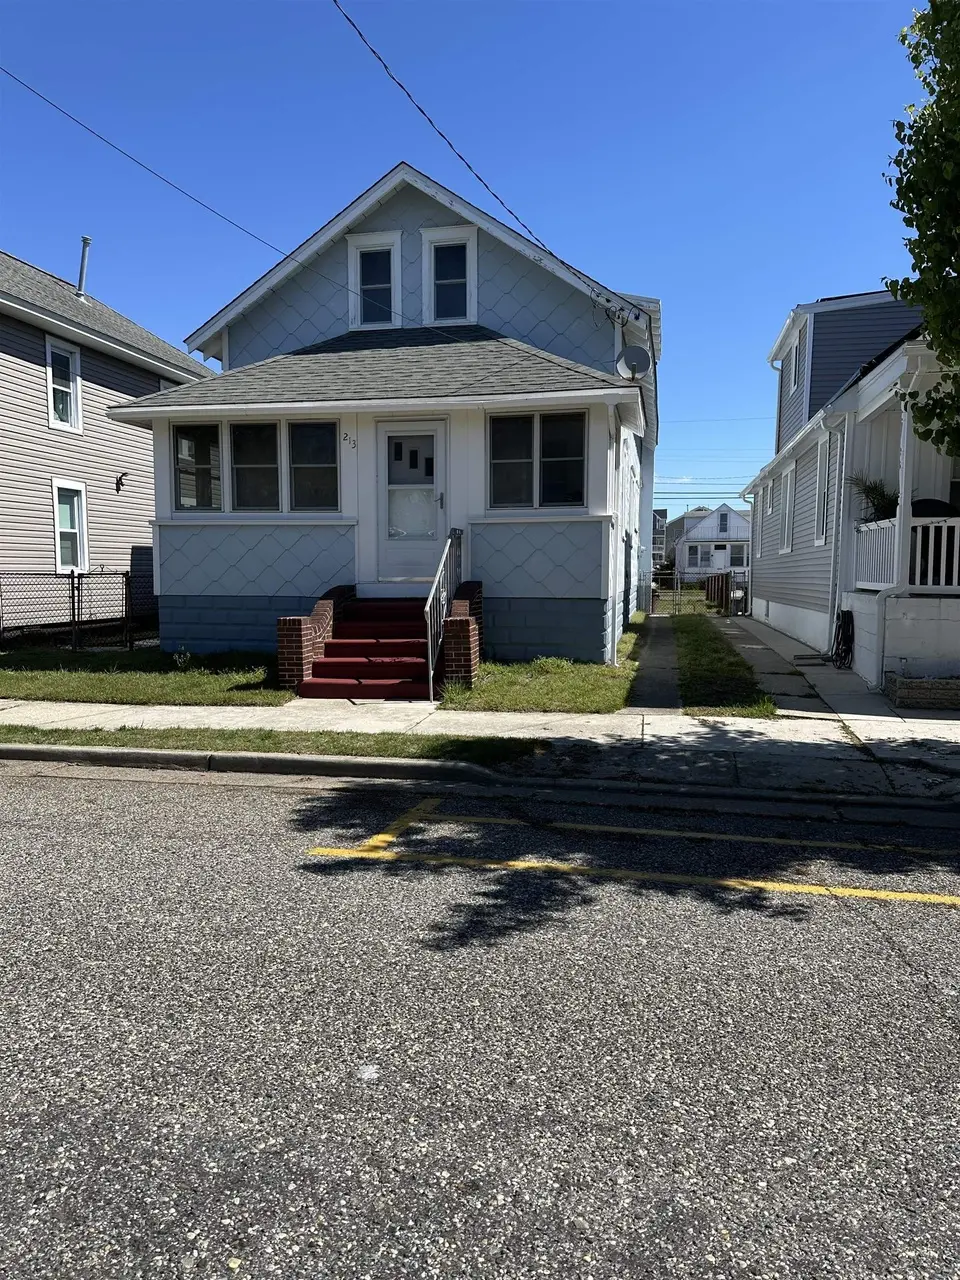
213 W Juniper Ave · Wildwood, NJ
Flood risk 10/10 · Severe
- FEMA flood zone
- AE
- Chance of flooding over 30 yrs
- 0.99%
- Est. flood insurance / yr
- $1,737 – $8,500
Fire risk 1/10 · Minimal
- Est. fire insurance / yr
- $526 – $976
Heat risk 8/10 · Major
- Hot days now (above 95°F)
- 7 days/yr
- Hot days in 30 yrs
- 19 days/yr
Wind risk 8/10 · Major
- Chance of severe wind over 30 yrs
- 80.0%
Air-quality risk 2/10 · Minimal
- Unhealthy air days now
- 1 days/yr
- Unhealthy air days in 30 yrs
- 1 days/yr
Risk factors via First Street. Map © Google.
Why this score? — see what drove the B grade
The composite is a weighted blend of 9 inputs, each scored 0–100. Each bar is that input's sub-score; the figure is the points it added to the 100-point composite (weight × sub-score).
- Cash flow +30.0/30.0
- ARV discount +15.0/15.0
- DSCR +10.0/10.0
- 1% rule +8.2/10.0
- Livability +3.7/5.0
- Rent growth +2.5/5.0
- Condition / age +2.5/5.0
- Schools +1.6/10.0
- Appreciation +0.0/10.0
$449,900
🖨 Deal sheet 📄 Offer letter ✓ Due diligence
Listing remarks
This property is an Estate and is being sold by the Executor. Waiting for the Tax Certificate from the State should be momentarily. Home has much potential in need of some remodeling, the Kitchen has been refurbished, including the roof, and some additional rooms. Windows have been replaced within the past few years. The second floor has an outside entrance which needs repair. The second floor has been gutted, ready for your remodeling. The property has an extensive back yard which is enclosed by a fence, with a rear gate. Property is being sold by the estate in "As is" condition.
Key facts
- Enclosed by a fence
- Extensive back yard
- 2 parking spots
Tags
Property features AI
Exterior
- Parking: Concrete parking pad for 2 cars
- Utilities: City/public water; City/public sewer; Natural gas hot water
- Home design: Property listed for sale; 30' frontage
- Construction: Asbestos exterior
- Exterior features: Fenced yard; Cable TV available; Sidewalks
Interior
- Kitchen: Range; Oven; Refrigerator; Disposal; Natural gas stove
- Bedrooms: 3 bedrooms
- Flooring: Wood flooring; Laminate flooring
- Bathrooms: 1 full bathroom
- Heating & cooling: Natural gas heating; Electric; Radiator; Forced air; Hot water heating
- Interior features: Wood and laminate flooring throughout; Living room; Dining room; Kitchen; Laundry/utility room; Florida room; Crawl space basement with outside entrance; Curtains, shades and blinds included; Partial furniture included; Smoke/Fire detector
- Laundry & utility: Washer; Dryer; Laundry/utility room
Neighborhood map
What this means for you Summary
Snapshot
- This is a 3-bed/1.0-bath single-family listed at $450k.
Deal economics
- At list price, monthly cash flow is $1k ($16k/yr) — positive.
- The deal already cash-flows at list — no discount required.
- Meets the 1% rule at list price ($6k rent vs $450k).
- Cap rate 11.0% vs local median 5.6% in Wildwood — top-decile yield for the area; either an underpriced asset or a hidden risk that comps aren't pricing in. Stress-test before assuming the spread holds.
Location & tenants
- Location reads 74/100 on livability (#176 in NJ, #4,679 nationally) — a middle-class / working-renter tenant base. Strengths: amenities A+, commute A+, health & safety A+; Watch: employment D, schools F, crime F.
- Wildwood City School District (suburban): math 12% / reading 27% proficiency, ranked #442 of 472 in NJ (top 94%) — low school quality limits family demand, transient renter base, plan for 1-2y turnover; 80% free/reduced lunch — lower-income household profile, screen leases tightly.
- Market conditions: 431 active listings in the ZIP; 4 comparable units currently listed for rent nearby; rentals lingering (median 44d on market — plan ~5-8 weeks vacancy on turnover, expect pricing pressure); 100% of comp listings sitting > 30 days — soft ceiling on asking rent; 877 units permitted in Cape May County in 2024 (35 in 5+ unit buildings).
Forward outlook
- Local home prices are declining (-3.0%/yr); year-one equity from $3k of loan paydown is wiped out by about $13k of value loss. Plan a longer hold.
- Cape May County population projected at -24% by 2050 — secular population decline; favor cash flow + early exit over multi-decade hold.
- At projected returns (-3.0% appreciation + 3.0% rent growth), your $126k cash investment doubles in ~9 years — after that, you're playing with house money.
Negotiation context
- Only 4 days on market — expect competitive offers; lowballing is unlikely to land.
Risks & watch-outs
- Watch-outs: flood insurance adds $427/mo; built in 1929 — expect roof / HVAC / electrical / plumbing capex.
- Climate carrying-cost: in FEMA flood zone AE (mandatory federal flood insurance); severe wind risk, 80% chance of damaging wind over 30y; extreme-heat days projected 7→19/yr by 2055 (HVAC capex compounding) — expect insurance premiums to compound above CPI over the hold.
Questions for the listing agent
- Built in 1929 — when were the roof, HVAC, electrical panel, plumbing, and water heater last replaced?
- What's the actual annual flood-insurance premium (NFIP or private), and is the property in a SFHA with mandatory coverage?
- Is there a deadline driving the sale (1031 exchange, divorce, estate, relocation)? That informs how much negotiation room exists.
- Schools are F-rated, which usually means shorter tenancies and higher turnover. Who's the typical renter profile here, and what's been the actual vacancy rate?
- Crime grade is F in this area — have there been break-ins, vandalism, or insurance claims at this property in the last 3 years? What carrier currently insures it and at what premium?
- What's the average days-on-market for RENTAL listings here right now (not sales)? A rising rental-DOM trend means longer vacancies and softer asking-rent achievability than the comps imply.
- What's the recent tenant-quality profile in this submarket — average credit score on applications, eviction rate, late-payment / NSF rate, and stable-employment percentage? A property-management company in the area should have these aggregated.
- How much new for-sale + rental construction is in the pipeline within 1–3 miles? Heavy new supply typically softens prices + rents 12–24 months out; constrained supply supports both.
Investment metrics
- 1% rule
- 1.32% ✓
- Cap rate
- 11.04%
- Cash-on-cash
- 16.94%
- DSCR
- 1.75
- GRM
- 6.3
CMA / ARV
- ARV (on-the-fly)
- $657,030
- Comps found
- 10
Show comp detail 10 sales within ~0.75 mi
| Address | Dist | Beds/Ba | Sqft | Sold | Price | $/sf | Match |
|---|---|---|---|---|---|---|---|
| 122 W Magnolia Ave | 0.13mi | 3/2.0 | 1,281 (+6%) | 12mo | $503,000 | $393 | 70 |
| 504 W Oak Ave | 0.47mi | 3/2.0 | 1,158 (-4%) | 1mo | $700,000 | $604 | 66 |
| 117 E Spicer Ave | 0.55mi | 4/1.5 (+1) | 1,229 (+2%) | 2mo | $452,500 | $368 | 63 |
| 114 W 21st Ave | 0.28mi | 2/2.0 (-1) | 1,260 (+4%) | 14mo | $735,000 | $583 | 59 |
| 115 W 14th Ave | 0.65mi | 3/1.0 | 1,113 (-8%) | 3mo | $585,000 | $526 | 54 |
| 516 W Oak Ave | 0.48mi | 3/2.0 | 1,248 (+3%) | 18mo | $855,000 | $685 | 54 |
| 1605 Atlantic Ave | 0.63mi | 3/2.0 | 1,258 (+4%) | 20mo | $770,000 | $612 | 44 |
| 331 W 16th Ave | 0.56mi | 4/1.0 (+1) | 1,160 (-4%) | 24mo | $630,000 | $543 | 42 |
| 440 W Youngs Ave | 0.68mi | 3/2.0 | 1,154 (-5%) | 18mo | $505,000 | $438 | 41 |
| 427 1/2 W Roberts Ave | 0.71mi | 2/1.0 (-1) | 1,044 (-14%) | 14mo | $375,000 | $359 | 27 |
Match score weights: distance 35% · size 25% · config 20% · recency 20%. Top-matched comps best support the ARV.
Projected returns pro-forma
-3.0% appreciation · 3.0% rent growth · sell at horizon
- IRR
- 2.8%
- Equity multiple
- 1.11×
- Total profit
- $13,460
- Equity at exit
- $67,082
- IRR
- 12.4%
- Equity multiple
- 1.98×
- Total profit
- $123,593
- Equity at exit
- $38,899
Cash invested: $125,972 (down + closing). Projections, not guarantees.
Landlord ↔ Tenant lean methodology
- Overall (STATE)
- 21 Tenant-Leaning
- State New Jersey
- 21 Tenant-Leaning · D+6
- County
- — inherits STATE
- City
- — inherits STATE
ZIP-level market 08260
- Home prices YoY
- -30.7%
- Active inventory
- 431
- Price-to-rent
- 6.3×
Monthly cashflow live
- Estimated rent
- $5,957 medium interval (Pro) →
- Mortgage (P&I)
- −$2,359
- Tax from tax record
- −$380 /mo · $4,564/yr
- Insurance
- −$187
- Flood insurance flood zone
- −$427 /mo · $5,118/yr
- HOA
- −$0
- Vacancy / Maint / Mgmt
- −$1,251
- Net cashflow
- $1,352
Break-even live
UW: 25.0% down · 7.5% · 30yr · 1.5% tax · 5.0% vac · 8.0% maint · 8.0% mgmt
Financing live
Cash to close
- Down payment
- $112,475
- Closing costs
- $13,497
- Reserves months
- —
- Total cash needed
- —
Loan-product check · same deal, 3 products live
Conventional
25% down · 7.5% · 30yr
- Down + closing
- —
- Monthly P&I
- —
- Monthly cashflow
- —
- DSCR
- —
- Eligible?
- —
Personal DTI + credit; lowest rate.
DSCR
20% down · 8.5% · 30yr
- Down + closing
- —
- Monthly P&I
- —
- Monthly cashflow
- —
- DSCR
- —
- Eligible?
- —
No personal income docs; deal must DSCR.
Hard money
10% down · 12.0% · 12mo
- Down + closing
- —
- Monthly P&I
- —
- Monthly cashflow
- —
- DSCR
- —
- Eligible?
- —
Short-term bridge; refi at stabilization.
Rent comps 4 comps
| Address | Beds | Baths | Sqft | Rent | $/sqft | DOM | Units | Dist |
|---|---|---|---|---|---|---|---|---|
| 154 E Lincoln Ave #104 Wildwood, NJ | 3.0 | 2.5 | 1500 | $4,750 | $3.17 | 43d | 1 | 0.52mi |
| 206 W Spencer Ave Wildwood, NJ | 2.0 | 1.0 | 750 | $2,000 | $2.67 | 44d | 1 | 0.63mi |
| 142 E Youngs Ave Unit 1309014P Wildwood, NJ | 3.0 | 1.5 | 1194 | $5,873 | $4.92 | 43d | 1 | 0.72mi |
| 611 W Burk Ave Unit A Wildwood, NJ | 2.0 | 1.5 | 1248 | $12,000 | $9.62 | 43d | 1 | 0.99mi |
Listing history 2 events
-
2026-05-27$449,900 Active
-
2026-05-13status Under Contract
ⓘ Source: listings_history table (triggers on properties + properties_extension) + one-shot
backfill from property_details.listing_events for pre-trigger history.
Tax reassessment forecast NJ · Partial reset (capped growth)
- Current annual tax
- $4,564 · $380/mo
- Projected year-2 tax
- $7,883 · $657/mo
- Expected delta
- +$3,319/yr (+$277/mo · 72.7%)
ⓘ Screening estimate from a state-policy table — verify with the county assessor before closing.
Climate risk First Street
- Flood 10/10 Extreme FEMA zone AE · 99% chance over 30 yrs
- Wildfire 1/10 Low
- Heat 8/10 Severe 7 d/yr ≥95°F today · 19 d/yr by 30 yrs out
- Wind 8/10 Severe 80% chance of damaging wind over 30 yrs
- Air quality 2/10 Low 1 unhealthy d/yr today · 1 by 30 yrs out
Nearby sold comps map
Loading sold comps map…
Walkable amenities ~0.75 mi
Loading nearby amenities…
Taxation est. · year 1
- Rental income
- $71,482
- − Mortgage interest
- −$25,201
- − Property taxes
- −$4,564
- − Insurance
- −$7,368
- − Repairs & maintenance
- −$5,719
- − Management
- −$5,719
- − Depreciation
- −$13,088
- Taxable income
- $9,823
- Est. tax owed @ 24.0%
- −$2,358
- After-tax cash flow
- $13,869/yr
For passive investors: Depreciation is non-cash, so a rental often shows a tax loss while cash-flowing — sheltering income. Rental losses are passive: they offset passive income freely, and up to $25,000/yr can offset ordinary (W-2) income if you actively participate and your MAGI is under $100k (phasing out to $0 by $150k); unused losses carry forward. On sale, claimed depreciation is recaptured at up to 25%, and gains may owe capital-gains tax (a 1031 exchange can defer both). Figures are a year-1 estimate at your 24.0% rate — not tax advice; consult a CPA.
Schools (NCES district)
- District
- Wildwood City School District
- NCES district ID
- 3417940
- Math proficiency
- 12% ▼ -6.00%
- Reading proficiency
- 27% ▲ 5.00%
- Median HH income
- $33,232
- Composite
- 15.84/100
- National rank
- #9261
- State rank
- #442 of 472 in NJ
Livability — Wildwood
- Score
- 74/100
- State rank
- #176
- US rank
- #4679
Category grades
Schools grade is shown separately in the Schools card above.
Census & demographics
- Census place
- Wildwood, NJ
- Population (ZIP)
- 12,913
Population outlook (Cape May County) Hauer SSP2
- Today (2025)
- 88,234 people
- By 2030
- 84,144 · -4.6%
- By 2040
- 75,146 · -14.8%
- By 2050
- 67,389 · -23.6%
- By 2075
- 55,732 · -36.8%
- By 2100
- 44,972 · -49.0%
Race, ethnicity, and origin ACS 2023
- Neighborhood character
- Predominantly White (78%)
- Race & ethnicity
- White 78% Hispanic / Latino 14% Two or more races 7% Black 3% Native American 1%
- Hispanic origin (detail)
- Mexican 10% Puerto Rican 3%
- Common ancestry
- Romanian 7% Slovak 2% Lithuanian 1%
- Foreign-born
- 9% · Canada
- Languages at home
- 84% English-only · Spanish 12% Other Indo-European 3% French/Haitian/Cajun 1%
Political lean MEDSL · Cape May
- 2024 margin
- R (+19.2) · D 39.7% · R 58.9% · Other 1.4%
- 2008→2024 swing
- -10.6pp toward R · 2008: -8.7pp · 2024: -19.2pp
- All cycles
- 2024: R+19.2 2020: R+15.9 2016: R+19.9 2012: R+8.9 2008: R+8.7
Not yet ingested
- Civics
- —
Market trends
- HPI YoY
- ▼ -243.83%
- Current HPI
- 551.3393
- Rent YoY
- —
- Metro
- —
- State GDP YoY
- ▲ 2.05%
- F500 in state
- 34
Industry mix (Fortune 500 HQ in NJ)
| Industry | F500 HQs | Revenue |
|---|---|---|
| Consumer Goods | 3 | $31B |
|
||
| Pharmaceuticals | 2 | $153B |
|
||
| Technology | 2 | $21B |
|
||
| Insurance | 2 | $20B |
|
||
| Healthcare | 2 | $19B |
|
||
| Financial Services | 1 | $70B |
|
||
Price history
2 events — show timeline
- 2026-05-27 Listed $449,900 CMCMLS
- 2026-05-13 Pending — CMCMLS
Property tax history
+2.9%/yrLatest (2025): $4,564 · +2.8% YoY. Source: county tax records.
Cash-flow waterfall
monthlySold comps — $/sqft
last 12 mo · ≤1 miLoading sold comps…