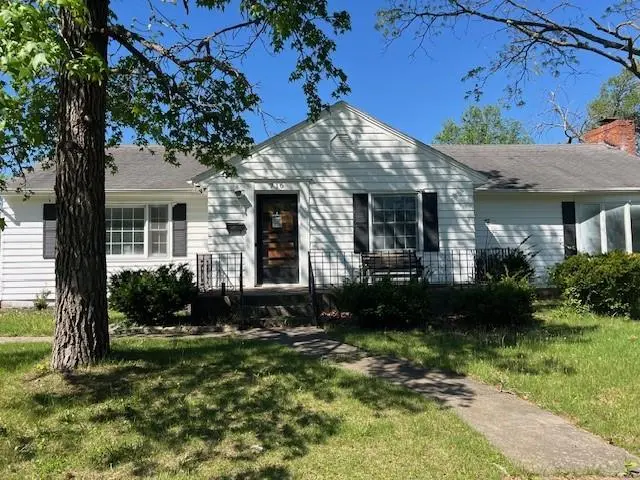
710 Bridge St · Sweet Springs, MO
Flood risk 1/10 · Minimal
- FEMA flood zone
- X (unshaded)
- Chance of flooding over 30 yrs
- 0.0%
- Est. flood insurance / yr
- $507 – $1,088
Fire risk 1/10 · Minimal
- Est. fire insurance / yr
- $1,054 – $1,958
Heat risk 4/10 · Minor
- Hot days now (above 108°F)
- 7 days/yr
- Hot days in 30 yrs
- 17 days/yr
Wind risk 2/10 · Minimal
- Chance of severe wind over 30 yrs
- —
Air-quality risk 2/10 · Minimal
- Unhealthy air days now
- 0 days/yr
- Unhealthy air days in 30 yrs
- 1 days/yr
Risk factors via First Street. Map © Google.
Why this score? — see what drove the C- grade
The composite is a weighted blend of 9 inputs, each scored 0–100. Each bar is that input's sub-score; the figure is the points it added to the 100-point composite (weight × sub-score).
- ARV discount +15.0/15.0
- Cash flow +13.4/30.0
- Appreciation +7.0/10.0
- DSCR +4.0/10.0
- Schools +3.5/10.0
- 1% rule +3.2/10.0
- Livability +3.2/5.0
- Rent growth +2.5/5.0
- Condition / age +2.5/5.0
$167,000
🖨 Deal sheet 📄 Offer letter ✓ Due diligence
Listing remarks
This ranch-style home offers solid bones and comfortable single-level living. 3 bedrooms with 2 baths all on the main level. Bonuus room could be used as additional bedroom or office. Large living area for any size gatherings. Enjoy the covered area in the back. Detached 2 car garage. Additional living space in the partially finished basement with an additional bath. This is a Fannie Mae homepath home.
Key facts
- Large living area
- Single level living
- Ranch style home
Tags
Property features AI
Finance
- Financial info: Annual tax amount reported
Exterior
- Parking: Detached garage that faces front; 2-car garage
- Utilities: Public water; Public sewer
- Home design: Single-family residence; Residential property; Ranch-style; Two-tone finished area with above-grade and below-grade living space
- Construction: Frame construction; Composition roof; Built approximately 51–75 years ago
- Exterior features: Located inside city limits; Lot approximately 18,794 square feet
Interior
- Bedrooms: 4 bedrooms
- Bathrooms: 3 full bathrooms
- Heating & cooling: Natural gas heating; Electric cooling (central air)
- Interior features: Ranch floor plan; Full finished basement; One fireplace
Neighborhood map
What this means for you Summary
Snapshot
- This is a 4-bed/3.0-bath other listed at $167k.
Deal economics
- At list price, monthly cash flow is $2 ($22/yr) — positive.
- The deal already cash-flows at list — no discount required.
- To meet the 1% rule (rent ≥ 1% of price), the offer needs to be $138k (17.6% below list).
- Recommended offer: $138k (17.6% below list) — sets the bar for 1% rule.
Location & tenants
- Location reads 64/100 on livability (#302 in MO) — a middle-class / working-renter tenant base. Strengths: cost of living A+, housing A+; Watch: employment D+, amenities F, commute F.
- Sweet Springs R-VII (rural): math 37% / reading 45% proficiency, ranked #135 of 324 in MO (top 42%) — families likely to look elsewhere, expect single-tenant / working-renter base with shorter leases.
- Market conditions: 16 active listings in the ZIP; 11 units permitted in Saline County in 2024 (0 in 5+ unit buildings).
Forward outlook
- In year one you build about $8k of equity ($1k loan paydown + $7k appreciation (4.0% local appreciation)).
- Saline County population projected to shrink 7% by 2050 — rents likely to lag national; underwrite the cash flow, not the appreciation.
- At projected returns (4.0% appreciation + 3.0% rent growth), your $47k cash investment doubles in ~5 years — after that, you're playing with house money.
- By year 5, paydown + projected appreciation supports a ~$34k cash-out refi (75% LTV) — recoverable capital for the next deal without selling this one.
Negotiation context
- It's been on market 37 days — a 3% lower offer ($162k) is reasonable based on typical stale-listing flexibility.
Questions for the listing agent
- It's been on market 37 days. Have you received any prior offers? Is the seller open to a 18% concession, seller financing, or rate buy-down credit?
- Built in 1965 — when were the roof, HVAC, electrical panel, plumbing, and water heater last replaced?
- Is there a deadline driving the sale (1031 exchange, divorce, estate, relocation)? That informs how much negotiation room exists.
- What's the average days-on-market for RENTAL listings here right now (not sales)? A rising rental-DOM trend means longer vacancies and softer asking-rent achievability than the comps imply.
- What's the recent tenant-quality profile in this submarket — average credit score on applications, eviction rate, late-payment / NSF rate, and stable-employment percentage? A property-management company in the area should have these aggregated.
- How much new for-sale + rental construction is in the pipeline within 1–3 miles? Heavy new supply typically softens prices + rents 12–24 months out; constrained supply supports both.
Investment metrics
- 1% rule
- 0.82% ✗
- Cap rate
- 6.31%
- Cash-on-cash
- 0.05%
- DSCR
- 1.00
- GRM
- 10.1
CMA / ARV
- ARV (median comp)
- $243,607
- List price
- $167,000
- Delta
- -31.45%
- Verdict
- UNDERPRICED
- Comps
- 11 within 1.0 mi
Projected returns pro-forma
4.04% appreciation · 3.0% rent growth · sell at horizon
- IRR
- 10.4%
- Equity multiple
- 1.63×
- Total profit
- $29,597
- Equity at exit
- $85,073
- IRR
- 12.2%
- Equity multiple
- 3.01×
- Total profit
- $94,106
- Equity at exit
- $139,464
Cash invested: $46,760 (down + closing). Projections, not guarantees.
Landlord ↔ Tenant lean methodology
- Overall (STATE)
- 81 Strongly Landlord-Friendly
- State Missouri
- 81 Strongly Landlord-Friendly · R+10
- County
- — inherits STATE
- City
- — inherits STATE
ZIP-level market 65351
- Home prices YoY
- 3.9%
- Active inventory
- 16
- Price-to-rent
- 10.1×
Monthly cashflow live
- Estimated rent
- $1,375 medium interval (Pro) →
- Mortgage (P&I)
- −$876
- Tax from tax record
- −$139 /mo · $1,671/yr
- Insurance
- −$70
- HOA
- −$0
- Vacancy / Maint / Mgmt
- −$289
- Net cashflow
- $2
Break-even live
UW: 25.0% down · 7.5% · 30yr · 1.5% tax · 5.0% vac · 8.0% maint · 8.0% mgmt
Financing live
Cash to close
- Down payment
- $41,750
- Closing costs
- $5,010
- Reserves months
- —
- Total cash needed
- —
Loan-product check · same deal, 3 products live
Conventional
25% down · 7.5% · 30yr
- Down + closing
- —
- Monthly P&I
- —
- Monthly cashflow
- —
- DSCR
- —
- Eligible?
- —
Personal DTI + credit; lowest rate.
DSCR
20% down · 8.5% · 30yr
- Down + closing
- —
- Monthly P&I
- —
- Monthly cashflow
- —
- DSCR
- —
- Eligible?
- —
No personal income docs; deal must DSCR.
Hard money
10% down · 12.0% · 12mo
- Down + closing
- —
- Monthly P&I
- —
- Monthly cashflow
- —
- DSCR
- —
- Eligible?
- —
Short-term bridge; refi at stabilization.
Listing history 18 events
-
2026-06-19days on market $167,000 Active 37 DOM
-
2026-06-18days on market $167,000 Active 36 DOM
-
2026-06-17days on market $167,000 Active 35 DOM
-
2026-06-16days on market $167,000 Active 34 DOM
-
2026-06-16price $167,000 Active 33 DOM
-
2026-06-15days on market $175,000 Active 33 DOM
-
2026-06-14days on market $175,000 Active 31 DOM
-
2026-06-12days on market $175,000 Active 30 DOM
-
2026-06-09days on market $175,000 Active 27 DOM
-
2026-06-08days on market $175,000 Active 26 DOM
-
2026-06-07days on market $175,000 Active 25 DOM
-
2026-06-05days on market $175,000 Active 22 DOM
-
2026-06-02days on market $175,000 Active 20 DOM
-
2026-06-01days on market $175,000 Active 19 DOM
-
2026-05-31days on market $175,000 Active 18 DOM
-
2026-05-30days on market $175,000 Active 17 DOM
-
2026-05-13$175,000 Active 405-char remark
-
2025-10-09soldstatus
ⓘ Source: listings_history table (triggers on properties + properties_extension) + one-shot
backfill from property_details.listing_events for pre-trigger history.
Tax reassessment forecast MO · Resets to sale price
- Current annual tax
- $1,671 · $139/mo
- Projected year-2 tax
- $1,671 · $139/mo
- Expected delta
- $0/yr ($0/mo · 0.0%)
ⓘ Screening estimate from a state-policy table — verify with the county assessor before closing.
Climate risk First Street
- Flood 1/10 Low FEMA zone X (unshaded) · 0% chance over 30 yrs
- Wildfire 1/10 Low
- Heat 4/10 Moderate 7 d/yr ≥108°F today · 17 d/yr by 30 yrs out
- Wind 2/10 Low
- Air quality 2/10 Low 0 unhealthy d/yr today · 1 by 30 yrs out
Nearby sold comps map
Loading sold comps map…
Walkable amenities ~0.75 mi
Loading nearby amenities…
Taxation est. · year 1
- Rental income
- $16,503
- − Mortgage interest
- −$9,355
- − Property taxes
- −$1,671
- − Insurance
- −$835
- − Repairs & maintenance
- −$1,320
- − Management
- −$1,320
- − Depreciation
- −$4,858
- Taxable loss
- −$2,856
- Est. tax savings @ 24.0%
- +$685
- After-tax cash flow
- $708/yr
For passive investors: Depreciation is non-cash, so a rental often shows a tax loss while cash-flowing — sheltering income. Rental losses are passive: they offset passive income freely, and up to $25,000/yr can offset ordinary (W-2) income if you actively participate and your MAGI is under $100k (phasing out to $0 by $150k); unused losses carry forward. On sale, claimed depreciation is recaptured at up to 25%, and gains may owe capital-gains tax (a 1031 exchange can defer both). Figures are a year-1 estimate at your 24.0% rate — not tax advice; consult a CPA.
Schools (NCES district)
- District
- Sweet Springs R-VII
- NCES district ID
- 2929880
- Math proficiency
- 37% ▼ -14.00%
- Reading proficiency
- 45% ▼ -9.00%
- Median HH income
- $42,522
- Composite
- 34.58/100
- National rank
- #5164
- State rank
- #135 of 324 in MO
Livability — Sweet Springs
- Score
- 64/100
- State rank
- #302
- US rank
- #13860
Category grades
Schools grade is shown separately in the Schools card above.
Census & demographics
- Census place
- Sweet Springs, MO
- Population (ZIP)
- 2,224
Population outlook (Saline County) Hauer SSP2
- Today (2025)
- 22,716 people
- By 2030
- 22,343 · -1.6%
- By 2040
- 21,596 · -4.9%
- By 2050
- 21,171 · -6.8%
- By 2075
- 20,680 · -9.0%
- By 2100
- 20,147 · -11.3%
Race, ethnicity, and origin ACS 2023
- Neighborhood character
- Predominantly White (91%)
- Race & ethnicity
- White 91% Two or more races 5% Hispanic / Latino 3% Asian 2%
- Common ancestry
- Romanian 4% Italian 2% Slovak 2%
- Foreign-born
- 1%
- Languages at home
- 97% English-only · Spanish 2% Other Asian/Pacific 1%
Political lean MEDSL · Saline
- 2024 margin
- Solid R (+40.4) · D 29.2% · R 69.7% · Other 1.1%
- 2008→2024 swing
- -37.9pp toward R · 2008: -2.5pp · 2024: -40.4pp
- All cycles
- 2024: R+40.4 2020: R+37.3 2016: R+34.5 2012: R+14.4 2008: R+2.5
Not yet ingested
- Civics
- —
Market trends
- HPI YoY
- ▲ 4.04%
- Current HPI
- 107.2676
- Rent YoY
- —
- Metro
- —
- State GDP YoY
- ▲ 1.84%
- F500 in state
- 20
Industry mix (Fortune 500 HQ in MO)
| Industry | F500 HQs | Revenue |
|---|---|---|
| Healthcare | 1 | $163B |
|
||
| Insurance | 1 | $21B |
|
||
| Industrial Technology | 1 | $17B |
|
||
| Retail | 1 | $16B |
|
||
| Industrial Distribution | 1 | $10B |
|
||
| Utilities | 1 | $9B |
|
||
Price history
-4.6% since first listed3 events — show timeline
- 2026-06-15 Price Changed $167,000 Heartland MLS as Distributed by MLS Grid
- 2026-05-13 Listed $175,000 Heartland MLS as Distributed by MLS Grid
- 2025-10-09 Sold (Public Records) — Public Records
Property tax history
+7.8%/yrLatest (2025): $1,671 · +10.3% YoY. Source: county tax records.
Cash-flow waterfall
monthlySold comps — $/sqft
last 12 mo · ≤1 miLoading sold comps…