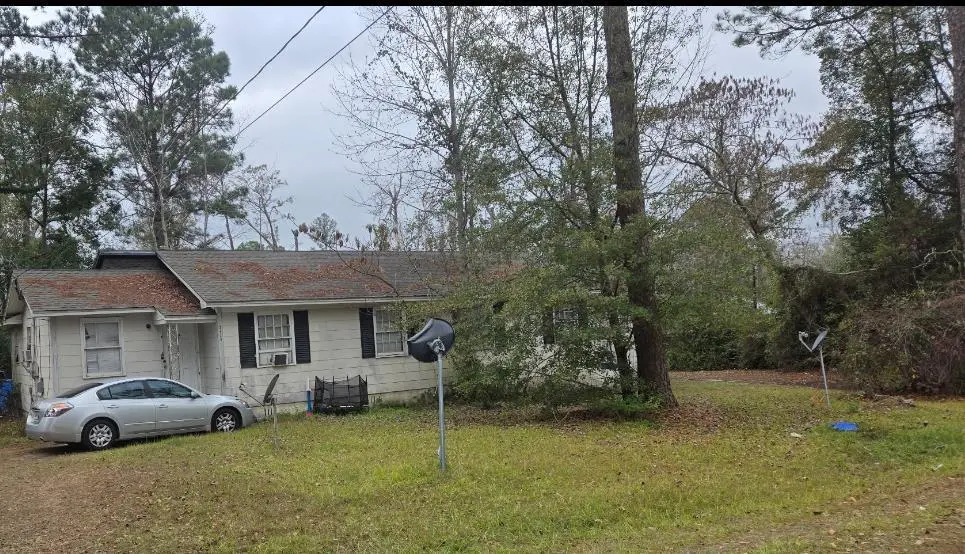
 Duplex
2426 University Dr · Valdosta, GA
Flood risk 1/10 · Minimal
- FEMA flood zone
- X (unshaded)
- Chance of flooding over 30 yrs
- 0.0%
- Est. flood insurance / yr
- $507 – $1,088
Fire risk 1/10 · Minimal
- Est. fire insurance / yr
- $963 – $1,789
Heat risk 8/10 · Major
- Hot days now (above 108°F)
- 7 days/yr
- Hot days in 30 yrs
- 19 days/yr
Wind risk 9/10 · Severe
- Chance of severe wind over 30 yrs
- 99.0%
Air-quality risk 6/10 · Moderate
- Unhealthy air days now
- 10 days/yr
- Unhealthy air days in 30 yrs
- 11 days/yr
Risk factors via First Street. Map © Google.
Why this score? — see what drove the B- grade
The composite is a weighted blend of 9 inputs, each scored 0–100. Each bar is that input's sub-score; the figure is the points it added to the 100-point composite (weight × sub-score).
- Cash flow +30.0/30.0
- DSCR +10.0/10.0
- 1% rule +8.6/10.0
- ARV discount +7.5/15.0
- Rent growth +4.6/5.0
- Livability +3.0/5.0
- Condition / age +2.5/5.0
- Schools +1.5/10.0
- Appreciation +0.0/10.0
$160,000
🖨 Deal sheet (PDF) 📄 Offer letter ✓ Due diligence
Multi-family units
County records classify this as Multi-Family (2-4 Unit). Listing-text estimate: 2 units. confirmed
Listing remarks MLS
Duplex for sale in Valdosta currently leased brings in $1850 per month.
Key facts
- 0.49 acre lot
- 4 parking spots
- Built 1978
Neighborhood map
What this means for you Summary
Snapshot
- This is a 2 × 3-bed/2-bath units multifamily listed at $160k.
Deal economics
- At list price, monthly cash flow is $719 ($9k/yr) — positive. Per door: $359/mo.
- The deal already cash-flows at list — no discount required.
- Meets the 1% rule at list price ($2k rent vs $160k).
- Recommended offer: $141k (12.0% below list) — sets the bar for market timing.
- Cap rate 11.7% vs local median 4.3% in Valdosta — top-decile yield for the area; either an underpriced asset or a hidden risk that comps aren't pricing in. Stress-test before assuming the spread holds.
Location & tenants
- Location reads 60/100 on livability (#392 in GA) — a middle-class / working-renter tenant base. Strengths: cost of living A+, health & safety A+, housing A-; Watch: schools F, crime F, amenities F.
- Valdosta City (urban): math 15% / reading 22% proficiency, ranked #149 of 174 in GA (top 86%) — low school quality limits family demand, transient renter base, plan for 1-2y turnover; 74% free/reduced lunch — lower-income household profile, screen leases tightly.
- Market conditions: Rents rising fast (+8.3%/yr); 201 active listings in the ZIP; 33 comparable units currently listed for rent nearby; rentals lingering (median 45d on market — plan ~5-8 weeks vacancy on turnover, expect pricing pressure); 61% of comp listings sitting > 30 days — soft ceiling on asking rent; lower-income renter base — watch delinquency; 896 units permitted in Lowndes County in 2024 (0 in 5+ unit buildings).
- At $2,177/mo this rent would consume 72% of the median local household income ($36k/yr) (locally 2016% of renters already pay >50% of income on rent) — very limited rent-growth headroom before tenants either downsize or default.
Forward outlook
- Local home prices are declining (-3.0%/yr); year-one equity from $1k of loan paydown is wiped out by about $5k of value loss. Plan a longer hold.
- Lowndes County population projected at +10% by 2050 — modest demand growth; plan on rents tracking national, not racing it.
- At projected returns (-3.0% appreciation + 8.0% rent growth), your $45k cash investment doubles in ~6 years — after that, you're playing with house money.
Negotiation context
- It's been on market 149 days — a 12% lower offer ($141k) is reasonable based on typical stale-listing flexibility.
- Current owner paid $120k; 33% above their basis — modest negotiation headroom, anchor on the comps not their cost.
Risks & watch-outs
- Climate carrying-cost: severe wind risk, 99% chance of damaging wind over 30y; extreme-heat days projected 7→19/yr by 2055 (HVAC capex compounding) — expect insurance premiums to compound above CPI over the hold.
Questions for the listing agent
- It's been on market 149 days. Have you received any prior offers? Is the seller open to a 12% concession, seller financing, or rate buy-down credit?
- Can we see the unit-by-unit rent roll, current vacancy, and any below-market leases? What's the average tenancy length?
- What capital expenditures (roof, boiler, parking lot, exteriors) have been made in the last 5 years, and what's planned in the next 2?
- Built in 1978 — when were the roof, HVAC, electrical panel, plumbing, and water heater last replaced?
- Why hasn't it sold? Are there any deal-killer items the seller is aware of (foundation, flood, title, zoning, code violations)?
- Is there a deadline driving the sale (1031 exchange, divorce, estate, relocation)? That informs how much negotiation room exists.
- Schools are F-rated, which usually means shorter tenancies and higher turnover. Who's the typical renter profile here, and what's been the actual vacancy rate?
- Crime grade is F in this area — have there been break-ins, vandalism, or insurance claims at this property in the last 3 years? What carrier currently insures it and at what premium?
- What's the average days-on-market for RENTAL listings here right now (not sales)? A rising rental-DOM trend means longer vacancies and softer asking-rent achievability than the comps imply.
- What's the recent tenant-quality profile in this submarket — average credit score on applications, eviction rate, late-payment / NSF rate, and stable-employment percentage? A property-management company in the area should have these aggregated.
- How much new apartment / multifamily construction is in the pipeline within 1–3 miles? Heavy new supply (>2% of stock underway) typically softens rents 12–24 months out; light construction supports rent growth.
Investment metrics
- 1% rule
- 1.36% ✓
- Cap rate
- 11.68%
- Cash-on-cash
- 19.26%
- DSCR
- 1.86
- GRM
- 6.1
CMA / ARV
- ARV (median comp)
- $101,828
- List price
- $160,000
- Delta
- 57.13%
- Verdict
- OVERPRICED
- Comps
- 3 within 1.0 mi
Show comp detail 1 sale within ~0.75 mi
| Address | Dist | Beds/Ba | Sqft | Sold | Price | $/sf | Match |
|---|---|---|---|---|---|---|---|
| 2437-39 University Dr #2 | 0.04mi | 6/2.0 | 1,758 (+2%) | 8mo | $228,000 | $130 | 88 |
Match score weights: distance 35% · size 25% · config 20% · recency 20%. Top-matched comps best support the ARV.
Projected returns pro-forma
-3.0% appreciation · 8.0% rent growth · sell at horizon
- IRR
- 16.4%
- Equity multiple
- 1.70×
- Total profit
- $31,334
- Equity at exit
- $23,857
- IRR
- 28.2%
- Equity multiple
- 4.09×
- Total profit
- $138,480
- Equity at exit
- $13,834
Cash invested: $44,800 (down + closing). Projections, not guarantees.
Landlord ↔ Tenant lean methodology
- Overall (STATE)
- 90 Strongly Landlord-Friendly
- State Georgia
- 90 Strongly Landlord-Friendly · R+3
- County
- — inherits STATE
- City
- — inherits STATE
ZIP-level market 31601
- Home prices YoY
- -31.2%
- Rents YoY
- 8.3%
- Active inventory
- 201
- Price-to-rent
- 12.2×
Monthly cashflow live
- Estimated rent
- $2,177 high interval (Pro) →
- Mortgage (P&I)
- −$839
- Tax from tax record
- −$95 /mo · $1,142/yr
- Insurance
- −$67
- HOA
- −$0
- Vacancy / Maint / Mgmt
- −$457
- Net cashflow
- $719
Break-even live
Sensitivity live
| Price | -10% $809 | -5% $764 | +0% $719 | +5% $674 | +10% $628 |
|---|---|---|---|---|---|
| Rent | -10% $547 | -5% $633 | +0% $719 | +5% $805 | +10% $891 |
| Rate | -1.0pp $799 | -0.5pp $760 | base $719 | +0.5pp $677 | +1.0pp $635 |
2-unit breakdown (identical units grouped — click to expand)
| Units | Beds | Baths | Est. rent |
|---|---|---|---|
| 2× units | 3 | 2 | $2,176 |
| #1 | 3 | 2 | $1,088 |
| #2 | 3 | 2 | $1,088 |
| Total (2 units) | $2,177 | ||
UW: 25.0% down · 7.5% · 30yr · 1.5% tax · 5.0% vac · 8.0% maint · 8.0% mgmt
Financing live
Cash to close
- Down payment
- $40,000
- Closing costs
- $4,800
- Reserves months
- —
- Total cash needed
- —
Loan-product check · same deal, 3 products live
Conventional
25% down · 7.5% · 30yr
- Down + closing
- —
- Monthly P&I
- —
- Monthly cashflow
- —
- DSCR
- —
- Eligible?
- —
Personal DTI + credit; lowest rate.
DSCR
20% down · 8.5% · 30yr
- Down + closing
- —
- Monthly P&I
- —
- Monthly cashflow
- —
- DSCR
- —
- Eligible?
- —
No personal income docs; deal must DSCR.
Hard money
10% down · 12.0% · 12mo
- Down + closing
- —
- Monthly P&I
- —
- Monthly cashflow
- —
- DSCR
- —
- Eligible?
- —
Short-term bridge; refi at stabilization.
Rent comps 33 comps
| Address | Beds | Baths | Sqft | Rent | $/sqft | DOM | Units | Dist |
|---|---|---|---|---|---|---|---|---|
| 611 Pineview Dr Valdosta, GA | 1.0–3.0 | 1.0–2.5 | 1204 | $1,300 | $1.08 | 22d | 3 | 0.38mi |
| 420 Connell Rd Valdosta, GA | 1.0–3.0 | 1.0–2.0 | 1051 | $1,195 | $1.14 | 22d | 8 | 0.50mi |
| 100 Garden Dr Valdosta, GA | 1.0–3.0 | 1.0–3.0 | 885 | $1,702 | $1.92 | 22d | 13 | 0.50mi |
| 422 Connell Rd Valdosta, GA | 2.0 | 3.0 | 1125 | $1,050 | $0.93 | 22d | 1 | 0.56mi |
| 413 Georgetown Cir Valdosta, GA | 2.0 | 2.0 | 1178 | $1,400 | $1.19 | 45d | 1 | 0.63mi |
| 312 Eager Rd Valdosta, GA | 3.0 | 3.0 | 1959 | $1,895 | $0.97 | 45d | 1 | 0.67mi |
| 334 Sawgrass Dr Valdosta, GA | 3.0 | 2.0 | 1150 | $1,595 | $1.39 | 22d | 1 | 0.70mi |
| 360 Brookfield Rd Valdosta, GA | 3.0 | 2.5 | 1278 | $1,100 | $0.86 | 45d | 1 | 0.71mi |
| 2878 Fawnwood Cir Valdosta, GA | 3.0 | 2.0 | 1400 | $3,000 | $2.14 | 45d | 1 | 0.72mi |
| 2859 Fawnwood Cir Valdosta, GA | 2.0 | 2.0 | 1173 | $1,400 | $1.19 | 22d | 1 | 0.72mi |
| 141 Blue Pool Dr Valdosta, GA | 3.0 | 2.0 | 1109 | $1,200 | $1.08 | 22d | 1 | 0.73mi |
| 5 Kensington Cir Valdosta, GA | 3.0 | 2.0 | 1150 | $1,495 | $1.30 | 22d | 1 | 0.79mi |
| 3024 Will Dr Valdosta, GA | 3.0 | 2.0 | 1200 | $1,295 | $1.08 | 45d | 1 | 0.80mi |
| 302 Hartsfield Ln Valdosta, GA | 3.0 | 2.0 | 1975 | $1,775 | $0.90 | 45d | 1 | 0.82mi |
| 3027 Schroer Dr Valdosta, GA | 3.0 | 2.0 | 1184 | $1,295 | $1.09 | 45d | 1 | 0.85mi |
| 908 E Park Ave Valdosta, GA | 3.0 | 2.0 | 1612 | $1,650 | $1.02 | 22d | 1 | 0.91mi |
| 2324 Sterling Pl Valdosta, GA | 3.0 | 1.0 | 1124 | $1,095 | $0.97 | 22d | 1 | 0.92mi |
| 210 W Cranford Ave Valdosta, GA | 3.0 | 3.0 | 2000 | $1,650 | $0.82 | 22d | 1 | 0.93mi |
| 210 W Cranford Ave Valdosta, GA | 3.0 | 3.0 | 2000 | $1,650 | $0.82 | 45d | 1 | 0.93mi |
| 1109 Timber Line Dr Valdosta, GA | 3.0 | 2.0 | 1436 | $1,300 | $0.91 | 45d | 1 | 0.94mi |
| 407 Northfield Rd Valdosta, GA | 3.0 | 2.0 | 1505 | $1,395 | $0.93 | 22d | 1 | 0.98mi |
| 2600 Deborah Dr Valdosta, GA | 3.0 | 1.0 | 1333 | $1,495 | $1.12 | 45d | 1 | 1.00mi |
| 1704 N Patterson St Unit 4 Valdosta, GA | 2.0 | 2.0 | 1100 | $950 | $0.86 | 45d | 1 | 1.01mi |
| 2502 Berkley Dr Valdosta, GA | 3.0 | 2.0 | 1484 | $1,650 | $1.11 | 22d | 1 | 1.13mi |
| 1503 E Park Ave Valdosta, GA | 1.0–3.0 | 1.0–2.0 | 890 | $1,044 | $1.17 | 45d | 54 | 1.19mi |
| 1903 Azalea Dr Valdosta, GA | 3.0 | 2.0 | 2128 | $2,500 | $1.17 | 45d | 1 | 1.25mi |
| 1632 Lexington Cir Valdosta, GA | 3.0 | 2.0 | 1104 | $1,395 | $1.26 | 45d | 1 | 1.27mi |
| 3000 Ginny Dr Valdosta, GA | 3.0 | 2.0 | 1174 | $1,200 | $1.02 | 45d | 1 | 1.27mi |
| 3261 Jordan Way Valdosta, GA | 3.0 | 2.0 | 1985 | $2,100 | $1.06 | 45d | 1 | 1.28mi |
| 702 Pineridge Dr Valdosta, GA | 3.0 | 2.0 | 1736 | $1,650 | $0.95 | 45d | 1 | 1.31mi |
| 1717 Largo Cir Valdosta, GA | 3.0 | 2.0 | 1206 | $1,495 | $1.24 | 45d | 1 | 1.36mi |
| 2219 White Oak Dr Valdosta, GA | 2.0 | 1.0 | 1100 | $2,250 | $2.05 | 45d | 1 | 1.43mi |
| 2208 White Oak Dr Valdosta, GA | 3.0 | 2.5 | 2194 | $1,975 | $0.90 | 45d | 1 | 1.48mi |
Listing history 8 events
-
2026-06-05days on market $160,000 Active 149 DOM
-
2026-06-03days on market $160,000 Active 148 DOM
-
2026-06-02days on market $160,000 Active 147 DOM
-
2026-06-01days on market $160,000 Active 146 DOM
-
2026-05-31days on market $160,000 Active 145 DOM
-
2026-05-30days on market $160,000 Active 144 DOM
-
2026-01-06$160,000 Active 71-char remark
Show marketing remark (71 chars)
Duplex for sale in Valdosta currently leased brings in $1850 per month.
-
2017-12-22soldstatus $120,000
ⓘ Source: listings_history table (triggers on properties + properties_extension) + one-shot
backfill from property_details.listing_events for pre-trigger history.
Tax reassessment forecast GA · Resets to sale price
- Current annual tax
- $1,142 · $95/mo
- Projected year-2 tax
- $1,472 · $123/mo
- Expected delta
- +$330/yr (+$27/mo · 28.9%)
ⓘ Screening estimate from a state-policy table — verify with the county assessor before closing.
Climate risk First Street
- Flood 1/10 Low FEMA zone X (unshaded) · 0% chance over 30 yrs
- Wildfire 1/10 Low
- Heat 8/10 Severe 7 d/yr ≥108°F today · 19 d/yr by 30 yrs out
- Wind 9/10 Extreme 99% chance of damaging wind over 30 yrs
- Air quality 6/10 Major 10 unhealthy d/yr today · 11 by 30 yrs out
Nearby sold comps map
Loading sold comps map…
Walkable amenities ~0.75 mi
Loading nearby amenities…
Taxation est. · year 1
- Rental income
- $26,124
- − Mortgage interest
- −$8,962
- − Property taxes
- −$1,142
- − Insurance
- −$800
- − Repairs & maintenance
- −$2,090
- − Management
- −$2,090
- − Depreciation
- −$4,655
- Taxable income
- $6,385
- Est. tax owed @ 24.0%
- −$1,532
- After-tax cash flow
- $7,095/yr
For passive investors: Depreciation is non-cash, so a rental often shows a tax loss while cash-flowing — sheltering income. Rental losses are passive: they offset passive income freely, and up to $25,000/yr can offset ordinary (W-2) income if you actively participate and your MAGI is under $100k (phasing out to $0 by $150k); unused losses carry forward. On sale, claimed depreciation is recaptured at up to 25%, and gains may owe capital-gains tax (a 1031 exchange can defer both). Figures are a year-1 estimate at your 24.0% rate — not tax advice; consult a CPA.
Schools (NCES district)
- District
- Valdosta City
- NCES district ID
- 1305310
- Math proficiency
- 15% ▼ -12.00%
- Reading proficiency
- 22% ▼ -7.00%
- Median HH income
- $30,634
- Composite
- 14.79/100
- National rank
- #9388
- State rank
- #149 of 174 in GA
Livability — Valdosta
- Score
- 60/100
- State rank
- #392
- US rank
- #19544
Category grades
Schools grade is shown separately in the Schools card above.
Census & demographics
- Census place
- Valdosta, GA
- County
- Lowndes County · 107,801 people
- City population
- 91,859
- Metro
- Valdosta, GA
- Population (ZIP)
- 31,302
- Household income
- $36,111
- Rent vs Own
- Severe rent burden
- 2016.0
Population outlook (Lowndes County) Hauer SSP2
- Today (2025)
- 120,348 people
- By 2030
- 123,469 · +2.6%
- By 2040
- 128,482 · +6.8%
- By 2050
- 131,907 · +9.6%
- By 2075
- 139,080 · +15.6%
- By 2100
- 133,649 · +11.1%
Race, ethnicity, and origin ACS 2023
- Neighborhood character
- Diverse neighborhood (Simpson 0.57)
- Race & ethnicity
- Black 57% White 31% Hispanic / Latino 8% Two or more races 4% Asian 1%
- Hispanic origin (detail)
- Mexican 4%
- Common ancestry
- Slovak 1% Italian 1%
- Foreign-born
- 4% · Canada, South Korea
- Languages at home
- 92% English-only · Spanish 7% Korean 1%
Political lean MEDSL · Lowndes
- 2024 margin
- R (+18.0) · D 40.8% · R 58.8%
- 2008→2024 swing
- -8.6pp toward R · 2008: -9.4pp · 2024: -18.0pp
- All cycles
- 2024: R+18.0 2020: R+12.0 2016: R+18.2 2012: R+10.5 2008: R+9.4
Not yet ingested
- Civics
- —
Market trends
- HPI YoY
- ▼ -55.12%
- Current HPI
- 121.5948
- Rent YoY
- ▲ 8.34%
- Metro
- Valdosta, GA
- State GDP YoY
- ▲ 2.66%
- F500 in state
- 28
Industry mix (Fortune 500 HQ in GA)
| Industry | F500 HQs | Revenue |
|---|---|---|
| Paper / Packaging | 2 | $29B |
|
||
| Retail | 1 | $160B |
|
||
| Transportation / Logistics | 1 | $91B |
|
||
| Airlines | 1 | $62B |
|
||
| Consumer Goods | 1 | $47B |
|
||
| Utilities | 1 | $25B |
|
||
Price history
+33.3% since first listed2 events — show timeline
- 2026-01-06 Listed $160,000 TBOR
- 2017-12-22 Sold (Public Records) $120,000 Public Records
Property tax history
+6.8%/yrLatest (2025): $1,142 · +12.6% YoY. Source: county tax records.
Cash-flow waterfall
monthlySold comps — $/sqft
last 12 mo · ≤1 miLoading sold comps…