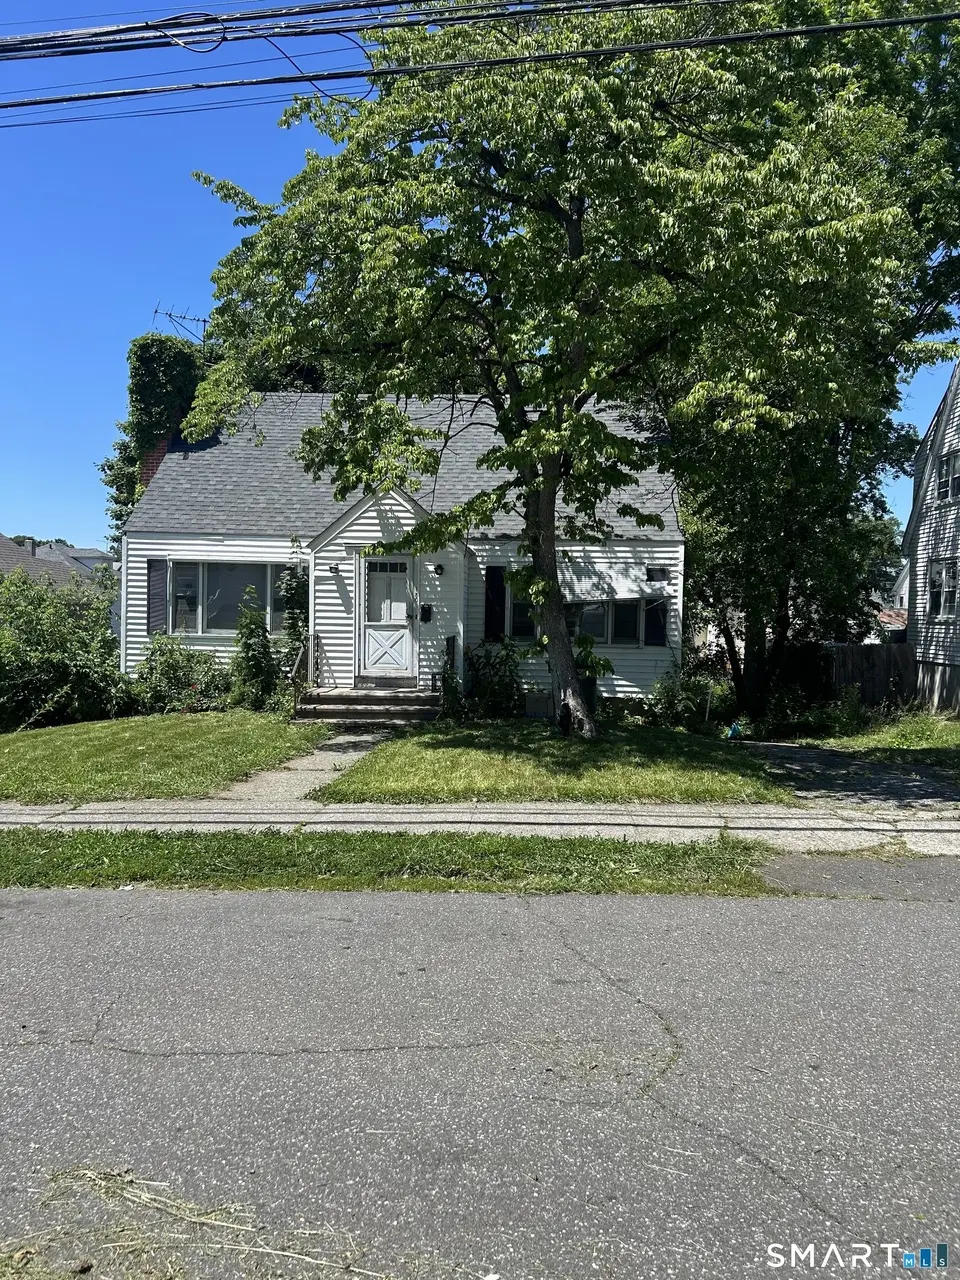
150 Norland Ave · Bridgeport, CT
Flood risk 1/10 · Minimal
- FEMA flood zone
- X (unshaded)
- Chance of flooding over 30 yrs
- 0.0%
- Est. flood insurance / yr
- $473 – $860
Fire risk 1/10 · Minimal
- Est. fire insurance / yr
- $829 – $1,539
Heat risk 6/10 · Moderate
- Hot days now (above 97°F)
- 7 days/yr
- Hot days in 30 yrs
- 15 days/yr
Wind risk 6/10 · Moderate
- Chance of severe wind over 30 yrs
- 41.0%
Air-quality risk 4/10 · Minor
- Unhealthy air days now
- 5 days/yr
- Unhealthy air days in 30 yrs
- 7 days/yr
Risk factors via First Street. Map © Google.
Why this score? — see what drove the B- grade
The composite is a weighted blend of 9 inputs, each scored 0–100. Each bar is that input's sub-score; the figure is the points it added to the 100-point composite (weight × sub-score).
- Cash flow +25.6/30.0
- ARV discount +15.0/15.0
- DSCR +8.5/10.0
- 1% rule +8.0/10.0
- Livability +4.0/5.0
- Rent growth +3.3/5.0
- Condition / age +2.5/5.0
- Schools +1.2/10.0
- Appreciation +0.0/10.0
$259,900
🖨 Deal sheet (PDF) 📄 Offer letter ✓ Due diligence
Listing remarks
Handyman/Contractor Special - Roof is 3 years old. Home is subject to probate court approval. Being Sold As Is. Water is turned off. Buyers must do their own due diligence with appropriate inspections.
Key facts
- 4,791 sq ft lot
- Garage
- Built 1951
Property features AI
Exterior
- Parking: Under-house garage (1 car)
- Utilities: Public water connected; Public sewer connected
- Home design: Single-family home
- Construction: Frame construction; Vinyl siding; White exterior color; Concrete and masonry foundation; Asphalt shingle roof
- Exterior features: Level to sloping lot; Beach rights
Interior
- Bedrooms: Three bedrooms
- Bathrooms: One full bathroom; One half bathroom
- Heating & cooling: Hot water heating; Natural gas fuel; 40-gallon hot water tank
- Interior features: Six total rooms; Partial basement with garage access; One fireplace
- Laundry & utility: Laundry located on lower level
Neighborhood map
What this means for you Summary
Snapshot
- This is a 3-bed/1.5-bath single-family listed at $260k.
Deal economics
- At list price, monthly cash flow is $614 ($7k/yr) — positive.
- The deal already cash-flows at list — no discount required.
- Meets the 1% rule at list price ($3k rent vs $260k).
- Cap rate 9.1% vs local median 4.6% in Bridgeport — top-decile yield for the area; either an underpriced asset or a hidden risk that comps aren't pricing in. Stress-test before assuming the spread holds.
Location & tenants
- Location reads 81/100 on livability (#15 in CT, #1,374 nationally) — a professional / high-income tenant draw. Strengths: amenities A+, commute A+, health & safety A+; Watch: crime C-, employment D+, schools D-.
- Bridgeport School District (urban): math 9% / reading 19% proficiency, ranked #151 of 153 in CT (top 99%) — low school quality limits family demand, transient renter base, plan for 1-2y turnover; 97% free/reduced lunch — lower-income household profile, screen leases tightly.
- Market conditions: Rents rising (+3.1%/yr); 152 active listings in the ZIP; 40 comparable units currently listed for rent nearby; rentals at typical pace (median 25d on market — plan ~3-4 weeks tenant-placement turnaround); 45% of comp listings sitting > 30 days — soft ceiling on asking rent; 852 units permitted in Greater Bridgeport Planning Region in 2024 (698 in 5+ unit buildings).
- At $3,385/mo this rent would consume 55% of the median local household income ($73k/yr) (locally 2163% of renters already pay >50% of income on rent) — very limited rent-growth headroom before tenants either downsize or default.
Forward outlook
- Local home prices are declining (-3.0%/yr); year-one equity from $2k of loan paydown is wiped out by about $8k of value loss. Plan a longer hold.
Negotiation context
- Only 3 days on market — expect competitive offers; lowballing is unlikely to land.
Risks & watch-outs
- Watch-outs: property tax is 2.7% of price; built in 1951 — expect roof / HVAC / electrical / plumbing capex.
- Climate carrying-cost: major wind risk, 41% chance of damaging wind over 30y; extreme-heat days projected 7→15/yr by 2055 (HVAC capex compounding) — expect insurance premiums to compound above CPI over the hold.
Questions for the listing agent
- Built in 1951 — when were the roof, HVAC, electrical panel, plumbing, and water heater last replaced?
- Property tax is high relative to price — has the assessment been appealed recently, and will the sale trigger a re-assessment?
- Is there a deadline driving the sale (1031 exchange, divorce, estate, relocation)? That informs how much negotiation room exists.
- Schools are D-rated, which usually means shorter tenancies and higher turnover. Who's the typical renter profile here, and what's been the actual vacancy rate?
- What's the average days-on-market for RENTAL listings here right now (not sales)? A rising rental-DOM trend means longer vacancies and softer asking-rent achievability than the comps imply.
- What's the recent tenant-quality profile in this submarket — average credit score on applications, eviction rate, late-payment / NSF rate, and stable-employment percentage? A property-management company in the area should have these aggregated.
- How much new for-sale + rental construction is in the pipeline within 1–3 miles? Heavy new supply typically softens prices + rents 12–24 months out; constrained supply supports both.
Investment metrics
- 1% rule
- 1.30% ✓
- Cap rate
- 9.13%
- Cash-on-cash
- 10.12%
- DSCR
- 1.45
- GRM
- 6.4
CMA / ARV
- ARV (on-the-fly)
- $444,030
- Comps found
- 12
Show comp detail 12 sales within ~0.75 mi
| Address | Dist | Beds/Ba | Sqft | Sold | Price | $/sf | Match |
|---|---|---|---|---|---|---|---|
| 291 Frenchtown Rd | 0.38mi | 3/1.5 | 1,584 (+2%) | 3mo | $399,000 | $252 | 77 |
| 76 Luther St | 0.56mi | 3/1.0 | 1,570 (+1%) | 2mo | $425,000 | $271 | 69 |
| 120 Clark St | 0.50mi | 4/2.0 (+1) | 1,556 (-0%) | 2mo | $550,000 | $353 | 68 |
| 35 Marcel St | 0.33mi | 3/1.0 | 1,370 (-12%) | 1mo | $400,000 | $292 | 62 |
| 1265 Lindley St | 0.68mi | 3/1.5 | 1,599 (+3%) | 2mo | $390,000 | $244 | 62 |
| 235 Burnsford Ave | 0.53mi | 3/1.5 | 1,696 (+9%) | 2mo | $470,000 | $277 | 59 |
| 110 Beauvue Ter | 0.62mi | 3/1.5 | 1,673 (+7%) | 1mo | $480,000 | $287 | 58 |
| 114 Oxford St | 0.48mi | 4/1.0 (+1) | 1,457 (-6%) | 3mo | $360,000 | $247 | 57 |
| 490 Woodside Ave | 0.41mi | 3/2.0 | 1,352 (-13%) | 4mo | $385,000 | $285 | 54 |
| 142 Chatham Ter | 0.21mi | 4/4.0 (+1) | 1,731 (+11%) | 4mo | $505,000 | $292 | 53 |
| 403 Clark St | 0.71mi | 3/1.5 | 1,373 (-12%) | 0mo | $375,000 | $273 | 47 |
| 37 Herald Ave | 0.62mi | 4/1.5 (+1) | 1,332 (-14%) | 2mo | $390,000 | $293 | 40 |
Match score weights: distance 35% · size 25% · config 20% · recency 20%. Top-matched comps best support the ARV.
Projected returns pro-forma
-3.0% appreciation · 3.12% rent growth · sell at horizon
- IRR
- -0.9%
- Equity multiple
- 0.97×
- Total profit
- $-2,388
- Equity at exit
- $38,752
- IRR
- 9.0%
- Equity multiple
- 1.70×
- Total profit
- $50,825
- Equity at exit
- $22,471
Cash invested: $72,772 (down + closing). Projections, not guarantees.
Landlord ↔ Tenant lean methodology
- Overall (STATE)
- 27 Tenant-Leaning
- State Connecticut
- 27 Tenant-Leaning · D+7
- County
- — inherits STATE
- City
- — inherits STATE
ZIP-level market 06606
- Rents YoY
- 3.1%
- Active inventory
- 152
- Price-to-rent
- 6.4×
Monthly cashflow live
- Estimated rent
- $3,385 high interval (Pro) →
- Mortgage (P&I)
- −$1,363
- Tax from tax record
- −$589 /mo · $7,071/yr
- Insurance
- −$108
- HOA
- −$0
- Vacancy / Maint / Mgmt
- −$711
- Net cashflow
- $614
Break-even live
Sensitivity live
| Price | -10% $761 | -5% $688 | +0% $614 | +5% $540 | +10% $467 |
|---|---|---|---|---|---|
| Rent | -10% $347 | -5% $480 | +0% $614 | +5% $748 | +10% $881 |
| Rate | -1.0pp $745 | -0.5pp $680 | base $614 | +0.5pp $547 | +1.0pp $478 |
UW: 25.0% down · 7.5% · 30yr · 1.5% tax · 5.0% vac · 8.0% maint · 8.0% mgmt
Financing live
Cash to close
- Down payment
- $64,975
- Closing costs
- $7,797
- Reserves months
- —
- Total cash needed
- —
Loan-product check · same deal, 3 products live
Conventional
25% down · 7.5% · 30yr
- Down + closing
- —
- Monthly P&I
- —
- Monthly cashflow
- —
- DSCR
- —
- Eligible?
- —
Personal DTI + credit; lowest rate.
DSCR
20% down · 8.5% · 30yr
- Down + closing
- —
- Monthly P&I
- —
- Monthly cashflow
- —
- DSCR
- —
- Eligible?
- —
No personal income docs; deal must DSCR.
Hard money
10% down · 12.0% · 12mo
- Down + closing
- —
- Monthly P&I
- —
- Monthly cashflow
- —
- DSCR
- —
- Eligible?
- —
Short-term bridge; refi at stabilization.
Rent comps 40 comps
| Address | Beds | Baths | Sqft | Rent | $/sqft | DOM | Units | Dist |
|---|---|---|---|---|---|---|---|---|
| 15 Overland Ave Bridgeport, CT | 3.0 | 2.5 | 1713 | $4,700 | $2.74 | 45d | 1 | 0.06mi |
| 180 Pleasantview Ave Bridgeport, CT | 3.0 | 2.0 | 1373 | $3,700 | $2.69 | 45d | 1 | 0.07mi |
| 340 Pleasantview Ave Unit 2nd/3rd floors Bridgeport, CT | 4.0 | 2.0 | 1728 | $3,000 | $1.74 | 45d | 1 | 0.14mi |
| 318 Valley Ave Bridgeport, CT | 4.0 | 2.0 | 1718 | $3,250 | $1.89 | 25d | 1 | 0.18mi |
| 524 Beechmont Ave Bridgeport, CT | 3.0 | 1.0 | 1104 | $3,500 | $3.17 | 25d | 1 | 0.20mi |
| 110 Grenelle St Bridgeport, CT | 3.0 | 1.0 | 1351 | $4,000 | $2.96 | 5d | 1 | 0.32mi |
| 120 Englewood Ave Bridgeport, CT | 4.0 | 2.0 | 1675 | $3,650 | $2.18 | 5d | 1 | 0.33mi |
| 127 Englewood Ave Bridgeport, CT | 3.0 | 2.0 | 1530 | $3,800 | $2.48 | 45d | 1 | 0.34mi |
| 28 Higgins Ave Bridgeport, CT | 2.0 | 1.0 | 1828 | $2,200 | $1.20 | 5d | 1 | 0.38mi |
| 192 Frenchtown Rd Bridgeport, CT | 3.0 | 3.5 | 1744 | $4,200 | $2.41 | 45d | 1 | 0.39mi |
| 200 Woodmont Ave #127 Bridgeport, CT | 2.0 | 1.5 | 1184 | $2,600 | $2.20 | 25d | 1 | 0.41mi |
| 845 Hart St Unit 2 Bridgeport, CT | 3.0 | 1.0 | 1200 | $2,500 | $2.08 | 45d | 1 | 0.43mi |
| 275 Burnsford Ave Bridgeport, CT | 3.0 | 1.0 | 1116 | $3,200 | $2.87 | 25d | 1 | 0.54mi |
| 123 Harmony St Bridgeport, CT | 3.0 | 1.0 | 2000 | $2,500 | $1.25 | 45d | 1 | 0.57mi |
| 70 Pitt St Bridgeport, CT | 4.0 | 1.0 | 1208 | $3,200 | $2.65 | 23d | 1 | 0.63mi |
| 466 Merritt St Bridgeport, CT | 2.0 | 1.0 | 1650 | $1,800 | $1.09 | 45d | 1 | 0.68mi |
| 131 Infield St Bridgeport, CT | 3.0 | 1.5 | 1199 | $3,450 | $2.88 | 45d | 1 | 0.71mi |
| 457 Summit St Bridgeport, CT | 3.0 | 1.5 | 1511 | $4,000 | $2.65 | 45d | 1 | 0.74mi |
| 14 Infield St Bridgeport, CT | 3.0 | 2.5 | 1344 | $3,200 | $2.38 | 45d | 1 | 0.75mi |
| 68-70 Westfield Ave Bridgeport, CT | 4.0 | 2.0 | 1470 | $3,200 | $2.18 | 16d | 1 | 0.76mi |
| 715 Frenchtown Rd #4 Bridgeport, CT | 2.0 | 1.5 | 1200 | $2,300 | $1.92 | 25d | 1 | 0.79mi |
| 715 Frenchtown Rd #40 Bridgeport, CT | 2.0 | 1.5 | 1200 | $2,500 | $2.08 | 45d | 1 | 0.79mi |
| 74 Village Ln Bridgeport, CT | 3.0 | 2.0 | 1428 | $3,500 | $2.45 | 4d | 1 | 0.80mi |
| 139 Little Deer Rd Bridgeport, CT | 4.0 | 2.0 | 1420 | $3,600 | $2.54 | 45d | 1 | 0.81mi |
| 208 Fairview Ave Bridgeport, CT | 3.0 | 1.0 | 1200 | $2,300 | $1.92 | 25d | 1 | 0.83mi |
| 415 Savoy St Bridgeport, CT | 3.0 | 3.0 | 1850 | $3,500 | $1.89 | 45d | 1 | 0.85mi |
| 765 Birmingham St Bridgeport, CT | 3.0 | 1.0 | 1094 | $3,600 | $3.29 | 4d | 1 | 0.90mi |
| 1956 Madison Ave Unit 2 Bridgeport, CT | 2.0 | 2.0 | 1166 | $1,800 | $1.54 | 45d | 1 | 0.93mi |
| 23 Ochsner Pl Unit 1 Bridgeport, CT | 3.0 | 1.0 | 1250 | $3,800 | $3.04 | 45d | 1 | 1.03mi |
| 130 Deramo Pl Bridgeport, CT | 3.0 | 1.5 | 1252 | $3,700 | $2.96 | 4d | 1 | 1.03mi |
| 927 Birmingham St Bridgeport, CT | 4.0 | 2.0 | 1362 | $3,800 | $2.79 | 4d | 1 | 1.05mi |
| 51 Indian Ave Unit 1546115P Bridgeport, CT | 3.0 | 1.0 | 1388 | $3,871 | $2.79 | 13d | 1 | 1.05mi |
| 5 Cloverhill Ave Bridgeport, CT | 4.0 | 2.0 | 1344 | $4,000 | $2.98 | 4d | 1 | 1.07mi |
| 56 Janet Cir #7 Bridgeport, CT | 2.0 | 2.0 | 1156 | $2,600 | $2.25 | 5d | 1 | 1.07mi |
| 2744 Main St Bridgeport, CT | 2.0 | 1.0 | 1315 | $2,250 | $1.71 | 25d | 1 | 1.09mi |
| 389 Hawley Ave Unit 3 Bridgeport, CT | 2.0 | 1.0 | 1160 | $1,900 | $1.64 | 25d | 1 | 1.10mi |
| 50 Trumbull Ave Bridgeport, CT | 2.0 | 1.0 | 1200 | $2,400 | $2.00 | 25d | 1 | 1.10mi |
| 156 Garden Dr Bridgeport, CT | 2.0 | 1.0 | 1176 | $2,400 | $2.04 | 45d | 1 | 1.11mi |
| 560 Old Town Rd Trumbull, CT | 3.0 | 2.0 | 1896 | $3,800 | $2.00 | 4d | 1 | 1.12mi |
| 18 Amsterdam Ave Unit 3A Bridgeport, CT | 2.0 | 1.5 | 1158 | $2,175 | $1.88 | 45d | 1 | 1.13mi |
Listing history 5 events
-
2026-06-13status $259,900 Under Contract 3 DOM
-
2026-06-10days on market $259,900 Active 3 DOM
-
2026-06-09days on market $259,900 Active 2 DOM
-
2026-06-07remarks 201-char remark
-
2026-06-07$259,900 Active 1 DOM
ⓘ Source: listings_history table (triggers on properties + properties_extension) + one-shot
backfill from property_details.listing_events for pre-trigger history.
Tax reassessment forecast CT · Partial reset (capped growth)
- Current annual tax
- $7,071 · $589/mo
- Projected year-2 tax
- $7,071 · $589/mo
- Expected delta
- $0/yr ($0/mo · 0.0%)
ⓘ Screening estimate from a state-policy table — verify with the county assessor before closing.
Climate risk First Street
- Flood 1/10 Low FEMA zone X (unshaded) · 0% chance over 30 yrs
- Wildfire 1/10 Low
- Heat 6/10 Major 7 d/yr ≥97°F today · 15 d/yr by 30 yrs out
- Wind 6/10 Major 41% chance of damaging wind over 30 yrs
- Air quality 4/10 Moderate 5 unhealthy d/yr today · 7 by 30 yrs out
Nearby sold comps map
Loading sold comps map…
Walkable amenities ~0.75 mi
Loading nearby amenities…
Taxation est. · year 1
- Rental income
- $40,625
- − Mortgage interest
- −$14,558
- − Property taxes
- −$7,071
- − Insurance
- −$1,300
- − Repairs & maintenance
- −$3,250
- − Management
- −$3,250
- − Depreciation
- −$7,561
- Taxable income
- $3,635
- Est. tax owed @ 24.0%
- −$872
- After-tax cash flow
- $6,495/yr
For passive investors: Depreciation is non-cash, so a rental often shows a tax loss while cash-flowing — sheltering income. Rental losses are passive: they offset passive income freely, and up to $25,000/yr can offset ordinary (W-2) income if you actively participate and your MAGI is under $100k (phasing out to $0 by $150k); unused losses carry forward. On sale, claimed depreciation is recaptured at up to 25%, and gains may owe capital-gains tax (a 1031 exchange can defer both). Figures are a year-1 estimate at your 24.0% rate — not tax advice; consult a CPA.
Schools (NCES district)
- District
- Bridgeport School District
- NCES district ID
- 0900450
- Math proficiency
- 9% ▼ -7.00%
- Reading proficiency
- 19% ▼ -10.00%
- Median HH income
- $41,507
- Composite
- 12.09/100
- National rank
- #9656
- State rank
- #151 of 153 in CT
Livability — Bridgeport
- Score
- 81/100
- State rank
- #15
- US rank
- #1374
Category grades
Schools grade is shown separately in the Schools card above.
Census & demographics
- Census place
- Bridgeport, CT
- County
- Fairfield County · 765,532 people
- City population
- 149,153
- Metro
- Bridgeport-Stamford-Norwalk, CT
- Population (ZIP)
- 49,308
- Household income
- $73,372
- Rent vs Own
- Severe rent burden
- 2163.0
Population outlook (Greater Bridgeport County) Hauer SSP2
- By 2040
- 365,581
Race, ethnicity, and origin ACS 2023
- Neighborhood character
- Highly diverse neighborhood (Simpson 0.73)
- Race & ethnicity
- Hispanic / Latino 37% White 31% Black 19% Two or more races 11% Asian 7%
- Hispanic origin (detail)
- Mexican 5% Puerto Rican 12% Dominican 4%
- Common ancestry
- Estonian 5% Russian 4% Romanian 3%
- Foreign-born
- 37% · Canada, Jamaica, Vietnam
- Languages at home
- 50% English-only · Spanish 27% Other Indo-European 15% French/Haitian/Cajun 2%
Political lean MEDSL · Greater Bridgeport
- 2024 margin
- Strong D (+23.3) · D 60.9% · R 37.6% · Other 1.5%
- All cycles
- 2024: D+23.3
Not yet ingested
- Civics
- —
Market trends
- HPI YoY
- ▼ -270.11%
- Current HPI
- 345.647
- Rent YoY
- ▲ 3.12%
- Metro
- Bridgeport-Stamford-Norwalk, CT
- State GDP YoY
- ▲ 1.06%
- F500 in state
- 38
Industry mix (Fortune 500 HQ in CT)
| Industry | F500 HQs | Revenue |
|---|---|---|
| Industrial Machinery | 4 | $38B |
|
||
| Insurance | 3 | $71B |
|
||
| Financial Services | 2 | $25B |
|
||
| Transportation / Logistics | 2 | $18B |
|
||
| Healthcare | 1 | $247B |
|
||
| Telecommunications | 1 | $55B |
|
||
Price history
1 event — show timeline
- 2026-06-07 Listed $259,900 Smart MLS
Property tax history
+2.2%/yrLatest (2023): $7,071 · +0.0% YoY. Source: county tax records.
Cash-flow waterfall
monthlySold comps — $/sqft
last 12 mo · ≤1 miLoading sold comps…