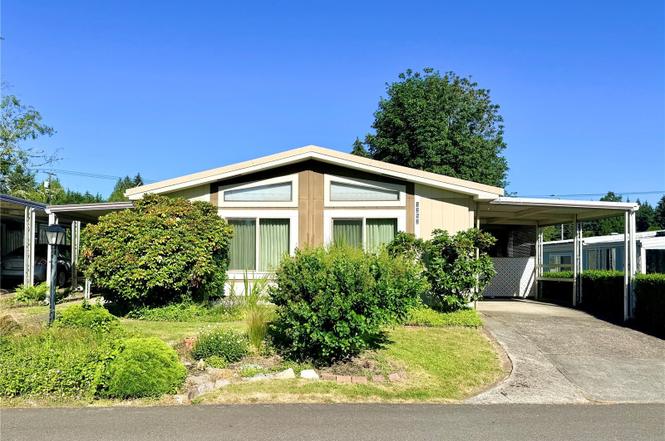
1352 Alonda Ln NE · Lacey, WA
Flood risk No data
- FEMA flood zone
- —
- Chance of flooding over 30 yrs
- —
- Est. flood insurance / yr
- —
Fire risk No data
- Est. fire insurance / yr
- —
Heat risk No data
- Hot days now (above threshold)
- —
- Hot days in 30 yrs
- —
Wind risk No data
- Chance of severe wind over 30 yrs
- —
Air-quality risk No data
- Unhealthy air days now
- —
- Unhealthy air days in 30 yrs
- —
Risk factors via First Street. Map © Google.
Why this score? — see what drove the B grade
The composite is a weighted blend of 9 inputs, each scored 0–100. Each bar is that input's sub-score; the figure is the points it added to the 100-point composite (weight × sub-score).
- Cash flow +30.0/30.0
- 1% rule +10.0/10.0
- DSCR +10.0/10.0
- ARV discount +7.5/15.0
- Schools +5.1/10.0
- Livability +4.2/5.0
- Rent growth +3.4/5.0
- Condition / age +2.5/5.0
- Appreciation +0.0/10.0
$87,500
🖨 Deal sheet 📄 Offer letter ✓ Due diligence
Listing remarks
Nice 2-bedroom home in quiet 55+ community. Features open-concept living and an airy feel. Spacious living area features vaulted ceilings, skylights, and tall accent windows. Kitchen offers extensive cabinetry, built-in oven, pantry, eating bar, and adjoining dining area with built-in hutch. Large primary bedroom includes attached bath with a garden tub and separate walk-in shower. Laundry room includes built-in counter space for folding and storage. Heat pump/AC, covered carport, storage building, landscaped yard, and peaceful backdrop of trees. Convenient location near shopping, services, and I-5. Bring your vision and make this home shine!
Key facts
- Extensive cabinetry
- Tall accent windows
- Vaulted ceilings
Tags
Property features AI
Finance
- Financial info: Accepts Cash and Conventional financing
- HOA & community: Located in Alonda Villa manufactured home park (approximately 129 homes); Senior community / senior exemption applies; Park approved for sale; Park amenities include clubhouse and common area; Land lease: $1,010
Exterior
- Parking: Carport
- Utilities: Public water; Septic (by park); Electric service (Puget Sound Energy); Cable connected (Xfinity); Internet connected (Xfinity)
- Home design: Manufactured double-wide home (Dartmouth); One story; Good condition; Skirted with metal; Mobile home remains
- Construction: Wood construction; Metal roof; Pillar/post/pier foundation; Manufactured after 6/15/1976
- Exterior features: Wood exterior products; Awnings; Patio/porch/deck; Storage at back of carport; Paved lot
Interior
- Kitchen: Dishwasher; Refrigerator; Stove/Range
- Bedrooms: 2 bedrooms
- Flooring: Vinyl; Carpet
- Bathrooms: 1 full bath; 1 three-quarter bath; 1 bathtub; 2 showers
- Heating & cooling: Forced air heating; Heat pump; Central air conditioning
- Interior features: Water heater (electric; located on exterior wall); Vaulted ceilings; Skylights; Ceiling fan(s); Double pane windows; Drapes; Landscaped
- Laundry & utility: Washer; Dryer; Utility room
Neighborhood map
What this means for you Summary
Snapshot
- This is a 2-bed/2.0-bath manufactured listed at $88k.
Deal economics
- At list price, monthly cash flow is $1k ($15k/yr) — positive.
- The deal already cash-flows at list — no discount required.
- Meets the 1% rule at list price ($2k rent vs $88k).
- Cap rate 23.0% vs local median 3.0% in Lacey — top-decile yield for the area; either an underpriced asset or a hidden risk that comps aren't pricing in. Stress-test before assuming the spread holds.
Location & tenants
- Location reads 85/100 on livability (#33 in WA, #581 nationally) — a professional / high-income tenant draw. Strengths: amenities A+, commute A+, housing A+; Watch: cost of living D+.
- North Thurston Public Schools (suburban): math 51% / reading 62% proficiency, ranked #80 of 291 in WA (top 28%) — acceptable for families but not a draw, mixed tenant base, ~2y average lease.
- Zoned schools: South Bay Elementary (588 students, 40% FRL); North Thurston High School (1,440 students, 47% FRL).
- Market conditions: Rents rising (+3.8%/yr); 218 active listings in the ZIP; 13 comparable units currently listed for rent nearby; rentals leasing fast (median 14d on market — plan ~1-2 weeks tenant-placement turnaround); solid renter incomes; 1,222 units permitted in Thurston County in 2024 (508 in 5+ unit buildings).
Forward outlook
- Local home prices are declining (-3.0%/yr); year-one equity from $605 of loan paydown is wiped out by about $3k of value loss. Plan a longer hold.
- Thurston County population projected at +27% by 2050 — long-run rental-demand tailwind backs the buy-and-hold thesis.
- At projected returns (-3.0% appreciation + 3.8% rent growth), your $24k cash investment doubles in ~2 years — after that, you're playing with house money.
Negotiation context
- Only 1 days on market — expect competitive offers; lowballing is unlikely to land.
- 4 sale attempts since 25y ago with the ask held roughly flat each time — persistent listings suggest the price (not the market) is what's stuck; bring a comps-based counter.
- Current owner paid $48k; list at $88k implies a 84% gain — meaningful room to come down on a strong offer.
Questions for the listing agent
- Is there a deadline driving the sale (1031 exchange, divorce, estate, relocation)? That informs how much negotiation room exists.
- Schools are B-rated — typically a magnet for longer-tenancy family renters. What's the average tenant stay here, and is there a school-zone premium baked into asking?
- What's the average days-on-market for RENTAL listings here right now (not sales)? A rising rental-DOM trend means longer vacancies and softer asking-rent achievability than the comps imply.
- What's the recent tenant-quality profile in this submarket — average credit score on applications, eviction rate, late-payment / NSF rate, and stable-employment percentage? A property-management company in the area should have these aggregated.
- How much new for-sale + rental construction is in the pipeline within 1–3 miles? Heavy new supply typically softens prices + rents 12–24 months out; constrained supply supports both.
Investment metrics
- 1% rule
- 2.54% ✓
- Cap rate
- 23.00%
- Cash-on-cash
- 59.67%
- DSCR
- 3.66
- GRM
- 3.3
CMA / ARV
- ARV (on-the-fly)
- $57,408
- Comps found
- 8
Show comp detail 8 sales within ~0.75 mi
| Address | Dist | Beds/Ba | Sqft | Sold | Price | $/sf | Match |
|---|---|---|---|---|---|---|---|
| 1350 Alonda Ln NE | 0.01mi | 2/2.0 | 1,152 (+4%) | 7mo | $50,000 | $43 | 87 |
| 1519 Alonda Ln NE | 0.07mi | 2/2.0 | 1,152 (+4%) | 8mo | $60,000 | $52 | 82 |
| 1507 Alonda Ln NE | 0.10mi | 2/2.0 | 1,248 (+13%) | 1mo | $35,000 | $28 | 73 |
| 1417 Alonda Ln NE | 0.05mi | 2/1.5 | 960 (-13%) | 13mo | $65,000 | $68 | 63 |
| 1414 Alonda Ln NE | 0.08mi | 2/2.0 | 1,247 (+13%) | 17mo | $60,000 | $48 | 60 |
| 4611 17th Ln NE #17 | 0.24mi | 2/1.0 | 1,056 (-4%) | 22mo | $142,500 | $135 | 59 |
| 2005 Alonda Ln NE | 0.14mi | 2/1.0 | 960 (-13%) | 23mo | $49,500 | $52 | 49 |
| 2310 Alonda Ln NE | 0.19mi | 3/2.0 (+1) | 1,218 (+10%) | 24mo | $127,000 | $104 | 49 |
Match score weights: distance 35% · size 25% · config 20% · recency 20%. Top-matched comps best support the ARV.
Projected returns pro-forma
-3.0% appreciation · 3.75% rent growth · sell at horizon
- IRR
- 59.2%
- Equity multiple
- 3.66×
- Total profit
- $65,096
- Equity at exit
- $13,047
- IRR
- 64.2%
- Equity multiple
- 7.68×
- Total profit
- $163,598
- Equity at exit
- $7,565
Cash invested: $24,500 (down + closing). Projections, not guarantees.
Landlord ↔ Tenant lean methodology
- Overall (STATE)
- 28 Tenant-Leaning
- State Washington
- 28 Tenant-Leaning · D+8
- County
- — inherits STATE
- City
- — inherits STATE
ZIP-level market 98516
- Rents YoY
- 3.8%
- Active inventory
- 218
- Price-to-rent
- 3.3×
Monthly cashflow live
- Estimated rent
- $2,220 high interval (Pro) →
- Mortgage (P&I)
- −$459
- Tax from tax record
- −$40 /mo · $482/yr
- Insurance
- −$36
- HOA
- −$0
- Vacancy / Maint / Mgmt
- −$466
- Net cashflow
- $1,218
Break-even live
UW: 25.0% down · 7.5% · 30yr · 1.5% tax · 5.0% vac · 8.0% maint · 8.0% mgmt
Financing live
Cash to close
- Down payment
- $21,875
- Closing costs
- $2,625
- Reserves months
- —
- Total cash needed
- —
Loan-product check · same deal, 3 products live
Conventional
25% down · 7.5% · 30yr
- Down + closing
- —
- Monthly P&I
- —
- Monthly cashflow
- —
- DSCR
- —
- Eligible?
- —
Personal DTI + credit; lowest rate.
DSCR
20% down · 8.5% · 30yr
- Down + closing
- —
- Monthly P&I
- —
- Monthly cashflow
- —
- DSCR
- —
- Eligible?
- —
No personal income docs; deal must DSCR.
Hard money
10% down · 12.0% · 12mo
- Down + closing
- —
- Monthly P&I
- —
- Monthly cashflow
- —
- DSCR
- —
- Eligible?
- —
Short-term bridge; refi at stabilization.
Rent comps 13 comps
| Address | Beds | Baths | Sqft | Rent | $/sqft | DOM | Units | Dist |
|---|---|---|---|---|---|---|---|---|
| 925 Bradley St NE Olympia, WA | 3.0 | 2.0 | 1403 | $2,650 | $1.89 | 43d | 1 | 0.21mi |
| 927 College Ln NE Unit A Lacey, WA | 3.0 | 2.5 | 1390 | $2,300 | $1.65 | 43d | 1 | 0.23mi |
| 5224 15th Ave NE Olympia, WA | 1.0–3.0 | 1.0–2.0 | 881 | $2,165 | $2.46 | 13d | 258 | 0.60mi |
| 1848 Mapleview Ct NE Olympia, WA | 3.0 | 2.0 | 1489 | $3,000 | $2.01 | 43d | 1 | 0.60mi |
| 606 Lilly Rd NE Olympia, WA | 1.0–2.0 | 1.0–2.0 | 966 | $2,725 | $2.82 | 13d | 7 | 0.69mi |
| 5499 15th Ave NE Lacey, WA | 1.0–3.0 | 1.0–2.0 | 904 | $2,106 | $2.33 | 13d | 26 | 0.74mi |
| 522 Lilly Rd NE Olympia, WA | 1.0–2.0 | 1.0 | 781 | $1,550 | $1.98 | 13d | 6 | 0.75mi |
| 3724 Ensign Rd NE Olympia, WA | 2.0 | 1.0–2.0 | 920 | $1,849 | $2.01 | 13d | 5 | 0.90mi |
| 801 Lilly Rd NE Apt 123 Olympia, WA | 1.0 | 1.0 | 762 | $1,700 | $2.23 | 43d | 1 | 0.98mi |
| 4410 6th Ave SE Lacey, WA | 1.0–3.0 | 1.0–2.0 | 980 | $2,010 | $2.05 | 13d | 14 | 1.05mi |
| 122 Lilly Rd NE Unit 507 Olympia, WA | 3.0 | 1.0 | 800 | $1,900 | $2.38 | 21d | 1 | 1.05mi |
| 122 Lilly Rd NE Unit 104 Olympia, WA | 2.0 | 1.0 | 750 | $1,700 | $2.27 | 21d | 1 | 1.05mi |
| 501 Franz Anderson Rd SE Olympia, WA | 1.0 | 1.0 | 720 | $1,598 | $2.22 | 13d | 3 | 1.38mi |
Listing history 2 events
-
2026-06-19remarks 650-char remark
-
2026-06-19$87,500 Active 1 DOM
ⓘ Source: listings_history table (triggers on properties + properties_extension) + one-shot
backfill from property_details.listing_events for pre-trigger history.
Tax reassessment forecast WA · Resets to sale price
- Current annual tax
- $482 · $40/mo
- Projected year-2 tax
- $858 · $71/mo
- Expected delta
- +$375/yr (+$31/mo · 77.8%)
ⓘ Screening estimate from a state-policy table — verify with the county assessor before closing.
Nearby sold comps map
Loading sold comps map…
Walkable amenities ~0.75 mi
Loading nearby amenities…
Taxation est. · year 1
- Rental income
- $26,640
- − Mortgage interest
- −$4,901
- − Property taxes
- −$482
- − Insurance
- −$438
- − Repairs & maintenance
- −$2,131
- − Management
- −$2,131
- − Depreciation
- −$2,545
- Taxable income
- $14,012
- Est. tax owed @ 24.0%
- −$3,363
- After-tax cash flow
- $11,257/yr
For passive investors: Depreciation is non-cash, so a rental often shows a tax loss while cash-flowing — sheltering income. Rental losses are passive: they offset passive income freely, and up to $25,000/yr can offset ordinary (W-2) income if you actively participate and your MAGI is under $100k (phasing out to $0 by $150k); unused losses carry forward. On sale, claimed depreciation is recaptured at up to 25%, and gains may owe capital-gains tax (a 1031 exchange can defer both). Figures are a year-1 estimate at your 24.0% rate — not tax advice; consult a CPA.
Schools (NCES district)
- District
- North Thurston Public Schools
- NCES district ID
- 5305850
- Math proficiency
- 51% ▬ 0.00%
- Reading proficiency
- 62% ▬ 0.00%
- Median HH income
- $62,338
- Composite
- 51.09/100
- National rank
- #3798
- State rank
- #80 of 291 in WA
Livability — Lacey
- Score
- 85/100
- State rank
- #33
- US rank
- #581
Category grades
Schools grade is shown separately in the Schools card above.
Census & demographics
- County
- Thurston County · 269,345 people
- City population
- 108,850
- Metro
- Olympia-Lacey-Tumwater, WA
- Population (ZIP)
- 29,177
- Household income
- $98,892
- Rent vs Own
- Severe rent burden
- 1202.0
Population outlook (Thurston County) Hauer SSP2
- Today (2025)
- 308,239 people
- By 2030
- 326,483 · +5.9%
- By 2040
- 359,890 · +16.8%
- By 2050
- 391,800 · +27.1%
- By 2075
- 468,024 · +51.8%
- By 2100
- 519,890 · +68.7%
Race, ethnicity, and origin ACS 2023
- Neighborhood character
- Diverse neighborhood (Simpson 0.58)
- Race & ethnicity
- White 62% Two or more races 14% Asian 11% Hispanic / Latino 10% Black 4% Pacific Islander 1%
- Hispanic origin (detail)
- Mexican 6%
- Common ancestry
- Portuguese 3% Lithuanian 2% Iranian 2%
- Foreign-born
- 14% · Canada, Vietnam, South Korea
- Languages at home
- 81% English-only · Spanish 7% Other Asian/Pacific 3% Tagalog/Filipino 2%
Political lean MEDSL · Thurston
- 2024 margin
- Strong D (+20.4) · D 58.5% · R 38.1% · Other 3.5%
- 2008→2024 swing
- -1.3pp toward R · 2008: 21.7pp · 2024: 20.4pp
- All cycles
- 2024: D+20.4 2020: D+18.6 2016: D+15.4 2012: D+19.0 2008: D+21.7
Not yet ingested
- Civics
- —
Market trends
- HPI YoY
- ▼ -203.16%
- Current HPI
- 323.7121
- Rent YoY
- ▲ 3.75%
- Metro
- Olympia-Lacey-Tumwater, WA
- State GDP YoY
- ▲ 4.65%
- F500 in state
- 22
Industry mix (Fortune 500 HQ in WA)
| Industry | F500 HQs | Revenue |
|---|---|---|
| Retail | 2 | $269B |
|
||
| Technology / Retail | 1 | $638B |
|
||
| Technology | 1 | $245B |
|
||
| Telecommunications | 1 | $38B |
|
||
| Food / Beverage | 1 | $36B |
|
||
| Automotive / Trucks | 1 | $34B |
|
||
Price history
+192.6% since first listed10 events — show timeline
- 2026-06-18 Listed $87,500 NWMLS as Distributed by MLS Grid
- 2019-06-24 Listed $47,500 NWMLS as Distributed by MLS Grid
- 2019-06-24 Sold (MLS) $47,500 NWMLS as Distributed by MLS Grid
- 2013-07-05 Delisted — NWMLS as Distributed by MLS Grid
- 2013-07-03 Sold (MLS) $20,000 NWMLS as Distributed by MLS Grid
- 2013-06-08 Pending — NWMLS as Distributed by MLS Grid
- 2013-03-29 Price Changed $24,950 NWMLS as Distributed by MLS Grid
- 2013-02-26 Listed $29,500 NWMLS as Distributed by MLS Grid
- 2001-06-25 Sold (MLS) $27,500 NWMLS as Distributed by MLS Grid
- 2001-04-10 Listed $29,900 NWMLS as Distributed by MLS Grid
Property tax history
+9.8%/yrLatest (2021): $482 · +29.1% YoY. Source: county tax records.
Cash-flow waterfall
monthlySold comps — $/sqft
last 12 mo · ≤1 miLoading sold comps…