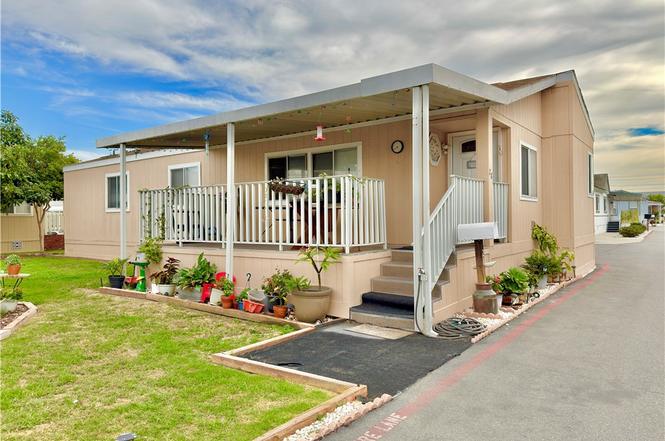
28 Walnut #28 · Anaheim, CA
Flood risk 1/10 · Minimal
- FEMA flood zone
- X (shaded)
- Chance of flooding over 30 yrs
- 0.0%
- Est. flood insurance / yr
- $507 – $1,088
Fire risk 1/10 · Minimal
- Est. fire insurance / yr
- $659 – $1,223
Heat risk 6/10 · Moderate
- Hot days now (above 93°F)
- 7 days/yr
- Hot days in 30 yrs
- 22 days/yr
Wind risk 1/10 · Minimal
- Chance of severe wind over 30 yrs
- —
Air-quality risk 5/10 · Moderate
- Unhealthy air days now
- 7 days/yr
- Unhealthy air days in 30 yrs
- 9 days/yr
Risk factors via First Street. Map © Google.
Why this score? — see what drove the C+ grade
The composite is a weighted blend of 9 inputs, each scored 0–100. Each bar is that input's sub-score; the figure is the points it added to the 100-point composite (weight × sub-score).
- Cash flow +30.0/30.0
- 1% rule +10.0/10.0
- DSCR +10.0/10.0
- Rent growth +3.8/5.0
- Livability +3.5/5.0
- Condition / age +2.5/5.0
- Schools +2.3/10.0
- ARV discount +0.0/15.0
- Appreciation +0.0/10.0
$185,000
🖨 Deal sheet 📄 Offer letter ✓ Due diligence
Listing remarks
Welcome to this fantastic open-floor-plan double-wide Home featuring 3 bedrooms and 2 bathrooms, situated on a beautifully landscaped, spacious property. It is pet-friendly and suitable for residents of all ages. The side yard is a standout feature, providing an excellent outdoor retreat. Additionally, the property includes a storage shed and a carport with parking space for two vehicles. The community is near major freeways and shopping centers; you'll enjoy easy access to Downtown Fullerton, Downtown Disney, Disneyland Park, Knott's Berry Farm, The Anaheim Convention Center, The Honda Center, Angel Stadium, Restaurants, Little Arabia, and Much More. Don't miss the opportunity to make this
Key facts
- Landscaped property
- Carport
- Storage shed
Tags
Property features AI
Finance
- Financial info: Land lease payable ($1,870)
- HOA & community: Part of an association (Rancho La Paz); Community gutters
Exterior
- Parking: Driveway parking; Part of Rancho La Paz park
- Security: 24-hour security
- Utilities: Public/district water; Public sewer; Electricity on property; Natural gas available; Cable available; Sewer connected
- Home design: Single-story; Mobile home (24' x 50', model 3502K) — mobile home remains on site; Raised foundation; Asbestos shingle roof; Property has 2+ access exits
- Construction: Siding exterior
- Exterior features: Porch; Rain gutters; Siding skirt; Association pool
Interior
- Kitchen: Formica counters; Kitchen open to family room
- Bedrooms: All bedrooms on the ground floor
- Flooring: Laminate flooring
- Bathrooms: 2 full bathrooms with bathtub and shower
- Heating & cooling: Central heating (furnace); Central air conditioning
- Interior features: Balcony; High ceilings (9 feet+); Open floor plan; Entry on upper level reached by 5 steps; Turnkey condition; 24-hour security
- Laundry & utility: Separate laundry room
Neighborhood map
What this means for you Summary
Snapshot
- This is a 3-bed/2.0-bath manufactured listed at $185k.
Deal economics
- At list price, monthly cash flow is $1k ($15k/yr) — positive.
- The deal already cash-flows at list — no discount required.
- Meets the 1% rule at list price ($3k rent vs $185k).
- Recommended offer: $182k (1.5% below list) — sets the bar for market timing.
- Cap rate 14.5% vs local median 2.2% in Anaheim — top-decile yield for the area; either an underpriced asset or a hidden risk that comps aren't pricing in. Stress-test before assuming the spread holds.
Location & tenants
- Location reads 70/100 on livability (#240 in CA) — a middle-class / working-renter tenant base. Strengths: amenities A+, commute A+, employment A+; Watch: health & safety C-, crime F, cost of living F.
- Anaheim Elementary (urban): math 25% / reading 25% proficiency, ranked #386 of 517 in CA (top 75%) — low school quality limits family demand, transient renter base, plan for 1-2y turnover; 73% free/reduced lunch — lower-income household profile, screen leases tightly.
- Market conditions: Rents rising fast (+5.1%/yr); 72 active listings in the ZIP; 40 comparable units currently listed for rent nearby; rentals leasing fast (median 1d on market — plan ~1-2 weeks tenant-placement turnaround); solid renter incomes; 6,974 units permitted in Orange County in 2024 (3,839 in 5+ unit buildings).
- At $3,227/mo this rent would consume 46% of the median local household income ($84k/yr) (locally 3604% of renters already pay >50% of income on rent) — very limited rent-growth headroom before tenants either downsize or default.
Forward outlook
- Local home prices are declining (-3.0%/yr); year-one equity from $1k of loan paydown is wiped out by about $6k of value loss. Plan a longer hold.
- Orange County population projected at +14% by 2050 — modest demand growth; plan on rents tracking national, not racing it.
- At projected returns (-3.0% appreciation + 5.1% rent growth), your $52k cash investment doubles in ~4 years — after that, you're playing with house money.
Negotiation context
- It's been on market 22 days — a 2% lower offer ($182k) is reasonable based on typical stale-listing flexibility.
- 2 sale attempts with the ask held roughly flat each time — persistent listings suggest the price (not the market) is what's stuck; bring a comps-based counter.
Risks & watch-outs
- Climate carrying-cost: extreme-heat days projected 7→22/yr by 2055 (HVAC capex compounding) — expect insurance premiums to compound above CPI over the hold.
Questions for the listing agent
- Is there a deadline driving the sale (1031 exchange, divorce, estate, relocation)? That informs how much negotiation room exists.
- Crime grade is F in this area — have there been break-ins, vandalism, or insurance claims at this property in the last 3 years? What carrier currently insures it and at what premium?
- What's the average days-on-market for RENTAL listings here right now (not sales)? A rising rental-DOM trend means longer vacancies and softer asking-rent achievability than the comps imply.
- What's the recent tenant-quality profile in this submarket — average credit score on applications, eviction rate, late-payment / NSF rate, and stable-employment percentage? A property-management company in the area should have these aggregated.
- How much new for-sale + rental construction is in the pipeline within 1–3 miles? Heavy new supply typically softens prices + rents 12–24 months out; constrained supply supports both.
Investment metrics
- 1% rule
- 1.74% ✓
- Cap rate
- 14.54%
- Cash-on-cash
- 29.44%
- DSCR
- 2.31
- GRM
- 4.8
CMA / ARV
- ARV (on-the-fly)
- $152,750
- Comps found
- 12
Show comp detail 12 sales within ~0.75 mi
| Address | Dist | Beds/Ba | Sqft | Sold | Price | $/sf | Match |
|---|---|---|---|---|---|---|---|
| 22 Magnolia Via | 0.32mi | 2/2.0 (-1) | 1,200 (+2%) | 3mo | $120,000 | $100 | 74 |
| 63 Cherry #63 | 0.19mi | 3/2.0 | 1,100 (-6%) | 10mo | $164,000 | $149 | 73 |
| 63 Lemon Via | 0.14mi | 2/2.0 (-1) | 1,152 (-2%) | 17mo | $170,000 | $148 | 71 |
| 27 Cypress Via | 0.09mi | 2/2.0 (-1) | 1,100 (-6%) | 13mo | $125,000 | $114 | 69 |
| 13 Elm Via #13 | 0.09mi | 2/2.0 (-1) | 1,040 (-12%) | 11mo | $159,900 | $154 | 62 |
| 13 PALM Via | 0.31mi | 2/2.0 (-1) | 1,056 (-10%) | 2mo | $90,000 | $85 | 62 |
| 21 Ash | 0.22mi | 2/2.0 (-1) | 1,238 (+5%) | 17mo | $209,000 | $169 | 61 |
| 33 Walnut | 0.11mi | 2/2.0 (-1) | 1,080 (-8%) | 21mo | $140,000 | $130 | 59 |
| 8 Ash Via | 0.26mi | 2/2.0 (-1) | 1,300 (+11%) | 9mo | $99,900 | $77 | 58 |
| 7 Magnolia | 0.28mi | 2/2.0 (-1) | 1,344 (+14%) | 3mo | $140,000 | $104 | 55 |
| 55 Lemon | 0.14mi | 2/2.0 (-1) | 1,344 (+14%) | 20mo | $161,000 | $120 | 48 |
| 1241 N East #216 | 0.74mi | 3/2.0 | 1,344 (+14%) | 1mo | $249,000 | $185 | 41 |
Match score weights: distance 35% · size 25% · config 20% · recency 20%. Top-matched comps best support the ARV.
Projected returns pro-forma
-3.0% appreciation · 5.13% rent growth · sell at horizon
- IRR
- 26.3%
- Equity multiple
- 2.12×
- Total profit
- $58,079
- Equity at exit
- $27,584
- IRR
- 35.2%
- Equity multiple
- 4.58×
- Total profit
- $185,276
- Equity at exit
- $15,995
Cash invested: $51,800 (down + closing). Projections, not guarantees.
Landlord ↔ Tenant lean methodology
- Overall (STATE)
- 18 Strongly Tenant-Friendly
- State California
- 18 Strongly Tenant-Friendly · D+13
- County
- — inherits STATE
- City
- — inherits STATE
ZIP-level market 92801
- Rents YoY
- 5.1%
- Active inventory
- 72
- Price-to-rent
- 4.8×
Monthly cashflow live
- Estimated rent
- $3,227 high interval (Pro) →
- Mortgage (P&I)
- −$970
- Tax est. 1.5%
- −$231 /mo · $2,775/yr
- Insurance
- −$77
- HOA
- −$0
- Vacancy / Maint / Mgmt
- −$678
- Net cashflow
- $1,271
Break-even live
UW: 25.0% down · 7.5% · 30yr · 1.5% tax · 5.0% vac · 8.0% maint · 8.0% mgmt
Financing live
Cash to close
- Down payment
- $46,250
- Closing costs
- $5,550
- Reserves months
- —
- Total cash needed
- —
Loan-product check · same deal, 3 products live
Conventional
25% down · 7.5% · 30yr
- Down + closing
- —
- Monthly P&I
- —
- Monthly cashflow
- —
- DSCR
- —
- Eligible?
- —
Personal DTI + credit; lowest rate.
DSCR
20% down · 8.5% · 30yr
- Down + closing
- —
- Monthly P&I
- —
- Monthly cashflow
- —
- DSCR
- —
- Eligible?
- —
No personal income docs; deal must DSCR.
Hard money
10% down · 12.0% · 12mo
- Down + closing
- —
- Monthly P&I
- —
- Monthly cashflow
- —
- DSCR
- —
- Eligible?
- —
Short-term bridge; refi at stabilization.
Rent comps 40 comps
| Address | Beds | Baths | Sqft | Rent | $/sqft | DOM | Units | Dist |
|---|---|---|---|---|---|---|---|---|
| 251 Orangefair Ave Fullerton, CA | 2.0 | 1.0–2.0 | 966 | $3,916 | $4.05 | 1d | 27 | 0.46mi |
| 110 S Balcom Ave Fullerton, CA | 2.0 | 2.0 | 700 | $2,695 | $3.85 | 1d | 1 | 0.59mi |
| 124 N Princeton Ave Fullerton, CA | 3.0 | 2.0 | 1119 | $3,500 | $3.13 | 24d | 1 | 0.72mi |
| 127 W Valencia Dr Unit A Fullerton, CA | 3.0 | 2.0 | 1000 | $3,500 | $3.50 | 1d | 1 | 0.76mi |
| 130 N Lincoln Ave Fullerton, CA | 2.0 | 1.0 | 900 | $3,400 | $3.78 | 12d | 1 | 0.76mi |
| 125 W Valencia Dr Unit A Fullerton, CA | 3.0 | 1.0 | 1100 | $3,500 | $3.18 | 1d | 1 | 0.76mi |
| 229 E Commonwealth Ave Fullerton, CA | 3.0 | 1.0–3.0 | 1126 | $4,409 | $3.91 | 1d | 8 | 0.78mi |
| 325 E Amerige Ave Unit A Fullerton, CA | 3.0 | 2.0 | 1325 | $3,500 | $2.64 | 5d | 1 | 0.78mi |
| 325 E Amerige Ave Fullerton, CA | 3.0 | 2.0 | 1325 | $3,500 | $2.64 | 1d | 1 | 0.78mi |
| 1480 S Highland Ave Fullerton, CA | 2.0 | 1.0–2.0 | 792 | $3,110 | $3.92 | 24d | 4 | 0.84mi |
| 1311 S Highland Ave Fullerton, CA | 1.0–2.0 | 1.0–2.0 | 826 | $2,050 | $2.48 | 1d | 1 | 0.88mi |
| 1134 E Whiting Ave Fullerton, CA | 2.0 | 1.5 | 1157 | $3,500 | $3.03 | 7d | 1 | 0.91mi |
| 1127 N Briarwood St Anaheim, CA | 2.0 | 1.0 | 800 | $2,700 | $3.38 | 1d | 1 | 0.94mi |
| 1501 S Highland Ave Unit 1541K Fullerton, CA | 2.0 | 2.0 | 950 | $2,905 | $3.06 | 1d | 1 | 0.95mi |
| 1501 S Highland Ave Unit 1551O Fullerton, CA | 2.0 | 2.0 | 950 | $2,795 | $2.94 | 19d | 1 | 0.95mi |
| 1501 S Highland Ave Unit 1611O Fullerton, CA | 2.0 | 2.0 | 950 | $2,885 | $3.04 | 10d | 1 | 0.95mi |
| 1501 S Highland Ave Unit 1631M Fullerton, CA | 2.0 | 1.0 | 850 | $2,780 | $3.27 | 1d | 1 | 0.95mi |
| 1501 S Highland Ave Unit 1551N Fullerton, CA | 2.0 | 1.0 | 850 | $2,900 | $3.41 | 1d | 1 | 0.95mi |
| 1501 S Highland Ave Unit 1621M Fullerton, CA | 2.0 | 1.0 | 850 | $2,775 | $3.26 | 1d | 1 | 0.95mi |
| 1501 S Highland Ave Unit 1571M Fullerton, CA | 2.0 | 1.0 | 850 | $2,745 | $3.23 | 1d | 1 | 0.95mi |
| 1501 S Highland Ave Unit 1601G Fullerton, CA | 2.0 | 2.0 | 950 | $2,970 | $3.13 | 24d | 1 | 0.95mi |
| 130 E Chapman Ave Fullerton, CA | 1.0–2.0 | 1.0–2.0 | 910 | $2,644 | $2.91 | 1d | 4 | 0.99mi |
| 1096 N Ivory Palm Ln Anaheim, CA | 3.0 | 2.5 | 1406 | $4,200 | $2.99 | 1d | 1 | 0.99mi |
| 527 W Victor Ave Anaheim, CA | 3.0 | 3.0 | 1420 | $13,200 | $9.30 | 1d | 1 | 1.02mi |
| 1000 E La Palma Ave Anaheim, CA | 1.0–2.0 | 1.0–2.0 | 806 | $2,470 | $3.06 | 1d | 1 | 1.04mi |
| 141 W Wilshire Ave Fullerton, CA | 1.0–2.0 | 1.0–2.5 | 910 | $3,187 | $3.50 | 1d | 6 | 1.05mi |
| 111 S Acacia Ave Unit K Fullerton, CA | 2.0 | 1.0 | 832 | $2,370 | $2.85 | 1d | 1 | 1.09mi |
| 443 W Valencia Dr Apt B Fullerton, CA | 2.0 | 1.5 | 938 | $2,500 | $2.67 | 1d | 1 | 1.09mi |
| 1250 E La Palma Ave Anaheim, CA | 1.0–2.0 | 1.0 | 762 | $2,500 | $3.28 | 1d | 2 | 1.13mi |
| 525 W Woodcrest Ave Fullerton, CA | 2.0 | 1.0 | 800 | $2,500 | $3.12 | 18d | 1 | 1.17mi |
| 729 N Sabina St Anaheim, CA | 3.0 | 2.0 | 880 | $4,000 | $4.55 | 2d | 1 | 1.17mi |
| 1024 W Romneya Dr Anaheim, CA | 2.0–3.0 | 2.0 | 1241 | $4,795 | $3.86 | 1d | 10 | 1.24mi |
| 331 W Whiting Ave Fullerton, CA | 3.0 | 1.0 | 1490 | $2,350 | $1.58 | 10d | 1 | 1.27mi |
| 524 W Williamson Ave Apt 6 Fullerton, CA | 2.0 | 1.0 | 850 | $2,595 | $3.05 | 15d | 1 | 1.29mi |
| 1464 E La Palma Ave Anaheim, CA | 2.0 | 2.0 | 960 | $2,600 | $2.71 | 1d | 1 | 1.33mi |
| 1531 E La Palma Ave Unit F1 Anaheim, CA | 3.0 | 1.0 | 976 | $3,195 | $3.27 | 3d | 1 | 1.37mi |
| 1531 E La Palma Ave Unit F1 Anaheim, CA | 2.0 | 1.0 | 975 | $2,950 | $3.03 | 3d | 1 | 1.37mi |
| 1531 E La Palma Ave Unit F1 Anaheim, CA | 2.0 | 1.0 | 976 | $2,950 | $3.02 | 1d | 1 | 1.37mi |
| 800 N Janss St Anaheim, CA | 4.0 | 2.0 | 1450 | $4,500 | $3.10 | 1d | 1 | 1.38mi |
| 600 W Commonwealth Ave Fullerton, CA | 3.0 | 1.0–2.0 | 1002 | $4,564 | $4.55 | 1d | 18 | 1.39mi |
Listing history 9 events
-
2026-06-18days on market $185,000 Active 22 DOM
-
2026-06-17days on market $185,000 Active 21 DOM
-
2026-06-16days on market $185,000 Active 20 DOM
-
2026-06-15days on market $185,000 Active 19 DOM
-
2026-06-13days on market $185,000 Active 17 DOM
-
2026-06-13days on market $185,000 Active 16 DOM
-
2026-06-09days on market $185,000 Active 13 DOM
-
2026-06-08remarks 699-char remark
-
2026-06-08$185,000 Active 12 DOM
ⓘ Source: listings_history table (triggers on properties + properties_extension) + one-shot
backfill from property_details.listing_events for pre-trigger history.
Climate risk First Street
- Flood 1/10 Low FEMA zone X (shaded) · 0% chance over 30 yrs
- Wildfire 1/10 Low
- Heat 6/10 Major 7 d/yr ≥93°F today · 22 d/yr by 30 yrs out
- Wind 1/10 Low
- Air quality 5/10 Major 7 unhealthy d/yr today · 9 by 30 yrs out
Nearby sold comps map
Loading sold comps map…
Walkable amenities ~0.75 mi
Loading nearby amenities…
Taxation est. · year 1
- Rental income
- $38,725
- − Mortgage interest
- −$10,363
- − Property taxes
- −$2,775
- − Insurance
- −$925
- − Repairs & maintenance
- −$3,098
- − Management
- −$3,098
- − Depreciation
- −$5,382
- Taxable income
- $13,084
- Est. tax owed @ 24.0%
- −$3,140
- After-tax cash flow
- $12,111/yr
For passive investors: Depreciation is non-cash, so a rental often shows a tax loss while cash-flowing — sheltering income. Rental losses are passive: they offset passive income freely, and up to $25,000/yr can offset ordinary (W-2) income if you actively participate and your MAGI is under $100k (phasing out to $0 by $150k); unused losses carry forward. On sale, claimed depreciation is recaptured at up to 25%, and gains may owe capital-gains tax (a 1031 exchange can defer both). Figures are a year-1 estimate at your 24.0% rate — not tax advice; consult a CPA.
Schools (NCES district)
- District
- Anaheim Elementary
- NCES district ID
- 0602610
- Math proficiency
- 25% ▼ -3.00%
- Reading proficiency
- 25% ▼ -9.00%
- Median HH income
- $55,235
- Composite
- 22.56/100
- National rank
- #8078
- State rank
- #386 of 517 in CA
Livability — Anaheim
- Score
- 70/100
- State rank
- #240
- US rank
- #7861
Category grades
Schools grade is shown separately in the Schools card above.
Census & demographics
- Census place
- Anaheim, CA
- County
- Orange County · 3,096,323 people
- City population
- 361,715
- Metro
- Los Angeles-Long Beach-Anaheim, CA
- Population (ZIP)
- 60,547
- Household income
- $83,725
- Rent vs Own
- Severe rent burden
- 3604.0
Population outlook (Orange County) Hauer SSP2
- Today (2025)
- 3,477,456 people
- By 2030
- 3,613,117 · +3.9%
- By 2040
- 3,835,945 · +10.3%
- By 2050
- 3,968,736 · +14.1%
- By 2075
- 4,097,053 · +17.8%
- By 2100
- 3,903,633 · +12.3%
Race, ethnicity, and origin ACS 2023
- Neighborhood character
- Diverse neighborhood (Simpson 0.59)
- Race & ethnicity
- Hispanic / Latino 59% Two or more races 19% Asian 19% White 16% Black 4%
- Hispanic origin (detail)
- Mexican 50%
- Common ancestry
- Russian 1% Lithuanian 1%
- Foreign-born
- 41% · Canada, Vietnam, South Korea
- Languages at home
- 30% English-only · Spanish 48% Tagalog/Filipino 5% Vietnamese 5%
Political lean MEDSL · Orange
- 2024 margin
- Toss-up / Even · D 49.7% · R 47.1% · Other 3.2%
- 2008→2024 swing
- +5.2pp toward D · 2008: -2.6pp · 2024: 2.6pp
- All cycles
- 2024: D+2.6 2020: D+9.0 2016: D+7.7 2012: R+8.3 2008: R+2.6
Not yet ingested
- Civics
- —
Market trends
- HPI YoY
- ▼ -723.92%
- Current HPI
- 446.9118
- Rent YoY
- ▲ 5.13%
- Metro
- Los Angeles-Long Beach-Anaheim, CA
- State GDP YoY
- ▲ 3.21%
- F500 in state
- 116
Industry mix (Fortune 500 HQ in CA)
| Industry | F500 HQs | Revenue |
|---|---|---|
| Technology | 27 | $1,492B |
|
||
| Financial Services | 3 | $174B |
|
||
| Retail | 3 | $44B |
|
||
| Insurance | 3 | $26B |
|
||
| Media / Entertainment | 2 | $115B |
|
||
| Pharmaceuticals / Biotech | 2 | $62B |
|
||
Price history
+2.8% since first listed4 events — show timeline
- 2026-06-08 Relisted — CRMLS
- 2025-11-24 Price Changed $185,000 CRMLS
- 2025-11-24 Listing Removed — CRMLS
- 2025-11-12 Listed $180,000 CRMLS
Cash-flow waterfall
monthlySold comps — $/sqft
last 12 mo · ≤1 miLoading sold comps…