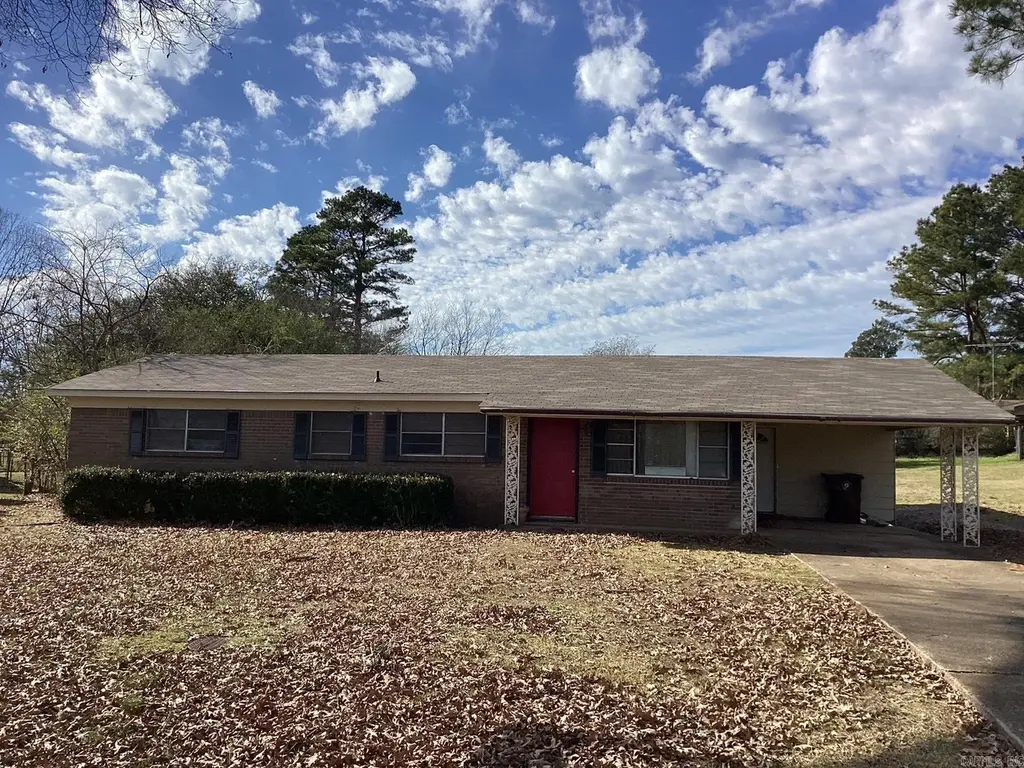
1208 Cale Rd · Prescott, AR
Flood risk 1/10 · Minimal
- FEMA flood zone
- —
- Chance of flooding over 30 yrs
- 0.0%
- Est. flood insurance / yr
- —
Fire risk 5/10 · Moderate
- Est. fire insurance / yr
- $1,499 – $2,785
Heat risk 6/10 · Moderate
- Hot days now (above 111°F)
- 7 days/yr
- Hot days in 30 yrs
- 21 days/yr
Wind risk 4/10 · Minor
- Chance of severe wind over 30 yrs
- 17.0%
Air-quality risk 1/10 · Minimal
- Unhealthy air days now
- 0 days/yr
- Unhealthy air days in 30 yrs
- 0 days/yr
Risk factors via First Street. Map © Google.
Why this score? — see what drove the B+ grade
The composite is a weighted blend of 9 inputs, each scored 0–100. Each bar is that input's sub-score; the figure is the points it added to the 100-point composite (weight × sub-score).
- Cash flow +30.0/30.0
- ARV discount +14.4/15.0
- DSCR +10.0/10.0
- 1% rule +8.4/10.0
- Appreciation +3.6/10.0
- Livability +3.3/5.0
- Rent growth +2.5/5.0
- Condition / age +2.5/5.0
- Schools +1.4/10.0
$81,700
🖨 Deal sheet (PDF) 📄 Offer letter ✓ Due diligence
Listing remarks MLS
Priced to sell at $84,500, this 3-bedroom, 1.5-bath home sits on a . 41-acre lot in Prescott, AR and is ideal for investors, flippers, or buyers looking to renovate and build equity. The spacious lot offers room to expand, garden, or simply enjoy extra privacy. This property is a blank canvas ready for your vision.
Key facts
- .41-acre lot
- Blank canvas
- Extra privacy
Tags
Neighborhood map
What this means for you Summary
Snapshot
- This is a 3-bed/1.5-bath single-family listed at $82k.
Deal economics
- At list price, monthly cash flow is $342 ($4k/yr) — positive.
- The deal already cash-flows at list — no discount required.
- Meets the 1% rule at list price ($1k rent vs $82k).
- Recommended offer: $72k (12.0% below list) — sets the bar for market timing.
Location & tenants
- Location reads 66/100 on livability (#130 in AR) — a middle-class / working-renter tenant base. Strengths: cost of living A+, health & safety A+, housing A; Watch: amenities F, commute F, employment D-.
- Prescott School District (town): math 16% / reading 19% proficiency, ranked #218 of 238 in AR (top 92%) — low school quality limits family demand, transient renter base, plan for 1-2y turnover; 69% free/reduced lunch — lower-income household profile, screen leases tightly.
- Zoned schools: Prescott Elementary School (math 27% / reading 17%, grade F, #365 of 454 statewide, top 82%, 378 students, 100% FRL); Prescott Junior High School (math 13% / reading 18%, grade F, #184 of 201 statewide, top 92%, 249 students, 100% FRL); Prescott High School (math 12% / reading 22%, grade F, #255 of 292 statewide, top 89%, 311 students, 100% FRL) — zoned schools average 100% FRL vs 69% district-wide (31 pts higher); higher-poverty schools than district average — tighter screening recommended.
- Market conditions: 20 active listings in the ZIP.
Forward outlook
- Local home prices are declining (-2.7%/yr); year-one equity from $565 of loan paydown is wiped out by about $2k of value loss. Plan a longer hold.
- Nevada County population projected at -24% by 2050 — secular population decline; favor cash flow + early exit over multi-decade hold.
- At projected returns (-2.7% appreciation + 3.0% rent growth), your $23k cash investment doubles in ~7 years — after that, you're playing with house money.
Negotiation context
- It's been on market 154 days — a 12% lower offer ($72k) is reasonable based on typical stale-listing flexibility.
- Current owner paid $17k; list at $82k implies a 381% gain — meaningful room to come down on a strong offer.
Risks & watch-outs
- Climate carrying-cost: moderate wildfire risk; extreme-heat days projected 7→21/yr by 2055 (HVAC capex compounding) — expect insurance premiums to compound above CPI over the hold.
Questions for the listing agent
- It's been on market 154 days. Have you received any prior offers? Is the seller open to a 12% concession, seller financing, or rate buy-down credit?
- Built in 1967 — when were the roof, HVAC, electrical panel, plumbing, and water heater last replaced?
- Why hasn't it sold? Are there any deal-killer items the seller is aware of (foundation, flood, title, zoning, code violations)?
- Is there a deadline driving the sale (1031 exchange, divorce, estate, relocation)? That informs how much negotiation room exists.
- Schools are F-rated, which usually means shorter tenancies and higher turnover. Who's the typical renter profile here, and what's been the actual vacancy rate?
- What's the average days-on-market for RENTAL listings here right now (not sales)? A rising rental-DOM trend means longer vacancies and softer asking-rent achievability than the comps imply.
- What's the recent tenant-quality profile in this submarket — average credit score on applications, eviction rate, late-payment / NSF rate, and stable-employment percentage? A property-management company in the area should have these aggregated.
- How much new for-sale + rental construction is in the pipeline within 1–3 miles? Heavy new supply typically softens prices + rents 12–24 months out; constrained supply supports both.
Investment metrics
- 1% rule
- 1.34% ✓
- Cap rate
- 11.32%
- Cash-on-cash
- 17.96%
- DSCR
- 1.80
- GRM
- 6.2
CMA / ARV
- ARV (median comp)
- $96,540
- List price
- $81,700
- Delta
- -15.37%
- Verdict
- UNDERPRICED
- Comps
- 10 within 1.0 mi
Show comp detail 3 sales within ~0.75 mi
| Address | Dist | Beds/Ba | Sqft | Sold | Price | $/sf | Match |
|---|---|---|---|---|---|---|---|
| 100 Elizabeth St | 0.10mi | 3/2.0 | 1,613 (+14%) | 11mo | $110,000 | $68 | 60 |
| 860 Ash St | 0.49mi | 3/2.0 | 1,320 (-6%) | 10mo | $30,000 | $23 | 56 |
| 625 E Main | 0.71mi | 3/1.5 | 1,362 (-4%) | 11mo | $100,000 | $73 | 52 |
Match score weights: distance 35% · size 25% · config 20% · recency 20%. Top-matched comps best support the ARV.
Projected returns pro-forma
-2.71% appreciation · 3.0% rent growth · sell at horizon
- IRR
- 10.4%
- Equity multiple
- 1.42×
- Total profit
- $9,549
- Equity at exit
- $13,234
- IRR
- 19.0%
- Equity multiple
- 2.63×
- Total profit
- $37,210
- Equity at exit
- $8,885
Cash invested: $22,876 (down + closing). Projections, not guarantees.
Landlord ↔ Tenant lean methodology
- Overall (STATE)
- 92 Strongly Landlord-Friendly
- State Arkansas
- 92 Strongly Landlord-Friendly · R+14
- County
- — inherits STATE
- City
- — inherits STATE
ZIP-level market 71857
- Home prices YoY
- -1.5%
- Active inventory
- 20
- Price-to-rent
- 6.2×
Monthly cashflow live
- Estimated rent
- $1,095 medium interval (Pro) →
- Mortgage (P&I)
- −$428
- Tax from tax record
- −$60 /mo · $726/yr
- Insurance
- −$34
- HOA
- −$0
- Vacancy / Maint / Mgmt
- −$230
- Net cashflow
- $342
Break-even live
Sensitivity live
| Price | -10% $389 | -5% $366 | +0% $342 | +5% $319 | +10% $296 |
|---|---|---|---|---|---|
| Rent | -10% $256 | -5% $299 | +0% $342 | +5% $386 | +10% $429 |
| Rate | -1.0pp $384 | -0.5pp $363 | base $342 | +0.5pp $321 | +1.0pp $300 |
UW: 25.0% down · 7.5% · 30yr · 1.5% tax · 5.0% vac · 8.0% maint · 8.0% mgmt
Financing live
Cash to close
- Down payment
- $20,425
- Closing costs
- $2,451
- Reserves months
- —
- Total cash needed
- —
Loan-product check · same deal, 3 products live
Conventional
25% down · 7.5% · 30yr
- Down + closing
- —
- Monthly P&I
- —
- Monthly cashflow
- —
- DSCR
- —
- Eligible?
- —
Personal DTI + credit; lowest rate.
DSCR
20% down · 8.5% · 30yr
- Down + closing
- —
- Monthly P&I
- —
- Monthly cashflow
- —
- DSCR
- —
- Eligible?
- —
No personal income docs; deal must DSCR.
Hard money
10% down · 12.0% · 12mo
- Down + closing
- —
- Monthly P&I
- —
- Monthly cashflow
- —
- DSCR
- —
- Eligible?
- —
Short-term bridge; refi at stabilization.
Listing history 20 events
-
2026-06-21days on market $81,700 Active 154 DOM
-
2026-06-19days on market $81,700 Active 152 DOM
-
2026-06-18days on market $81,700 Active 151 DOM
-
2026-06-17days on market $81,700 Active 150 DOM
-
2026-06-16days on market $81,700 Active 149 DOM
-
2026-06-15days on market $81,700 Active 148 DOM
-
2026-06-14days on market $81,700 Active 146 DOM
-
2026-06-12days on market $81,700 Active 145 DOM
-
2026-06-09days on market $81,700 Active 142 DOM
-
2026-06-08days on market $81,700 Active 141 DOM
-
2026-06-07days on market $81,700 Active 140 DOM
-
2026-06-07days on market $81,700 Active 139 DOM
-
2026-06-04days on market $81,700 Active 136 DOM
-
2026-06-02days on market $81,700 Active 135 DOM
-
2026-06-01days on market $81,700 Active 134 DOM
-
2026-05-31days on market $81,700 Active 133 DOM
-
2026-05-31days on market $81,700 Active 132 DOM
-
2026-04-07price $81,700 316-char remark
Show marketing remark (316 chars)
Priced to sell at $84,500, this 3-bedroom, 1.5-bath home sits on a . 41-acre lot in Prescott, AR and is ideal for investors, flippers, or buyers looking to renovate and build equity. The spacious lot offers room to expand, garden, or simply enjoy extra privacy. This property is a blank canvas ready for your vision.
-
2026-01-18$84,500 New Listing 316-char remark
Show marketing remark (316 chars)
Priced to sell at $84,500, this 3-bedroom, 1.5-bath home sits on a . 41-acre lot in Prescott, AR and is ideal for investors, flippers, or buyers looking to renovate and build equity. The spacious lot offers room to expand, garden, or simply enjoy extra privacy. This property is a blank canvas ready for your vision.
-
2015-01-30soldstatus $17,000
ⓘ Source: listings_history table (triggers on properties + properties_extension) + one-shot
backfill from property_details.listing_events for pre-trigger history.
Tax reassessment forecast AR · Resets to sale price
- Current annual tax
- $726 · $60/mo
- Projected year-2 tax
- $726 · $60/mo
- Expected delta
- $0/yr ($0/mo · 0.0%)
ⓘ Screening estimate from a state-policy table — verify with the county assessor before closing.
Climate risk First Street
- Flood 1/10 Low 0% chance over 30 yrs
- Wildfire 5/10 Major
- Heat 6/10 Major 7 d/yr ≥111°F today · 21 d/yr by 30 yrs out
- Wind 4/10 Moderate 17% chance of damaging wind over 30 yrs
- Air quality 1/10 Low 0 unhealthy d/yr today · 0 by 30 yrs out
Nearby sold comps map
Loading sold comps map…
Walkable amenities ~0.75 mi
Loading nearby amenities…
Taxation est. · year 1
- Rental income
- $13,145
- − Mortgage interest
- −$4,576
- − Property taxes
- −$726
- − Insurance
- −$408
- − Repairs & maintenance
- −$1,052
- − Management
- −$1,052
- − Depreciation
- −$2,377
- Taxable income
- $2,954
- Est. tax owed @ 24.0%
- −$709
- After-tax cash flow
- $3,400/yr
For passive investors: Depreciation is non-cash, so a rental often shows a tax loss while cash-flowing — sheltering income. Rental losses are passive: they offset passive income freely, and up to $25,000/yr can offset ordinary (W-2) income if you actively participate and your MAGI is under $100k (phasing out to $0 by $150k); unused losses carry forward. On sale, claimed depreciation is recaptured at up to 25%, and gains may owe capital-gains tax (a 1031 exchange can defer both). Figures are a year-1 estimate at your 24.0% rate — not tax advice; consult a CPA.
Schools (NCES district)
- District
- Prescott School District
- NCES district ID
- 0511820
- Math proficiency
- 16% ▼ -15.00%
- Reading proficiency
- 19% ▼ -11.00%
- Median HH income
- $34,757
- Composite
- 14.38/100
- National rank
- #9435
- State rank
- #218 of 238 in AR
Livability — Prescott
- Score
- 66/100
- State rank
- #130
- US rank
- #12044
Category grades
Schools grade is shown separately in the Schools card above.
Census & demographics
- Census place
- Prescott, AR
- Population (ZIP)
- 5,569
Population outlook (Nevada County) Hauer SSP2
- Today (2025)
- 7,890 people
- By 2030
- 7,473 · -5.3%
- By 2040
- 6,681 · -15.3%
- By 2050
- 6,034 · -23.5%
- By 2075
- 5,068 · -35.8%
- By 2100
- 4,689 · -40.6%
Race, ethnicity, and origin ACS 2023
- Neighborhood character
- Majority White (61%)
- Race & ethnicity
- White 61% Black 27% Hispanic / Latino 10% Two or more races 2%
- Hispanic origin (detail)
- Mexican 7%
- Common ancestry
- Hungarian 1% Serbian 1% Lithuanian 1%
- Foreign-born
- 0%
- Languages at home
- 93% English-only · Spanish 7%
Political lean MEDSL · Nevada
- 2024 margin
- Solid R (+39.7) · D 29.2% · R 68.9% · Other 1.9%
- 2008→2024 swing
- -23.5pp toward R · 2008: -16.2pp · 2024: -39.7pp
- All cycles
- 2024: R+39.7 2020: R+31.5 2016: R+26.1 2012: R+20.1 2008: R+16.2
Not yet ingested
- Civics
- —
Market trends
- HPI YoY
- ▼ -2.71%
- Current HPI
- 175.9236
- Rent YoY
- —
- Metro
- —
- State GDP YoY
- ▲ 3.80%
- F500 in state
- 10
Industry mix (Fortune 500 HQ in AR)
| Industry | F500 HQs | Revenue |
|---|---|---|
| Retail | 1 | $681B |
|
||
| Food / Agriculture | 1 | $53B |
|
||
| Retail / Energy | 1 | $22B |
|
||
| Transportation / Logistics | 1 | $12B |
|
||
| Energy | 1 | $4B |
|
||
Price history
+380.6% since first listed3 events — show timeline
- 2026-04-07 Price Changed $81,700 CARMLS
- 2026-01-18 Listed $84,500 CARMLS
- 2015-01-30 Sold (Public Records) $17,000 Public Records
Property tax history
+3.1%/yrLatest (2025): $726 · +9.1% YoY. Source: county tax records.
Cash-flow waterfall
monthlySold comps — $/sqft
last 12 mo · ≤1 miLoading sold comps…