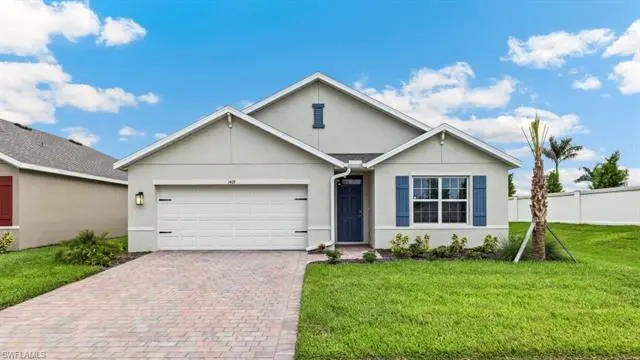
1692 Poinsettia Ave · Lehigh Acres, FL
Flood risk 1/10 · Minimal
- FEMA flood zone
- X (unshaded)
- Chance of flooding over 30 yrs
- 0.0%
- Est. flood insurance / yr
- $507 – $1,088
Fire risk 2/10 · Minimal
- Est. fire insurance / yr
- $947 – $1,759
Heat risk 9/10 · Severe
- Hot days now (above 108°F)
- 7 days/yr
- Hot days in 30 yrs
- 28 days/yr
Wind risk 10/10 · Severe
- Chance of severe wind over 30 yrs
- 99.0%
Air-quality risk 2/10 · Minimal
- Unhealthy air days now
- 2 days/yr
- Unhealthy air days in 30 yrs
- 2 days/yr
Risk factors via First Street. Map © Google.
Why this score? — see what drove the F grade
The composite is a weighted blend of 9 inputs, each scored 0–100. Each bar is that input's sub-score; the figure is the points it added to the 100-point composite (weight × sub-score).
- ARV discount +7.5/15.0
- Cash flow +6.1/30.0
- Schools +4.1/10.0
- Rent growth +3.8/5.0
- Livability +3.0/5.0
- Condition / age +2.5/5.0
- 1% rule +1.4/10.0
- DSCR +0.4/10.0
- Appreciation +0.0/10.0
$343,875
🖨 Deal sheet (PDF) 📄 Offer letter ✓ Due diligence
Listing remarks MLS
This luxurious reinforced concrete block NEW construction, 4-Bedroom, 2-Bathroom, 2-Car Garage, Cali Model, delivers all the modern amenities for comfortable living. All this, on an oversize ½ Acre Lot. The open and spacious kitchen boasts solid surface Quartz countertops and large island, perfect for entertaining, stainless-steel appliances and light shaker style white cabinets. The primary ensuite includes solid surface quartz countertops, dual vanity and a walk-in shower, additional linen closet, expansive walk-in closet and private water closet. Other features include a laundry room, with washer and dryer hook up, Ceramic tile 6"x 24" plank flooring throughout and the latest in Smart Home technology. Plus, this property also offers Impact resistance windows and doors, to protect you from hurricane winds. Your homesite comes fully sodded with automatic sprinkler system. Enjoy your all-New Home warranties. These homes move quickly, so don't miss out!
Key facts
- Oversize lot
- Dual vanity
- Primary ensuite
Tags
Property features AI
Finance
- Other: Lot size approximately 0.50 acre; Lot is regular shape with paved road access; Irrigation from well; See remarks for restrictions; Property type: residential, single unit
- HOA & community: No HOA maintenance; Community is non-gated; Community amenities: none listed; Community/Development: Lehigh Acres
Exterior
- Parking: Attached 2-car garage; Paved driveway
- Security: Impact resistant doors and windows; Smoke detectors
- Utilities: Well water; Septic system; Cable available; Electric service for heat and cooling
- Home design: Single-family residential; One-story (ranch) design; Rear exposure faces east; New construction (2026)
- Construction: Concrete block construction; Stucco finish; Shingle roof; Built in 2026; Surveyed lot
- Exterior features: Room for pool; Automatic sprinkler system; Impact resistant windows and doors; Stucco exterior; Shingle roof
Interior
- Kitchen: Dishwasher; Microwave; Range; Refrigerator/ice maker; Self-cleaning oven; Walk-in pantry
- Bedrooms: 4 bedrooms; Split bedroom arrangement
- Flooring: Tile
- Bathrooms: 2 full bathrooms; Master bathroom has dual sinks and a shower
- Heating & cooling: Central electric heat; Central electric cooling
- Interior features: Cable prewire; Smoke detectors; Walk-in closet; Walk-in pantry; Dining adjacent to living area; Open porch/lanai; Auto garage door; Home automation; Water treatment system (owned); Unfurnished; Great room floor plan; Split bedroom layout; 9 total rooms
- Laundry & utility: Laundry in residence; Washer/dryer hookup
Neighborhood map
What this means for you Summary
Snapshot
- This is a 4-bed/2.0-bath land listed at $344k.
Deal economics
- At list price, monthly cash flow is $-645 ($-8k/yr) — negative.
- To cash-flow at today's rent, offer at most $251k (27.1% below list).
- To meet the 1% rule (rent ≥ 1% of price), the offer needs to be $219k (36.3% below list).
- Recommended offer: $219k (36.3% below list) — sets the bar for 1% rule.
Location & tenants
- Location reads 59/100 on livability (#826 in FL) — a working-class tenant base; expect higher turnover. Strengths: cost of living A+, housing A+; Watch: crime C-, employment D+, schools D-.
- Lee (suburban): math 47% / reading 50% proficiency, ranked #42 of 73 in FL (top 58%) — families likely to look elsewhere, expect single-tenant / working-renter base with shorter leases.
- Market conditions: Rents rising fast (+5.3%/yr); 1611 active listings in the ZIP; 14 comparable units currently listed for rent nearby; rentals at typical pace (median 24d on market — plan ~3-4 weeks tenant-placement turnaround); 15,411 units permitted in Lee County in 2024 (4,686 in 5+ unit buildings).
- This rent runs 36% of the median local income ($74k/yr) — at the standard rent-burdened threshold; future hikes will face affordability resistance.
Forward outlook
- Local home prices are declining (-3.0%/yr); year-one equity from $2k of loan paydown is wiped out by about $10k of value loss. Plan a longer hold.
- Lee County population projected at +44% by 2050 — long-run rental-demand tailwind backs the buy-and-hold thesis.
Negotiation context
- It's been on market 33 days — a 3% lower offer ($334k) is reasonable based on typical stale-listing flexibility.
- 2 sale attempts with the ask held roughly flat each time — persistent listings suggest the price (not the market) is what's stuck; bring a comps-based counter.
Risks & watch-outs
- Climate carrying-cost: severe wind risk, 99% chance of damaging wind over 30y; extreme-heat days projected 7→28/yr by 2055 (HVAC capex compounding) — expect insurance premiums to compound above CPI over the hold.
Questions for the listing agent
- What do current leases actually rent for vs. the listed asking? Can we see a recent rent roll and the last 12 months of T-12 income?
- It's been on market 33 days. Have you received any prior offers? Is the seller open to a 36% concession, seller financing, or rate buy-down credit?
- Is there a deadline driving the sale (1031 exchange, divorce, estate, relocation)? That informs how much negotiation room exists.
- Schools are D-rated, which usually means shorter tenancies and higher turnover. Who's the typical renter profile here, and what's been the actual vacancy rate?
- The area grade is low — what's the realistic commute time and amenity access for the typical tenant pool here? Any planned neighborhood developments (good or bad) we should know about?
- What's the average days-on-market for RENTAL listings here right now (not sales)? A rising rental-DOM trend means longer vacancies and softer asking-rent achievability than the comps imply.
- What's the recent tenant-quality profile in this submarket — average credit score on applications, eviction rate, late-payment / NSF rate, and stable-employment percentage? A property-management company in the area should have these aggregated.
- How much new for-sale + rental construction is in the pipeline within 1–3 miles? Heavy new supply typically softens prices + rents 12–24 months out; constrained supply supports both.
Investment metrics
- 1% rule
- 0.64% ✗
- Cap rate
- 4.04%
- Cash-on-cash
- -8.04%
- DSCR
- 0.64
- GRM
- 13.1
CMA / ARV
No comps found within radius.
Projected returns pro-forma
-3.0% appreciation · 5.33% rent growth · sell at horizon
- IRR
- -27.9%
- Equity multiple
- 0.05×
- Total profit
- $-91,511
- Equity at exit
- $51,273
- IRR
- -19.6%
- Equity multiple
- -0.14×
- Total profit
- $-109,818
- Equity at exit
- $29,732
Cash invested: $96,285 (down + closing). Projections, not guarantees.
Landlord ↔ Tenant lean methodology
- Overall (STATE)
- 87 Strongly Landlord-Friendly
- State Florida
- 87 Strongly Landlord-Friendly · R+3
- County
- — inherits STATE
- City
- — inherits STATE
ZIP-level market 33972
- Home prices YoY
- -13.6%
- Rents YoY
- 5.3%
- Active inventory
- 1611
- Price-to-rent
- 13.1×
Monthly cashflow live
- Estimated rent
- $2,192 high interval (Pro) →
- Mortgage (P&I)
- −$1,803
- Tax est. 1.5%
- −$430 /mo · $5,158/yr
- Insurance
- −$143
- HOA
- −$0
- Vacancy / Maint / Mgmt
- −$460
- Net cashflow
- $-645
Break-even live
Sensitivity live
| Price | -10% $-407 | -5% $-526 | +0% $-645 | +5% $-764 | +10% $-883 |
|---|---|---|---|---|---|
| Rent | -10% $-818 | -5% $-732 | +0% $-645 | +5% $-558 | +10% $-472 |
| Rate | -1.0pp $-472 | -0.5pp $-558 | base $-645 | +0.5pp $-734 | +1.0pp $-825 |
UW: 25.0% down · 7.5% · 30yr · 1.5% tax · 5.0% vac · 8.0% maint · 8.0% mgmt
Financing live
Cash to close
- Down payment
- $85,969
- Closing costs
- $10,316
- Reserves months
- —
- Total cash needed
- —
Loan-product check · same deal, 3 products live
Conventional
25% down · 7.5% · 30yr
- Down + closing
- —
- Monthly P&I
- —
- Monthly cashflow
- —
- DSCR
- —
- Eligible?
- —
Personal DTI + credit; lowest rate.
DSCR
20% down · 8.5% · 30yr
- Down + closing
- —
- Monthly P&I
- —
- Monthly cashflow
- —
- DSCR
- —
- Eligible?
- —
No personal income docs; deal must DSCR.
Hard money
10% down · 12.0% · 12mo
- Down + closing
- —
- Monthly P&I
- —
- Monthly cashflow
- —
- DSCR
- —
- Eligible?
- —
Short-term bridge; refi at stabilization.
Rent comps 14 comps
| Address | Beds | Baths | Sqft | Rent | $/sqft | DOM | Units | Dist |
|---|---|---|---|---|---|---|---|---|
| 414 Willowbrook Dr Lehigh Acres, FL | 4.0 | 2.0 | 1750 | $2,246 | $1.28 | 3d | 1 | 0.86mi |
| 1407 8th Ave Lehigh Acres, FL | 3.0 | 2.5 | 1892 | $2,300 | $1.22 | 24d | 1 | 0.96mi |
| 503 E 13th St Lehigh Acres, FL | 3.0 | 2.0 | 1248 | $2,300 | $1.84 | 24d | 1 | 1.06mi |
| 805 E 13th St Lehigh Acres, FL | 3.0 | 2.0 | 1407 | $1,795 | $1.28 | 3d | 1 | 1.22mi |
| 1938 Laverna Ave Lehigh Acres, FL | 3.0 | 3.0 | 1900 | $1,700 | $0.89 | 15d | 1 | 1.24mi |
| 1940 Laverna Ave Lehigh Acres, FL | 3.0 | 3.0 | 1900 | $1,800 | $0.95 | 24d | 1 | 1.24mi |
| 301 E 12th St Lehigh Acres, FL | 3.0 | 2.0 | 1305 | $1,700 | $1.30 | 24d | 1 | 1.25mi |
| 460 Westchester Dr Lehigh Acres, FL | 3.0 | 2.0 | 1615 | $2,000 | $1.24 | 24d | 1 | 1.28mi |
| 1503 W 17th St Lehigh Acres, FL | 3.0 | 2.0 | 1356 | $2,300 | $1.70 | 24d | 1 | 1.29mi |
| 650 Wentworth Dr Lehigh Acres, FL | 3.0 | 2.0 | 1389 | $1,750 | $1.26 | 3d | 1 | 1.31mi |
| 1119 Clayton Ave Lehigh Acres, FL | 5.0 | 2.0 | 2196 | $2,405 | $1.10 | 2d | 1 | 1.32mi |
| 414 E 12th St Lehigh Acres, FL | 3.0 | 2.0 | 1225 | $1,500 | $1.22 | 24d | 1 | 1.33mi |
| 1912 Tanager Ave Lehigh Acres, FL | 4.0 | 2.5 | 2054 | $1,995 | $0.97 | 3d | 1 | 1.38mi |
| 1006 W 12th St Unit B Lehigh Acres, FL | 3.0 | 2.0 | 1400 | $1,800 | $1.29 | 24d | 1 | 1.49mi |
Listing history 7 events
-
2026-04-24$343,875 Active 983-char remark
Show marketing remark (983 chars)
This luxurious reinforced concrete block NEW construction, 4-Bedroom, 2-Bathroom, 2-Car Garage, Cali Model, delivers all the modern amenities for comfortable living. All this, on an oversize ½ Acre Lot. The open and spacious kitchen boasts solid surface Quartz countertops and large island, perfect for entertaining, stainless-steel appliances and light shaker style white cabinets. The primary ensuite includes solid surface quartz countertops, dual vanity and a walk-in shower, additional linen closet, expansive walk-in closet and private water closet. Other features include a laundry room, with washer and dryer hook up, Ceramic tile 6"x 24" plank flooring throughout and the latest in Smart Home technology. Plus, this property also offers Impact resistance windows and doors, to protect you from hurricane winds. Your homesite comes fully sodded with automatic sprinkler system. Enjoy your all-New Home warranties. These homes move quickly, so don't miss out!
-
2026-04-23$343,875 Active
-
2026-01-16soldstatus $343,000
-
2022-05-26soldstatus $471,400
-
2005-05-13soldstatus $52,900
-
2005-03-04soldstatus $25,000
-
2001-07-17soldstatus $184,000
ⓘ Source: listings_history table (triggers on properties + properties_extension) + one-shot
backfill from property_details.listing_events for pre-trigger history.
Climate risk First Street
- Flood 1/10 Low FEMA zone X (unshaded) · 0% chance over 30 yrs
- Wildfire 2/10 Low
- Heat 9/10 Extreme 7 d/yr ≥108°F today · 28 d/yr by 30 yrs out
- Wind 10/10 Extreme 99% chance of damaging wind over 30 yrs
- Air quality 2/10 Low 2 unhealthy d/yr today · 2 by 30 yrs out
Nearby sold comps map
Loading sold comps map…
Walkable amenities ~0.75 mi
Loading nearby amenities…
Taxation est. · year 1
- Rental income
- $26,301
- − Mortgage interest
- −$19,262
- − Property taxes
- −$5,158
- − Insurance
- −$1,719
- − Repairs & maintenance
- −$2,104
- − Management
- −$2,104
- − Depreciation
- −$10,004
- Taxable loss
- −$14,051
- Est. tax savings @ 24.0%
- +$3,372
- After-tax cash flow
- $-4,368/yr
For passive investors: Depreciation is non-cash, so a rental often shows a tax loss while cash-flowing — sheltering income. Rental losses are passive: they offset passive income freely, and up to $25,000/yr can offset ordinary (W-2) income if you actively participate and your MAGI is under $100k (phasing out to $0 by $150k); unused losses carry forward. On sale, claimed depreciation is recaptured at up to 25%, and gains may owe capital-gains tax (a 1031 exchange can defer both). Figures are a year-1 estimate at your 24.0% rate — not tax advice; consult a CPA.
Schools (NCES district)
- District
- Lee
- NCES district ID
- 1201080
- Math proficiency
- 47% ▼ -11.00%
- Reading proficiency
- 50% ▼ -4.00%
- Median HH income
- $49,518
- Composite
- 41.49/100
- National rank
- #3458
- State rank
- #42 of 73 in FL
Livability — Lehigh Acres
- Score
- 59/100
- State rank
- #826
- US rank
- #20055
Category grades
Schools grade is shown separately in the Schools card above.
Census & demographics
- Census place
- Lehigh Acres, FL
- County
- Lee County · 788,662 people
- City population
- 130,638
- Metro
- Cape Coral-Fort Myers, FL
- Population (ZIP)
- 17,285
- Household income
- $73,819
- Rent vs Own
- Severe rent burden
- 190.0
Population outlook (Lee County) Hauer SSP2
- Today (2025)
- 871,946 people
- By 2030
- 955,468 · +9.6%
- By 2040
- 1,113,587 · +27.7%
- By 2050
- 1,256,891 · +44.1%
- By 2075
- 1,560,270 · +78.9%
- By 2100
- 1,726,848 · +98.0%
Race, ethnicity, and origin ACS 2023
- Neighborhood character
- Diverse neighborhood (Simpson 0.65)
- Race & ethnicity
- White 44% Hispanic / Latino 38% Two or more races 21% Black 13%
- Hispanic origin (detail)
- Mexican 8% Puerto Rican 7% Cuban 18%
- Common ancestry
- Hispanic 6% Italian 2% Romanian 2%
- Foreign-born
- 27% · Canada, Guatemala
- Languages at home
- 61% English-only · Spanish 32% French/Haitian/Cajun 4% Other Indo-European 1%
Political lean MEDSL · Lee
- 2024 margin
- Strong R (+28.4) · D 35.5% · R 63.9%
- 2008→2024 swing
- -18.0pp toward R · 2008: -10.4pp · 2024: -28.4pp
- All cycles
- 2024: R+28.4 2020: R+19.2 2016: R+20.4 2012: R+16.6 2008: R+10.4
Not yet ingested
- Civics
- —
Market trends
- HPI YoY
- ▼ -53.97%
- Current HPI
- 343.484
- Rent YoY
- ▲ 5.33%
- Metro
- Cape Coral-Fort Myers, FL
- State GDP YoY
- ▲ 3.28%
- F500 in state
- 36
Industry mix (Fortune 500 HQ in FL)
| Industry | F500 HQs | Revenue |
|---|---|---|
| Industrial Technology | 2 | $29B |
|
||
| Insurance | 2 | $17B |
|
||
| Retail | 1 | $60B |
|
||
| Technology Distribution | 1 | $58B |
|
||
| Homebuilding | 1 | $35B |
|
||
| Technology Manufacturing | 1 | $35B |
|
||
Price history
+86.9% since first listed7 events — show timeline
- 2026-04-24 Listed $343,875 Zillow
- 2026-04-23 Listed $343,875 NAPLESMLS
- 2026-01-16 Sold (Public Records) $343,000 Public Records
- 2022-05-26 Sold (Public Records) $471,400 Public Records
- 2005-05-13 Sold (Public Records) $52,900 Public Records
- 2005-03-04 Sold (Public Records) $25,000 Public Records
- 2001-07-17 Sold (Public Records) $184,000 Public Records
Property tax history
+16.0%/yrLatest (2025): $523 · +9.5% YoY. Source: county tax records.
Cash-flow waterfall
monthlySold comps — $/sqft
last 12 mo · ≤1 miLoading sold comps…