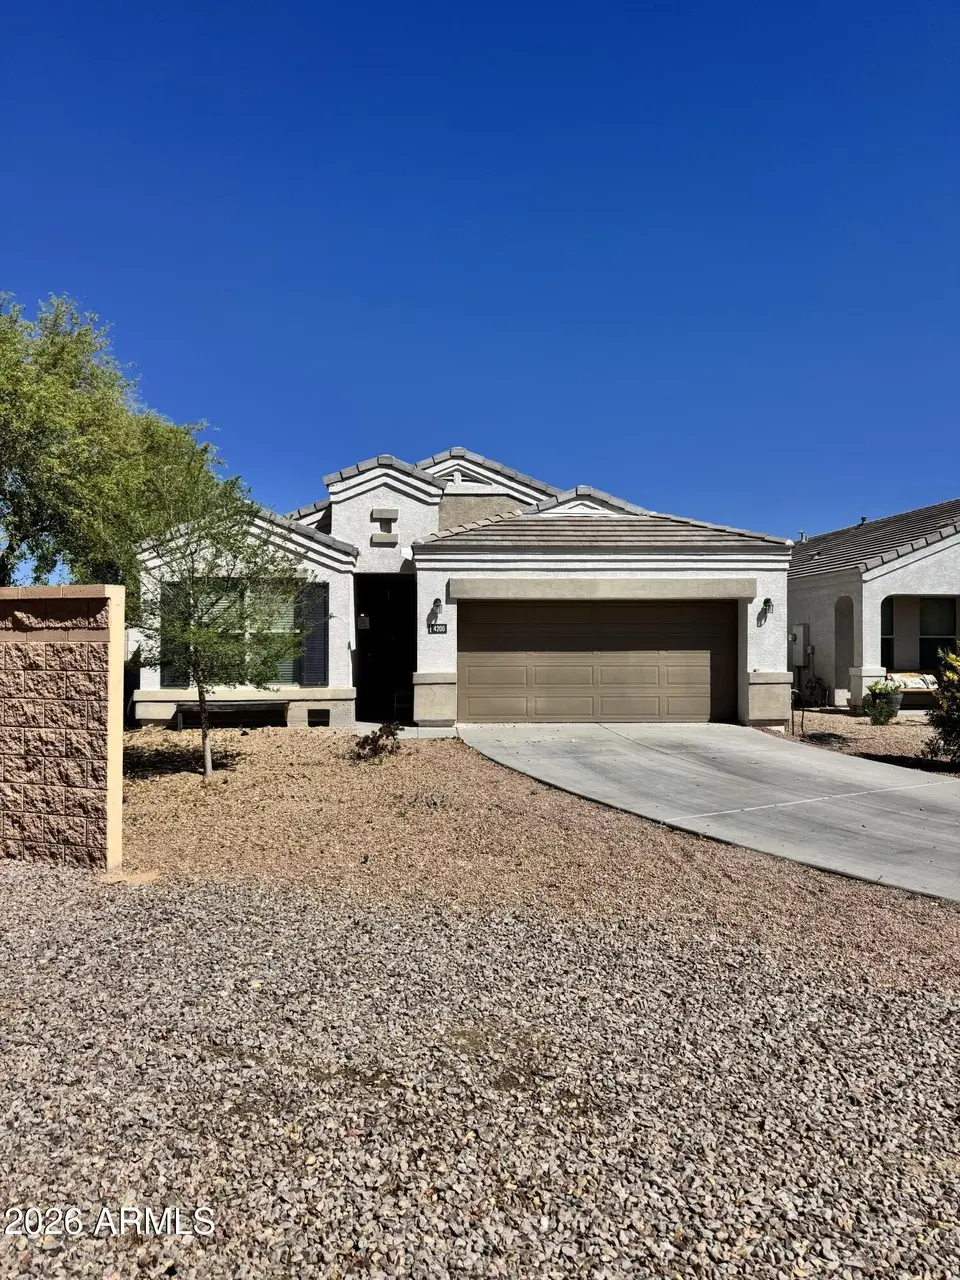
4200 W Alabama Ln · San Tan Valley, AZ
Flood risk 1/10 · Minimal
- FEMA flood zone
- X (unshaded)
- Chance of flooding over 30 yrs
- 0.0%
- Est. flood insurance / yr
- $507 – $1,088
Fire risk 6/10 · Moderate
- Est. fire insurance / yr
- $610 – $1,132
Heat risk 9/10 · Severe
- Hot days now (above 111°F)
- 7 days/yr
- Hot days in 30 yrs
- 19 days/yr
Wind risk 1/10 · Minimal
- Chance of severe wind over 30 yrs
- —
Air-quality risk 2/10 · Minimal
- Unhealthy air days now
- 1 days/yr
- Unhealthy air days in 30 yrs
- 1 days/yr
Risk factors via First Street. Map © Google.
Why this score? — see what drove the D- grade
The composite is a weighted blend of 9 inputs, each scored 0–100. Each bar is that input's sub-score; the figure is the points it added to the 100-point composite (weight × sub-score).
- ARV discount +12.4/15.0
- Appreciation +10.0/10.0
- Cash flow +5.7/30.0
- Livability +2.7/5.0
- Rent growth +2.5/5.0
- Condition / age +2.5/5.0
- Schools +1.8/10.0
- 1% rule +0.4/10.0
- DSCR +0.1/10.0
$367,000
🖨 Deal sheet (PDF) 📄 Offer letter ✓ Due diligence
Listing remarks MLS
Fully upgraded, this popular DR Horton Sparrow model offers 4 bedrooms, 2 baths, north/ south facing with mountain views. The home features granite countertops, sleek black cabinetry, and matching black appliances. Meticulously maintained and low maintenance, it's perfect for first-time buyers, down sizers, or investors. Located in San Tan Heights with access to a pool, rec center, gym, and parks, just minutes from San Tan Mountain Regional Park for hiking and outdoor adventure.
Key facts
- 5,760 sq ft lot
- 2 garage spots
- Community pool
Neighborhood map
What this means for you Summary
Snapshot
- This is a 4-bed/2.0-bath single-family listed at $367k.
Deal economics
- At list price, monthly cash flow is $-743 ($-9k/yr) — negative.
- To cash-flow at today's rent, offer at most $236k (35.8% below list).
- To meet the 1% rule (rent ≥ 1% of price), the offer needs to be $198k (46.1% below list).
- Recommended offer: $198k (46.1% below list) — sets the bar for 1% rule.
- Cap rate 3.9% vs local median 3.2% in San Tan Valley — meaningfully above typical; check what's discounted (condition, days-on-market, listing class) to confirm the premium yield is real.
Location & tenants
- Location reads 54/100 on livability (#282 in AZ) — a working-class tenant base; expect higher turnover. Strengths: housing A+, employment B+; Watch: crime D+, schools D, amenities F.
- Florence Unified School District (4437) (rural): math 16% / reading 24% proficiency, ranked #178 of 249 in AZ (top 72%) — low school quality limits family demand, transient renter base, plan for 1-2y turnover.
- Market conditions: 489 active listings in the ZIP; 40 comparable units currently listed for rent nearby; rentals at typical pace (median 19d on market — plan ~3-4 weeks tenant-placement turnaround); 9,504 units permitted in Pinal County in 2024 (776 in 5+ unit buildings).
Forward outlook
- In year one you build about $39k of equity ($3k loan paydown + $37k appreciation (10.0% local appreciation)).
- By year 2, paydown + projected appreciation supports a ~$63k cash-out refi (75% LTV) — recoverable capital for the next deal without selling this one.
Negotiation context
- It's been on market 89 days — a 6% lower offer ($345k) is reasonable based on typical stale-listing flexibility.
- 3 sale attempts since 2y ago with the ask held roughly flat each time — persistent listings suggest the price (not the market) is what's stuck; bring a comps-based counter.
Risks & watch-outs
- Climate carrying-cost: major wildfire risk; extreme-heat days projected 7→19/yr by 2055 (HVAC capex compounding) — expect insurance premiums to compound above CPI over the hold.
Questions for the listing agent
- What do current leases actually rent for vs. the listed asking? Can we see a recent rent roll and the last 12 months of T-12 income?
- It's been on market 89 days. Have you received any prior offers? Is the seller open to a 46% concession, seller financing, or rate buy-down credit?
- What does the HOA fee cover, when was the last increase, and are there any pending special assessments or reserve-fund shortfalls?
- Why hasn't it sold? Are there any deal-killer items the seller is aware of (foundation, flood, title, zoning, code violations)?
- Is there a deadline driving the sale (1031 exchange, divorce, estate, relocation)? That informs how much negotiation room exists.
- Schools are D-rated, which usually means shorter tenancies and higher turnover. Who's the typical renter profile here, and what's been the actual vacancy rate?
- Crime grade is D in this area — have there been break-ins, vandalism, or insurance claims at this property in the last 3 years? What carrier currently insures it and at what premium?
- The area grade is low — what's the realistic commute time and amenity access for the typical tenant pool here? Any planned neighborhood developments (good or bad) we should know about?
- What's the average days-on-market for RENTAL listings here right now (not sales)? A rising rental-DOM trend means longer vacancies and softer asking-rent achievability than the comps imply.
- What's the recent tenant-quality profile in this submarket — average credit score on applications, eviction rate, late-payment / NSF rate, and stable-employment percentage? A property-management company in the area should have these aggregated.
- How much new for-sale + rental construction is in the pipeline within 1–3 miles? Heavy new supply typically softens prices + rents 12–24 months out; constrained supply supports both.
Investment metrics
- 1% rule
- 0.54% ✗
- Cap rate
- 3.86%
- Cash-on-cash
- -8.68%
- DSCR
- 0.61
- GRM
- 15.5
CMA / ARV
- ARV (median comp)
- $412,183
- List price
- $367,000
- Delta
- -10.96%
- Verdict
- UNDERPRICED
- Comps
- 20 within 1.0 mi
Show comp detail 12 sales within ~0.75 mi
| Address | Dist | Beds/Ba | Sqft | Sold | Price | $/sf | Match |
|---|---|---|---|---|---|---|---|
| 4366 W White Canyon Rd | 0.19mi | 3/2.0 (-1) | 1,536 (-2%) | 0mo | $362,000 | $236 | 82 |
| 4528 W Crescent Rd | 0.23mi | 3/2.0 (-1) | 1,536 (-2%) | 1mo | $350,000 | $228 | 79 |
| 32945 N Ash Tree Ln | 0.24mi | 3/2.0 (-1) | 1,678 (+6%) | 2mo | $385,000 | $229 | 71 |
| 3644 W Goldmine Mountain Dr | 0.44mi | 3/2.0 (-1) | 1,551 (-2%) | 2mo | $337,000 | $217 | 70 |
| 3823 W Dancer Ln | 0.53mi | 4/2.0 | 1,521 (-4%) | 2mo | $339,000 | $223 | 68 |
| 3728 W Carlos Ln | 0.46mi | 3/2.0 (-1) | 1,504 (-5%) | 0mo | $329,000 | $219 | 66 |
| 3830 W Santa Cruz Ave | 0.46mi | 3/2.0 (-1) | 1,506 (-4%) | 2mo | $338,000 | $224 | 64 |
| 33025 N Mildred Ln | 0.17mi | 3/2.5 (-1) | 1,759 (+12%) | 2mo | $325,000 | $185 | 64 |
| 3458 W South Butte Rd | 0.52mi | 3/2.0 (-1) | 1,635 (+4%) | 2mo | $399,900 | $245 | 63 |
| 3202 W Carlos Ln | 0.70mi | 4/2.0 | 1,539 (-2%) | 1mo | $260,000 | $169 | 63 |
| 4589 W Horsenettle Dr | 0.35mi | 4/2.0 | 1,754 (+11%) | 2mo | $377,500 | $215 | 63 |
| 4547 W Foldwing Dr | 0.23mi | 3/2.0 (-1) | 1,784 (+13%) | 2mo | $379,000 | $212 | 61 |
Match score weights: distance 35% · size 25% · config 20% · recency 20%. Top-matched comps best support the ARV.
Projected returns pro-forma
10.0% appreciation · 3.0% rent growth · sell at horizon
- IRR
- 18.2%
- Equity multiple
- 2.48×
- Total profit
- $152,443
- Equity at exit
- $330,623
- IRR
- 16.9%
- Equity multiple
- 5.73×
- Total profit
- $485,913
- Equity at exit
- $713,000
Cash invested: $102,760 (down + closing). Projections, not guarantees.
Landlord ↔ Tenant lean methodology
- Overall (STATE)
- 87 Strongly Landlord-Friendly
- State Arizona
- 87 Strongly Landlord-Friendly · R+3
- County
- — inherits STATE
- City
- — inherits STATE
ZIP-level market 85144
- Home prices YoY
- 7.2%
- Active inventory
- 489
- Price-to-rent
- 15.5×
Monthly cashflow live
- Estimated rent
- $1,979 high interval (Pro) →
- Mortgage (P&I)
- −$1,925
- Tax from tax record
- −$134 /mo · $1,605/yr
- Insurance
- −$153
- HOA
- −$95
- Vacancy / Maint / Mgmt
- −$416
- Net cashflow
- $-743
Break-even live
Sensitivity live
| Price | -10% $-535 | -5% $-639 | +0% $-743 | +5% $-847 | +10% $-951 |
|---|---|---|---|---|---|
| Rent | -10% $-899 | -5% $-821 | +0% $-743 | +5% $-665 | +10% $-587 |
| Rate | -1.0pp $-558 | -0.5pp $-650 | base $-743 | +0.5pp $-838 | +1.0pp $-935 |
UW: 25.0% down · 7.5% · 30yr · 1.5% tax · 5.0% vac · 8.0% maint · 8.0% mgmt
Financing live
Cash to close
- Down payment
- $91,750
- Closing costs
- $11,010
- Reserves months
- —
- Total cash needed
- —
Loan-product check · same deal, 3 products live
Conventional
25% down · 7.5% · 30yr
- Down + closing
- —
- Monthly P&I
- —
- Monthly cashflow
- —
- DSCR
- —
- Eligible?
- —
Personal DTI + credit; lowest rate.
DSCR
20% down · 8.5% · 30yr
- Down + closing
- —
- Monthly P&I
- —
- Monthly cashflow
- —
- DSCR
- —
- Eligible?
- —
No personal income docs; deal must DSCR.
Hard money
10% down · 12.0% · 12mo
- Down + closing
- —
- Monthly P&I
- —
- Monthly cashflow
- —
- DSCR
- —
- Eligible?
- —
Short-term bridge; refi at stabilization.
Rent comps 40 comps
| Address | Beds | Baths | Sqft | Rent | $/sqft | DOM | Units | Dist |
|---|---|---|---|---|---|---|---|---|
| 3809 W Five Mile Peak Dr San Tan Valley, AZ | 3.0 | 2.0 | 1343 | $1,895 | $1.41 | 7d | 1 | 0.30mi |
| 4151 W Goldmine Mountain Dr San Tan Valley, AZ | 5.0 | 3.0 | 2248 | $2,161 | $0.96 | 0d | 1 | 0.31mi |
| 4590 W Foldwing DR Queen Creek, AZ | 4.0 | 2.0 | 1806 | $2,449 | $1.36 | 4d | 1 | 0.32mi |
| 3849 W South Butte Rd San Tan Valley, AZ | 4.0 | 2.0 | 1884 | $1,846 | $0.98 | 45d | 1 | 0.34mi |
| 33810 N Mercedes Dr San Tan Valley, AZ | 4.0 | 2.0 | 1504 | $1,925 | $1.28 | 45d | 1 | 0.35mi |
| 3854 W Carlos Ln San Tan Valley, AZ | 3.0 | 2.0 | 1527 | $1,775 | $1.16 | 0d | 1 | 0.38mi |
| 3560 W Mesquite Ave San Tan Valley, AZ | 3.0 | 2.0 | 1453 | $1,750 | $1.20 | 13d | 1 | 0.40mi |
| 3792 W Santa Cruz Ave San Tan Valley, AZ | 4.0 | 2.0 | 1852 | $1,795 | $0.97 | 45d | 1 | 0.44mi |
| 33948 N Beeblossom Trl San Tan Valley, AZ | 3.0 | 2.0 | 1348 | $1,850 | $1.37 | 18d | 1 | 0.49mi |
| 33024 N Madison Way Dr San Tan Valley, AZ | 3.0 | 2.0 | 1500 | $1,700 | $1.13 | 17d | 1 | 0.49mi |
| 4504 W Stonecrop Dr San Tan Valley, AZ | 4.0 | 2.0 | 1810 | $2,075 | $1.15 | 7d | 1 | 0.51mi |
| 33889 N Barbara Dr San Tan Valley, AZ | 4.0 | 2.0 | 1868 | $1,975 | $1.06 | 7d | 1 | 0.52mi |
| 3877 W Naomi Ln San Tan Valley, AZ | 4.0 | 2.5 | 2010 | $1,850 | $0.92 | 7d | 1 | 0.53mi |
| 33993 N Danja Dr San Tan Valley, AZ | 3.0 | 2.0 | 1998 | $2,450 | $1.23 | 45d | 1 | 0.64mi |
| 3162 W Sunshine Butte Dr San Tan Valley, AZ | 4.0 | 2.0 | 1600 | $1,850 | $1.16 | 24d | 1 | 0.64mi |
| 3194 W Yellow Peak Dr San Tan Valley, AZ | 4.0 | 2.0 | 1925 | $1,908 | $0.99 | 45d | 1 | 0.66mi |
| 3569 W Morgan Ln San Tan Valley, AZ | 4.0 | 2.0 | 1700 | $1,550 | $0.91 | 26d | 1 | 0.67mi |
| 3102 W Belle Ave San Tan Valley, AZ | 4.0 | 2.0 | 1909 | $1,900 | $1.00 | 14d | 1 | 0.78mi |
| 3102 W Belle Ave San Tan Valley, AZ | 4.0 | 2.0 | 1909 | $1,900 | $1.00 | 17d | 1 | 0.78mi |
| 2924 W Allens Peak Dr San Tan Valley, AZ | 3.0 | 2.0 | 1765 | $1,955 | $1.11 | 13d | 1 | 0.78mi |
| 2924 W Allens Peak Dr San Tan Valley, AZ | 3.0 | 2.0 | 1765 | $1,860 | $1.05 | 0d | 1 | 0.78mi |
| 3047 W Dancer Ln San Tan Valley, AZ | 3.0 | 2.0 | 1454 | $1,915 | $1.32 | 45d | 1 | 0.82mi |
| 2899 W White Canyon Rd San Tan Valley, AZ | 3.0 | 2.0 | 1981 | $1,950 | $0.98 | 4d | 1 | 0.84mi |
| 2993 W Dancer Ln San Tan Valley, AZ | 3.0 | 2.0 | 1290 | $1,700 | $1.32 | 45d | 1 | 0.85mi |
| 33856 N Cherry Creek Rd San Tan Valley, AZ | 3.0 | 2.0 | 1928 | $1,850 | $0.96 | 45d | 1 | 0.87mi |
| 33897 N Wash View Rd San Tan Valley, AZ | 3.0 | 2.0 | 1721 | $1,980 | $1.15 | 4d | 1 | 0.88mi |
| 2699 W Camp River Rd San Tan Valley, AZ | 3.0 | 2.0 | 1766 | $1,975 | $1.12 | 45d | 1 | 0.94mi |
| 3541 Dreamy Draw Dr Queen Creek, AZ | 4.0 | 2.5 | 1918 | $2,700 | $1.41 | 26d | 1 | 0.94mi |
| 3439 W Oil Well Rd San Tan Valley, AZ | 3.0 | 2.0 | 1595 | $2,500 | $1.57 | 45d | 1 | 0.98mi |
| 2781 W Mira Dr San Tan Valley, AZ | 3.0 | 2.0 | 1115 | $1,875 | $1.68 | 0d | 1 | 1.06mi |
| 2828 Patagonia Ct Queen Creek, AZ | 3.0 | 2.5 | 2230 | $2,500 | $1.12 | 45d | 1 | 1.07mi |
| 35032 N Barrel Rd San Tan Valley, AZ | 3.0 | 2.5 | 2213 | $3,900 | $1.76 | 0d | 1 | 1.08mi |
| 2683 W Kristina Ave San Tan Valley, AZ | 3.0 | 2.0 | 1410 | $1,850 | $1.31 | 45d | 1 | 1.08mi |
| 2460 W Tanner Ranch Rd San Tan Valley, AZ | 4.0 | 2.0 | 1520 | $1,980 | $1.30 | 4d | 1 | 1.09mi |
| 33053 N North Butte Dr San Tan Valley, AZ | 4.0 | 2.0 | 1520 | $1,985 | $1.31 | 5d | 1 | 1.20mi |
| 4165 W Monika Ln San Tan Valley, AZ | 4.0 | 3.0 | 2049 | $2,450 | $1.20 | 45d | 1 | 1.22mi |
| 2574 W Sawtooth Way San Tan Valley, AZ | 3.0 | 2.0 | 1326 | $1,995 | $1.50 | 45d | 1 | 1.23mi |
| 33082 N Cat Hills Ave San Tan Valley, AZ | 3.0 | 2.0 | 1704 | $1,795 | $1.05 | 20d | 1 | 1.24mi |
| 33082 N Cat Hills Ave San Tan Valley, AZ | 3.0 | 2.0 | 1703 | $1,695 | $1.00 | 7d | 1 | 1.24mi |
| 2306 W Kristina Ave San Tan Valley, AZ | 4.0 | 2.0 | 1464 | $1,650 | $1.13 | 26d | 1 | 1.31mi |
HOA detail
- Monthly dues
- $95 · $1,140/yr
- Likely covers
- poolgym
Listing history 23 events
-
2026-06-21days on market $367,000 Active 89 DOM
-
2026-06-18days on market $367,000 Active 86 DOM
-
2026-06-17days on market $367,000 Active 85 DOM
-
2026-06-16days on market $367,000 Active 84 DOM
-
2026-06-15days on market $367,000 Active 83 DOM
-
2026-06-13days on market $367,000 Active 81 DOM
-
2026-06-13days on market $367,000 Active 80 DOM
-
2026-06-09days on market $367,000 Active 77 DOM
-
2026-06-08days on market $367,000 Active 76 DOM
-
2026-06-07days on market $367,000 Active 75 DOM
-
2026-06-04days on market $367,000 Active 72 DOM
-
2026-06-03days on market $367,000 Active 71 DOM
-
2026-06-02days on market $367,000 Active 70 DOM
-
2026-06-01days on market $367,000 Active 69 DOM
-
2026-05-31days on market $367,000 Active 68 DOM
-
2026-03-24$367,000 Active 483-char remark
Show marketing remark (483 chars)
Fully upgraded, this popular DR Horton Sparrow model offers 4 bedrooms, 2 baths, north/ south facing with mountain views. The home features granite countertops, sleek black cabinetry, and matching black appliances. Meticulously maintained and low maintenance, it's perfect for first-time buyers, down sizers, or investors. Located in San Tan Heights with access to a pool, rec center, gym, and parks, just minutes from San Tan Mountain Regional Park for hiking and outdoor adventure.
-
2024-09-14historical $1,899
-
2024-09-08price $1,899
-
2024-09-05$1,950
-
2024-08-23historical $1,950
-
2024-08-23$1,950
-
2011-06-16soldstatus $2,226,000
-
2005-12-22soldstatus $40,000,000
ⓘ Source: listings_history table (triggers on properties + properties_extension) + one-shot
backfill from property_details.listing_events for pre-trigger history.
Tax reassessment forecast AZ · Resets to sale price
- Current annual tax
- $1,605 · $134/mo
- Projected year-2 tax
- $2,422 · $202/mo
- Expected delta
- +$817/yr (+$68/mo · 50.9%)
ⓘ Screening estimate from a state-policy table — verify with the county assessor before closing.
Climate risk First Street
- Flood 1/10 Low FEMA zone X (unshaded) · 0% chance over 30 yrs
- Wildfire 6/10 Major
- Heat 9/10 Extreme 7 d/yr ≥111°F today · 19 d/yr by 30 yrs out
- Wind 1/10 Low
- Air quality 2/10 Low 1 unhealthy d/yr today · 1 by 30 yrs out
Nearby sold comps map
Loading sold comps map…
Walkable amenities ~0.75 mi
Loading nearby amenities…
Taxation est. · year 1
- Rental income
- $23,745
- − Mortgage interest
- −$20,558
- − Property taxes
- −$1,605
- − Insurance
- −$1,835
- − Repairs & maintenance
- −$1,900
- − Management
- −$1,900
- − HOA
- −$1,140
- − Depreciation
- −$10,676
- Taxable loss
- −$15,868
- Est. tax savings @ 24.0%
- +$3,808
- After-tax cash flow
- $-5,108/yr
For passive investors: Depreciation is non-cash, so a rental often shows a tax loss while cash-flowing — sheltering income. Rental losses are passive: they offset passive income freely, and up to $25,000/yr can offset ordinary (W-2) income if you actively participate and your MAGI is under $100k (phasing out to $0 by $150k); unused losses carry forward. On sale, claimed depreciation is recaptured at up to 25%, and gains may owe capital-gains tax (a 1031 exchange can defer both). Figures are a year-1 estimate at your 24.0% rate — not tax advice; consult a CPA.
Schools (NCES district)
- District
- Florence Unified School District (4437)
- NCES district ID
- 0402920
- Math proficiency
- 16% ▼ -11.00%
- Reading proficiency
- 24% ▼ -7.00%
- Median HH income
- $54,426
- Composite
- 18.31/100
- National rank
- #8950
- State rank
- #178 of 249 in AZ
Livability — San Tan Valley
- Score
- 54/100
- State rank
- #282
- US rank
- #24192
Category grades
Schools grade is shown separately in the Schools card above.
Census & demographics
- Census place
- San Tan Valley, AZ
Population outlook (Pinal County) Hauer SSP2
- Today (2025)
- 437,574 people
- By 2030
- 446,903 · +2.1%
- By 2040
- 452,589 · +3.4%
- By 2050
- 444,126 · +1.5%
- By 2075
- 430,300 · -1.7%
- By 2100
- 393,536 · -10.1%
Not yet ingested
- Political lean
- —
- Race & ethnicity
- —
- Common origin
- —
- Civics
- —
Market trends
- HPI YoY
- ▲ 24.94%
- Current HPI
- 372.52
- Rent YoY
- —
- Metro
- —
- State GDP YoY
- ▲ 4.54%
- F500 in state
- 20
Industry mix (Fortune 500 HQ in AZ)
| Industry | F500 HQs | Revenue |
|---|---|---|
| Technology | 2 | $13B |
|
||
| Mining / Metals | 1 | $23B |
|
||
| Environmental Services | 1 | $16B |
|
||
| Metals / Steel | 1 | $14B |
|
||
| Technology Distribution | 1 | $9B |
|
||
| Homebuilding | 1 | $8B |
|
||
Price history
-99.1% since first listed8 events — show timeline
- 2026-03-24 Listed $367,000 ARMLS
- 2024-09-14 Rental Removed $1,899 RENTALBEAST
- 2024-09-08 Price Changed $1,899 RENTALBEAST
- 2024-09-05 Listed for Rent $1,950 RENTALBEAST
- 2024-08-23 Rental Removed $1,950 RENTALBEAST
- 2024-08-23 Listed for Rent $1,950 RENTALBEAST
- 2011-06-16 Sold (Public Records) $2,226,000 Public Records
- 2005-12-22 Sold (Public Records) $40,000,000 Public Records
Property tax history
+29.9%/yrLatest (2025): $1,605 · +2.1% YoY. Source: county tax records.
Cash-flow waterfall
monthlySold comps — $/sqft
last 12 mo · ≤1 miLoading sold comps…