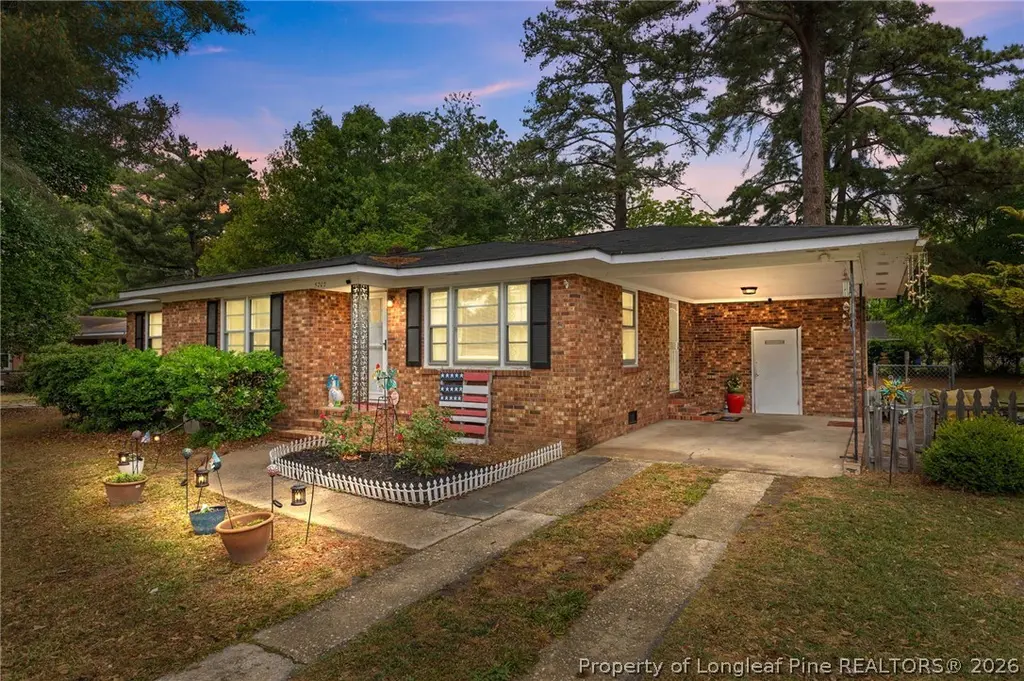
5202 Pala Verde Dr · Fayetteville, NC
Flood risk 1/10 · Minimal
- FEMA flood zone
- X (unshaded)
- Chance of flooding over 30 yrs
- 0.0%
- Est. flood insurance / yr
- $507 – $1,088
Fire risk 5/10 · Moderate
- Est. fire insurance / yr
- $906 – $1,684
Heat risk 7/10 · Major
- Hot days now (above 106°F)
- 7 days/yr
- Hot days in 30 yrs
- 16 days/yr
Wind risk 7/10 · Major
- Chance of severe wind over 30 yrs
- 78.0%
Air-quality risk 1/10 · Minimal
- Unhealthy air days now
- 0 days/yr
- Unhealthy air days in 30 yrs
- 0 days/yr
Risk factors via First Street. Map © Google.
Why this score? — see what drove the C- grade
The composite is a weighted blend of 9 inputs, each scored 0–100. Each bar is that input's sub-score; the figure is the points it added to the 100-point composite (weight × sub-score).
- Cash flow +15.5/30.0
- ARV discount +13.9/15.0
- DSCR +4.8/10.0
- 1% rule +3.9/10.0
- Livability +3.8/5.0
- Rent growth +3.3/5.0
- Schools +3.1/10.0
- Condition / age +2.5/5.0
- Appreciation +0.0/10.0
$165,000
🖨 Deal sheet (PDF) 📄 Offer letter ✓ Due diligence
Listing remarks
Tucked on a charming corner lot, this adorable all-brick ranch is full of warmth, character, and timeless appeal. With its inviting curb appeal, mature landscaping, and cozy courtyard patio, this home offers the perfect blend of vintage charm and everyday comfort. Inside, you’ll find 3 bedrooms, 1 bathroom, beautiful hardwood flooring throughout the main living spaces, and soft carpet in the bedrooms for added comfort. The cozy living room welcomes you in, while the kitchen truly serves as the heart of the home — featuring a spacious kitchen and dining combination, bar seating, built-in oven, and built-in cooktop that add just the right touch of retro personality. The home&rsquo
Key facts
- Hardwood flooring
- All brick ranch
- Mature landscaping
Tags
Property features AI
Finance
- Other: Corner, cleared, level lot on a paved public road; Subdivision: LAFAYETTE V; GPS friendly directions
Exterior
- Parking: Attached carport; Carport with 1 covered space
- Security: Smoke detectors
- Utilities: Public water; Public sewer
- Home design: Single-family residence; Residential property; Brick veneer construction
- Construction: Brick veneer construction; Crawl space foundation
- Exterior features: Courtyard; Garden; Storage; Uncovered courtyard; Porch (front porch); Covered patio; Storm doors; Partial backyard fencing; Back yard fencing; Workshop
Interior
- Kitchen: Refrigerator; Built-in electric oven; Electric cooktop; Dishwasher; Free-standing refrigerator; Electric water heater
- Bedrooms: 3 total rooms (includes bedrooms and living areas)
- Flooring: Hardwood; Tile; Vinyl; Carpet
- Bathrooms: 1 full bathroom
- Heating & cooling: Heat pump; Central air; Ceiling fans; Electric cooling
- Interior features: Ceiling fans; Eat-in kitchen; Storm windows
- Laundry & utility: Washer hookup
Neighborhood map
What this means for you Summary
Snapshot
- This is a 3-bed/1.0-bath single-family listed at $165k.
Deal economics
- At list price, monthly cash flow is $66 ($798/yr) — positive.
- The deal already cash-flows at list — no discount required.
- To meet the 1% rule (rent ≥ 1% of price), the offer needs to be $147k (11.0% below list).
- Recommended offer: $147k (11.0% below list) — sets the bar for 1% rule.
- Cap rate 6.8% vs local median 4.8% in Fayetteville — top-decile yield for the area; either an underpriced asset or a hidden risk that comps aren't pricing in. Stress-test before assuming the spread holds.
Location & tenants
- Location reads 75/100 on livability (#45 in NC, #4,031 nationally) — a middle-class / working-renter tenant base. Strengths: commute A+, cost of living A+, housing A+; Watch: crime F, employment D-.
- Cumberland County Schools (urban): math 32% / reading 41% proficiency, ranked #126 of 178 in NC (top 71%) — families likely to look elsewhere, expect single-tenant / working-renter base with shorter leases.
- Zoned schools: J W Coon Elementary (math 32% / reading 32%, grade F, #908 of 1,410 statewide, top 67%, 199 students, 98% FRL); Douglas Byrd Middle (math 13% / reading 30%, grade F, #422 of 475 statewide, top 89%, 935 students, 100% FRL); Douglas Byrd High (math 22% / reading 42%, grade F, #445 of 535 statewide, top 84%, 940 students, 99% FRL) — zoned schools average 99% FRL vs 55% district-wide (44 pts higher); higher-poverty schools than district average — tighter screening recommended.
- Market conditions: Rents rising (+3.2%/yr); 308 active listings in the ZIP; 40 comparable units currently listed for rent nearby; rentals at typical pace (median 26d on market — plan ~3-4 weeks tenant-placement turnaround); 1,125 units permitted in Cumberland County in 2024 (104 in 5+ unit buildings).
- This rent runs 30% of the median local income ($59k/yr) — at the standard rent-burdened threshold; future hikes will face affordability resistance.
Forward outlook
- Local home prices are declining (-3.0%/yr); year-one equity from $1k of loan paydown is wiped out by about $5k of value loss. Plan a longer hold.
Negotiation context
- It's been on market 39 days — a 3% lower offer ($160k) is reasonable based on typical stale-listing flexibility.
- Current owner paid $65k; list at $165k implies a 154% gain — meaningful room to come down on a strong offer.
Risks & watch-outs
- Climate carrying-cost: major wind risk, 78% chance of damaging wind over 30y; moderate wildfire risk; extreme-heat days projected 7→16/yr by 2055 (HVAC capex compounding) — expect insurance premiums to compound above CPI over the hold.
Questions for the listing agent
- It's been on market 39 days. Have you received any prior offers? Is the seller open to a 11% concession, seller financing, or rate buy-down credit?
- Built in 1963 — when were the roof, HVAC, electrical panel, plumbing, and water heater last replaced?
- Is there a deadline driving the sale (1031 exchange, divorce, estate, relocation)? That informs how much negotiation room exists.
- Crime grade is F in this area — have there been break-ins, vandalism, or insurance claims at this property in the last 3 years? What carrier currently insures it and at what premium?
- What's the average days-on-market for RENTAL listings here right now (not sales)? A rising rental-DOM trend means longer vacancies and softer asking-rent achievability than the comps imply.
- What's the recent tenant-quality profile in this submarket — average credit score on applications, eviction rate, late-payment / NSF rate, and stable-employment percentage? A property-management company in the area should have these aggregated.
- How much new for-sale + rental construction is in the pipeline within 1–3 miles? Heavy new supply typically softens prices + rents 12–24 months out; constrained supply supports both.
Investment metrics
- 1% rule
- 0.89% ✗
- Cap rate
- 6.78%
- Cash-on-cash
- 1.73%
- DSCR
- 1.08
- GRM
- 9.4
CMA / ARV
- ARV (on-the-fly)
- $192,432
- Comps found
- 12
Show comp detail 12 sales within ~0.75 mi
| Address | Dist | Beds/Ba | Sqft | Sold | Price | $/sf | Match |
|---|---|---|---|---|---|---|---|
| 2012 Ironwood Dr | 0.26mi | 3/1.0 | 1,186 (-6%) | 0mo | $179,900 | $152 | 77 |
| 5219 Redwood Dr | 0.19mi | 3/1.0 | 1,124 (-11%) | 2mo | $187,000 | $166 | 71 |
| 821 Sandalwood Dr | 0.57mi | 3/1.0 | 1,204 (-5%) | 1mo | $140,000 | $116 | 64 |
| 5245 Butternut Dr | 0.50mi | 4/2.0 (+1) | 1,326 (+5%) | 0mo | $188,000 | $142 | 59 |
| 5709 Charbonneau Ct | 0.62mi | 3/2.0 | 1,325 (+5%) | 2mo | $200,000 | $151 | 57 |
| 1005 Juniper Dr | 0.46mi | 3/1.0 | 1,107 (-13%) | 1mo | $169,000 | $153 | 57 |
| 819 Sandalwood Dr | 0.58mi | 3/1.0 | 1,156 (-9%) | 2mo | $176,000 | $152 | 56 |
| 5717 Charbonneau Ct | 0.64mi | 3/2.0 | 1,180 (-7%) | 1mo | $199,900 | $169 | 54 |
| 1810 Ashton Rd | 0.74mi | 3/1.5 | 1,348 (+6%) | 2mo | $204,900 | $152 | 51 |
| 1104 Odom Dr | 0.72mi | 3/1.0 | 1,143 (-10%) | 2mo | $170,000 | $149 | 48 |
| 1707 Camelot Dr | 0.64mi | 3/2.0 | 1,116 (-12%) | 2mo | $204,000 | $183 | 45 |
| 1854 Camelot Dr | 0.73mi | 3/2.0 | 1,116 (-12%) | 2mo | $205,000 | $184 | 41 |
Match score weights: distance 35% · size 25% · config 20% · recency 20%. Top-matched comps best support the ARV.
Projected returns pro-forma
-3.0% appreciation · 3.17% rent growth · sell at horizon
- IRR
- -13.4%
- Equity multiple
- 0.52×
- Total profit
- $-22,257
- Equity at exit
- $24,602
- IRR
- -4.2%
- Equity multiple
- 0.72×
- Total profit
- $-12,918
- Equity at exit
- $14,266
Cash invested: $46,200 (down + closing). Projections, not guarantees.
Landlord ↔ Tenant lean methodology
- Overall (STATE)
- 85 Strongly Landlord-Friendly
- State North Carolina
- 85 Strongly Landlord-Friendly · R+3
- County
- — inherits STATE
- City
- — inherits STATE
ZIP-level market 28304
- Home prices YoY
- -21.7%
- Rents YoY
- 3.2%
- Active inventory
- 308
- Price-to-rent
- 9.4×
Monthly cashflow live
- Estimated rent
- $1,469 high interval (Pro) →
- Mortgage (P&I)
- −$865
- Tax from tax record
- −$160 /mo · $1,920/yr
- Insurance
- −$69
- HOA
- −$0
- Vacancy / Maint / Mgmt
- −$308
- Net cashflow
- $66
Break-even live
Sensitivity live
| Price | -10% $160 | -5% $113 | +0% $66 | +5% $20 | +10% $-27 |
|---|---|---|---|---|---|
| Rent | -10% $-50 | -5% $8 | +0% $66 | +5% $125 | +10% $183 |
| Rate | -1.0pp $150 | -0.5pp $108 | base $66 | +0.5pp $24 | +1.0pp $-20 |
UW: 25.0% down · 7.5% · 30yr · 1.5% tax · 5.0% vac · 8.0% maint · 8.0% mgmt
Financing live
Cash to close
- Down payment
- $41,250
- Closing costs
- $4,950
- Reserves months
- —
- Total cash needed
- —
Loan-product check · same deal, 3 products live
Conventional
25% down · 7.5% · 30yr
- Down + closing
- —
- Monthly P&I
- —
- Monthly cashflow
- —
- DSCR
- —
- Eligible?
- —
Personal DTI + credit; lowest rate.
DSCR
20% down · 8.5% · 30yr
- Down + closing
- —
- Monthly P&I
- —
- Monthly cashflow
- —
- DSCR
- —
- Eligible?
- —
No personal income docs; deal must DSCR.
Hard money
10% down · 12.0% · 12mo
- Down + closing
- —
- Monthly P&I
- —
- Monthly cashflow
- —
- DSCR
- —
- Eligible?
- —
Short-term bridge; refi at stabilization.
Rent comps 40 comps
| Address | Beds | Baths | Sqft | Rent | $/sqft | DOM | Units | Dist |
|---|---|---|---|---|---|---|---|---|
| 5632 Birch Rd Fayetteville, NC | 3.0 | 1.0 | 1228 | $1,250 | $1.02 | 25d | 1 | 0.29mi |
| 1819 Cawdor Dr Fayetteville, NC | 3.0 | 2.5 | 1572 | $1,600 | $1.02 | 16d | 1 | 0.44mi |
| 909 Sandalwood Dr Fayetteville, NC | 3.0 | 1.0 | 1346 | $1,595 | $1.18 | 25d | 1 | 0.54mi |
| 821 Sandalwood Dr Fayetteville, NC | 3.0 | 1.0 | 1204 | $1,200 | $1.00 | 16d | 1 | 0.59mi |
| 1815 Paisley Ave Fayetteville, NC | 3.0 | 2.0 | 1508 | $1,595 | $1.06 | 25d | 1 | 0.62mi |
| 5721 Randleman St Fayetteville, NC | 3.0 | 2.0 | 1050 | $1,575 | $1.50 | 25d | 1 | 0.66mi |
| 5744 Randleman St Fayetteville, NC | 3.0 | 2.0 | 1171 | $1,395 | $1.19 | 25d | 1 | 0.71mi |
| 5151 Queensdale Dr Fayetteville, NC | 3.0 | 2.0 | 1107 | $1,295 | $1.17 | 16d | 1 | 0.73mi |
| 5151 Queensdale Dr Fayetteville, NC | 3.0 | 2.0 | 1107 | $1,295 | $1.17 | 25d | 1 | 0.73mi |
| 1583 Winnabow Dr Fayetteville, NC | 3.0 | 2.5 | 1550 | $2,100 | $1.35 | 25d | 1 | 0.77mi |
| 1401 Carnsmore Dr Fayetteville, NC | 3.0 | 2.5 | 1450 | $1,575 | $1.09 | 25d | 1 | 0.78mi |
| 4630 Canterbury Rd Fayetteville, NC | 3.0 | 2.0 | 1250 | $1,350 | $1.08 | 25d | 1 | 0.79mi |
| 5706 McDougal Dr Fayetteville, NC | 3.0 | 2.0 | 1594 | $1,650 | $1.04 | 25d | 1 | 0.79mi |
| 4935 Walnut Dr Fayetteville, NC | 3.0 | 1.5 | 1024 | $1,200 | $1.17 | 16d | 1 | 0.87mi |
| 5200 Cypress Rd Fayetteville, NC | 3.0 | 1.0 | 1210 | $1,250 | $1.03 | 25d | 1 | 0.90mi |
| 4909 Walnut Dr Fayetteville, NC | 3.0 | 2.0 | 1188 | $1,500 | $1.26 | 25d | 1 | 0.91mi |
| 5842 Aftonshire Dr Fayetteville, NC | 2.0 | 1.5 | 1010 | $1,000 | $0.99 | 25d | 1 | 0.94mi |
| 5744 Aftonshire Dr Fayetteville, NC | 2.0 | 1.5 | 945 | $999 | $1.06 | 25d | 1 | 0.96mi |
| 1413 Tangora Ln Fayetteville, NC | 2.0 | 1.5 | 945 | $979 | $1.04 | 16d | 1 | 0.97mi |
| 5032 Shimmer Dr Fayetteville, NC | 4.0 | 2.0 | 1473 | $1,750 | $1.19 | 25d | 1 | 0.97mi |
| 5032 Shimmer Dr Fayetteville, NC | 4.0 | 2.0 | 1473 | $1,700 | $1.15 | 16d | 1 | 0.97mi |
| 5864 Aftonshire Dr Fayetteville, NC | 2.0 | 2.0 | 1100 | $1,100 | $1.00 | 25d | 1 | 0.99mi |
| 1406 Tangora Ln Fayetteville, NC | 2.0 | 2.5 | 1192 | $1,015 | $0.85 | 25d | 1 | 1.00mi |
| 5713 Aftonshire Dr Fayetteville, NC | 2.0 | 2.5 | 1025 | $995 | $0.97 | 16d | 1 | 1.00mi |
| 5876 Aftonshire Dr Fayetteville, NC | 2.0 | 1.5 | 1024 | $1,015 | $0.99 | 25d | 1 | 1.01mi |
| 1715 Arrow Ridge Way Fayetteville, NC | 3.0 | 2.0 | 1220 | $1,550 | $1.27 | 16d | 1 | 1.02mi |
| 5812 Shenandoah Dr Fayetteville, NC | 4.0 | 2.0 | 1800 | $1,599 | $0.89 | 25d | 1 | 1.02mi |
| 1927 Shiloh Dr Fayetteville, NC | 3.0 | 1.5 | 1606 | $1,600 | $1.00 | 16d | 1 | 1.05mi |
| 1216 Weeping Willow Way Unit 229 Fayetteville, NC | 3.0 | 2.0 | 960 | $969 | $1.01 | 16d | 1 | 1.08mi |
| 1701 Carter Baron Pl Unit 211 Fayetteville, NC | 3.0 | 2.0 | 1295 | $1,700 | $1.31 | 25d | 1 | 1.09mi |
| 4101 Coventry Rd Fayetteville, NC | 3.0 | 1.0 | 1132 | $1,150 | $1.02 | 16d | 1 | 1.09mi |
| 1800 Balmoral Dr Fayetteville, NC | 2.0 | 2.0 | 1328 | $1,250 | $0.94 | 25d | 1 | 1.10mi |
| 1761 Renwick Dr #204 Fayetteville, NC | 2.0 | 2.0 | 1331 | $1,300 | $0.98 | 16d | 1 | 1.12mi |
| 1811 Balmoral Dr #202 Fayetteville, NC | 2.0 | 2.0 | 1250 | $1,275 | $1.02 | 16d | 1 | 1.14mi |
| 4810 Alamance Rd Fayetteville, NC | 1.0–2.0 | 1.0–2.0 | 827 | $1,200 | $1.45 | 25d | 1 | 1.20mi |
| 3001 Stone Carriage Cir Fayetteville, NC | 1.0–3.0 | 1.0–2.0 | 1098 | $1,700 | $1.55 | 16d | 12 | 1.24mi |
| 2640 Latrobe Ave Fayetteville, NC | 1.0–3.0 | 1.0–2.0 | 1079 | $1,815 | $1.68 | 16d | 30 | 1.26mi |
| 5595 Quietwood Pl Fayetteville, NC | 3.0 | 2.0 | 1288 | $1,395 | $1.08 | 25d | 1 | 1.27mi |
| 1879 Frankie Ave Fayetteville, NC | 3.0 | 2.0 | 1100 | $1,375 | $1.25 | 25d | 1 | 1.27mi |
| 2524 Penny Dr Fayetteville, NC | 3.0 | 2.0 | 1330 | $1,400 | $1.05 | 25d | 1 | 1.31mi |
Listing history 20 events
-
2026-06-21days on market $165,000 Active 39 DOM
-
2026-06-18days on market $165,000 Active 36 DOM
-
2026-06-17days on market $165,000 Active 35 DOM
-
2026-06-16days on market $165,000 Active 34 DOM
-
2026-06-15days on market $165,000 Active 33 DOM
-
2026-06-14days on market $165,000 Active 31 DOM
-
2026-06-13days on market $165,000 Active 30 DOM
-
2026-06-10days on market $165,000 Active 28 DOM
-
2026-06-09days on market $165,000 Active 27 DOM
-
2026-06-08days on market $165,000 Active 26 DOM
-
2026-06-07days on market $165,000 Active 25 DOM
-
2026-06-03days on market $165,000 Active 21 DOM
-
2026-06-02days on market $165,000 Active 20 DOM
-
2026-06-01days on market $165,000 Active 19 DOM
-
2026-05-31days on market $165,000 Active 18 DOM
-
2026-05-30status $165,000 Active 17 DOM
-
2026-05-08$165,000 Active
-
2012-01-31soldstatus $65,000
-
1996-08-01soldstatus $67,000
-
1992-06-01soldstatus $54,000
ⓘ Source: listings_history table (triggers on properties + properties_extension) + one-shot
backfill from property_details.listing_events for pre-trigger history.
Tax reassessment forecast NC · Resets to sale price
- Current annual tax
- $1,920 · $160/mo
- Projected year-2 tax
- $1,920 · $160/mo
- Expected delta
- $0/yr ($0/mo · 0.0%)
ⓘ Screening estimate from a state-policy table — verify with the county assessor before closing.
Climate risk First Street
- Flood 1/10 Low FEMA zone X (unshaded) · 0% chance over 30 yrs
- Wildfire 5/10 Major
- Heat 7/10 Severe 7 d/yr ≥106°F today · 16 d/yr by 30 yrs out
- Wind 7/10 Severe 78% chance of damaging wind over 30 yrs
- Air quality 1/10 Low 0 unhealthy d/yr today · 0 by 30 yrs out
Nearby sold comps map
Loading sold comps map…
Walkable amenities ~0.75 mi
Loading nearby amenities…
Taxation est. · year 1
- Rental income
- $17,628
- − Mortgage interest
- −$9,243
- − Property taxes
- −$1,920
- − Insurance
- −$825
- − Repairs & maintenance
- −$1,410
- − Management
- −$1,410
- − Depreciation
- −$4,800
- Taxable loss
- −$1,980
- Est. tax savings @ 24.0%
- +$475
- After-tax cash flow
- $1,273/yr
For passive investors: Depreciation is non-cash, so a rental often shows a tax loss while cash-flowing — sheltering income. Rental losses are passive: they offset passive income freely, and up to $25,000/yr can offset ordinary (W-2) income if you actively participate and your MAGI is under $100k (phasing out to $0 by $150k); unused losses carry forward. On sale, claimed depreciation is recaptured at up to 25%, and gains may owe capital-gains tax (a 1031 exchange can defer both). Figures are a year-1 estimate at your 24.0% rate — not tax advice; consult a CPA.
Schools (NCES district)
- District
- Cumberland County Schools
- NCES district ID
- 3700011
- Math proficiency
- 32% ▼ -2.00%
- Reading proficiency
- 41% ▼ -1.00%
- Median HH income
- $44,168
- Composite
- 31.0/100
- National rank
- #6096
- State rank
- #126 of 178 in NC
Livability — Fayetteville
- Score
- 75/100
- State rank
- #45
- US rank
- #4031
Category grades
Schools grade is shown separately in the Schools card above.
Census & demographics
- Census place
- Fayetteville, NC
- County
- Cumberland County · 265,314 people
- City population
- 226,118
- Metro
- Fayetteville, NC
- Population (ZIP)
- 37,140
- Household income
- $58,563
- Rent vs Own
- Severe rent burden
- 1667.0
Population outlook (Cumberland County) Hauer SSP2
- Today (2025)
- 330,855 people
- By 2030
- 333,523 · +0.8%
- By 2040
- 335,583 · +1.4%
- By 2050
- 335,325 · +1.4%
- By 2075
- 342,853 · +3.6%
- By 2100
- 340,698 · +3.0%
Race, ethnicity, and origin ACS 2023
- Neighborhood character
- Highly diverse neighborhood (Simpson 0.70)
- Race & ethnicity
- Black 39% White 36% Hispanic / Latino 14% Two or more races 12% Asian 3% Native American 1%
- Hispanic origin (detail)
- Mexican 5% Puerto Rican 5%
- Common ancestry
- Slovak 2% Italian 1% Serbian 1%
- Foreign-born
- 8% · Canada, South Korea, Vietnam
- Languages at home
- 87% English-only · Spanish 9% Tagalog/Filipino 1% French/Haitian/Cajun 1%
Political lean MEDSL · Cumberland
- 2024 margin
- D (+13.4) · D 56.1% · R 42.7% · Other 1.2%
- 2008→2024 swing
- -4.3pp toward R · 2008: 17.7pp · 2024: 13.4pp
- All cycles
- 2024: D+13.4 2020: D+16.6 2016: D+16.0 2012: D+19.7 2008: D+17.7
Not yet ingested
- Civics
- —
Market trends
- HPI YoY
- ▼ -59.90%
- Current HPI
- 215.927
- Rent YoY
- ▲ 3.17%
- Metro
- Fayetteville, NC
- State GDP YoY
- ▲ 3.28%
- F500 in state
- 26
Industry mix (Fortune 500 HQ in NC)
| Industry | F500 HQs | Revenue |
|---|---|---|
| Financial Services | 2 | $213B |
|
||
| Retail | 2 | $95B |
|
||
| Industrial Conglomerate | 1 | $38B |
|
||
| Metals / Steel | 1 | $35B |
|
||
| Utilities | 1 | $30B |
|
||
| Industrial Machinery | 1 | $19B |
|
||
Price history
+205.6% since first listed4 events — show timeline
- 2026-05-08 Listed $165,000 LPRMLS
- 2012-01-31 Sold (Public Records) $65,000 Public Records
- 1996-08-01 Sold (Public Records) $67,000 Public Records
- 1992-06-01 Sold (Public Records) $54,000 Public Records
Property tax history
+5.1%/yrLatest (2025): $1,920 · +35.0% YoY. Source: county tax records.
Cash-flow waterfall
monthlySold comps — $/sqft
last 12 mo · ≤1 miLoading sold comps…