 13-Plex
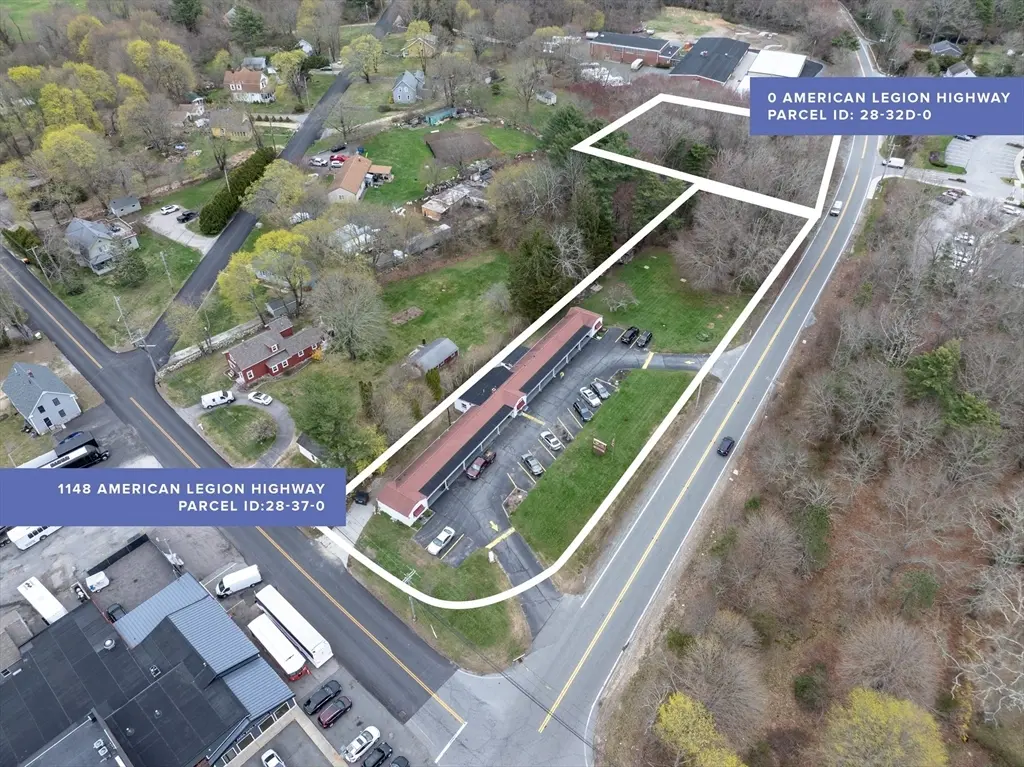
1148 American Legion Hwy · Westport, MA
Flood risk 1/10 · Minimal
- FEMA flood zone
- X (unshaded)
- Chance of flooding over 30 yrs
- 0.0%
- Est. flood insurance / yr
- $507 – $1,088
Fire risk 1/10 · Minimal
- Est. fire insurance / yr
- $915 – $1,699
Heat risk 5/10 · Moderate
- Hot days now (above 96°F)
- 7 days/yr
- Hot days in 30 yrs
- 15 days/yr
Wind risk 8/10 · Major
- Chance of severe wind over 30 yrs
- 80.0%
Air-quality risk 2/10 · Minimal
- Unhealthy air days now
- 1 days/yr
- Unhealthy air days in 30 yrs
- 2 days/yr
Risk factors via First Street. Map © Google.
Why this score? — see what drove the C+ grade
The composite is a weighted blend of 9 inputs, each scored 0–100. Each bar is that input's sub-score; the figure is the points it added to the 100-point composite (weight × sub-score).
- Cash flow +27.5/30.0
- DSCR +9.7/10.0
- ARV discount +7.5/15.0
- 1% rule +6.3/10.0
- Schools +4.0/10.0
- Rent growth +2.5/5.0
- Livability +2.5/5.0
- Condition / age +2.5/5.0
- Appreciation +0.0/10.0
$1,595,000
🖨 Deal sheet 📄 Offer letter ✓ Due diligence
Multi-family units
County records classify this as Multi-Family (5+ Unit). Listing-text estimate: 13 units. confirmed
5+ unit building — per-unit beds/baths from public records are typically unavailable; the breakdown below (if shown) is an estimate from the listing text.
Listing remarks MLS
STRONG INCOME POTENTIAL. Cash-flow positive 13-unit multi-family investment opportunity, or possible commercial re-development opportunity (property is located in Business zoning district), located in the desirable coastal town of Westport, MA. 1148 American Legion Highway is known as “177 Studio Apartments”, a one-level 13-unit studio apartment building. The 1-acre property has significant exposure along well-traveled MA State Rte. 177, with close proximity to Interstate 195 and U.S. Rte. 6. The multi-family building situated on a 1-acre parcel (28-37-0) can also be sold with an adjacent .75-acre vacant parcel (28-32D-0). Studio apartments each have own full bath (w/ shower), fridge & kitchen sink. See floor plan. 177 Studio Apartments has been owned by the same owner for over 50 years and has a history of long-term, stable at-will tenancy. Natural gas. Septic & well. Consult pages 30-46 in Westport zoning bylaws attached to listing.
Key facts
- Septic
- Well
- Full bath
Tags
Neighborhood map
What this means for you Summary
Snapshot
- This is a 13 × 1-bed/1-bath units multifamily listed at $1.59M.
Deal economics
- At list price, monthly cash flow is $5k ($57k/yr) — positive. Per door: $364/mo.
- The deal already cash-flows at list — no discount required.
- Meets the 1% rule at list price ($18k rent vs $1.59M).
- Recommended offer: $1.55M (3.0% below list) — sets the bar for market timing.
Location & tenants
- Location reads: area grade C — affects rentability + tenant quality, not the cash-flow math above.
- Westport (rural): math 39% / reading 48% proficiency, ranked #165 of 302 in MA (top 55%) — families likely to look elsewhere, expect single-tenant / working-renter base with shorter leases; only 19% free/reduced lunch — higher-income household profile.
- Market conditions: 49 active listings in the ZIP; 760 units permitted in Bristol County in 2024 (142 in 5+ unit buildings).
Forward outlook
- Local home prices are declining (-3.0%/yr); year-one equity from $11k of loan paydown is wiped out by about $48k of value loss. Plan a longer hold.
- Bristol County population projected to shrink 3% by 2050 — rents likely to lag national; underwrite the cash flow, not the appreciation.
- At projected returns (-3.0% appreciation + 3.0% rent growth), your $447k cash investment doubles in ~9 years — after that, you're playing with house money.
Negotiation context
- It's been on market 40 days — a 3% lower offer ($1.55M) is reasonable based on typical stale-listing flexibility.
Risks & watch-outs
- Watch-outs: built in 1948 — expect roof / HVAC / electrical / plumbing capex.
- Climate carrying-cost: severe wind risk, 80% chance of damaging wind over 30y; extreme-heat days projected 7→15/yr by 2055 (HVAC capex compounding) — expect insurance premiums to compound above CPI over the hold.
Questions for the listing agent
- It's been on market 40 days. Have you received any prior offers? Is the seller open to a 3% concession, seller financing, or rate buy-down credit?
- Can we see the unit-by-unit rent roll, current vacancy, and any below-market leases? What's the average tenancy length?
- What capital expenditures (roof, boiler, parking lot, exteriors) have been made in the last 5 years, and what's planned in the next 2?
- Built in 1948 — when were the roof, HVAC, electrical panel, plumbing, and water heater last replaced?
- Is there a deadline driving the sale (1031 exchange, divorce, estate, relocation)? That informs how much negotiation room exists.
- What's the average days-on-market for RENTAL listings here right now (not sales)? A rising rental-DOM trend means longer vacancies and softer asking-rent achievability than the comps imply.
- What's the recent tenant-quality profile in this submarket — average credit score on applications, eviction rate, late-payment / NSF rate, and stable-employment percentage? A property-management company in the area should have these aggregated.
- How much new apartment / multifamily construction is in the pipeline within 1–3 miles? Heavy new supply (>2% of stock underway) typically softens rents 12–24 months out; light construction supports rent growth.
Investment metrics
- 1% rule
- 1.13% ✓
- Cap rate
- 9.85%
- Cash-on-cash
- 12.71%
- DSCR
- 1.57
- GRM
- 7.4
CMA / ARV
- ARV (median comp)
- $616,960
- List price
- $1,595,000
- Delta
- 158.53%
- Verdict
- OVERPRICED
- Comps
- 2 within 2.0 mi
Projected returns pro-forma
-3.0% appreciation · 3.0% rent growth · sell at horizon
- IRR
- 2.5%
- Equity multiple
- 1.09×
- Total profit
- $42,161
- Equity at exit
- $237,820
- IRR
- 12.0%
- Equity multiple
- 1.94×
- Total profit
- $422,035
- Equity at exit
- $137,906
Cash invested: $446,600 (down + closing). Projections, not guarantees.
Landlord ↔ Tenant lean methodology
- Overall (STATE)
- 20 Strongly Tenant-Friendly
- State Massachusetts
- 20 Strongly Tenant-Friendly · D+15
- County
- — inherits STATE
- City
- — inherits STATE
ZIP-level market 02790
- Home prices YoY
- -32.7%
- Active inventory
- 49
- Price-to-rent
- 95.7×
Monthly cashflow live
- Estimated rent
- $18,062 medium interval (Pro) →
- Mortgage (P&I)
- −$8,364
- Tax from tax record
- −$510 /mo · $6,120/yr
- Insurance
- −$665
- HOA
- −$0
- Vacancy / Maint / Mgmt
- −$3,793
- Net cashflow
- $4,730
Break-even live
13-unit breakdown (identical units grouped — click to expand)
| Units | Beds | Baths | Est. rent |
|---|---|---|---|
| 13× units | 1 | 1 | $18,057 |
| #1 | 1 | 1 | $1,389 |
| #2 | 1 | 1 | $1,389 |
| #3 | 1 | 1 | $1,389 |
| #4 | 1 | 1 | $1,389 |
| #5 | 1 | 1 | $1,389 |
| #6 | 1 | 1 | $1,389 |
| #7 | 1 | 1 | $1,389 |
| #8 | 1 | 1 | $1,389 |
| #9 | 1 | 1 | $1,389 |
| #10 | 1 | 1 | $1,389 |
| #11 | 1 | 1 | $1,389 |
| #12 | 1 | 1 | $1,389 |
| #13 | 1 | 1 | $1,389 |
| Total (13 units) | $18,062 | ||
UW: 25.0% down · 7.5% · 30yr · 1.5% tax · 5.0% vac · 8.0% maint · 8.0% mgmt
Financing live
Cash to close
- Down payment
- $398,750
- Closing costs
- $47,850
- Reserves months
- —
- Total cash needed
- —
Loan-product check · same deal, 3 products live
Conventional
25% down · 7.5% · 30yr
- Down + closing
- —
- Monthly P&I
- —
- Monthly cashflow
- —
- DSCR
- —
- Eligible?
- —
Personal DTI + credit; lowest rate.
DSCR
20% down · 8.5% · 30yr
- Down + closing
- —
- Monthly P&I
- —
- Monthly cashflow
- —
- DSCR
- —
- Eligible?
- —
No personal income docs; deal must DSCR.
Hard money
10% down · 12.0% · 12mo
- Down + closing
- —
- Monthly P&I
- —
- Monthly cashflow
- —
- DSCR
- —
- Eligible?
- —
Short-term bridge; refi at stabilization.
Listing history 14 events
-
2026-06-18days on market $1,595,000 Active 40 DOM
-
2026-06-17days on market $1,595,000 Active 39 DOM
-
2026-06-16days on market $1,595,000 Active 38 DOM
-
2026-06-15days on market $1,595,000 Active 37 DOM
-
2026-06-13days on market $1,595,000 Active 35 DOM
-
2026-06-09days on market $1,595,000 Active 31 DOM
-
2026-06-08days on market $1,595,000 Active 30 DOM
-
2026-06-07days on market $1,595,000 Active 29 DOM
-
2026-06-05days on market $1,595,000 Active 26 DOM
-
2026-06-03days on market $1,595,000 Active 25 DOM
-
2026-06-02days on market $1,595,000 Active 24 DOM
-
2026-06-01days on market $1,595,000 Active 23 DOM
-
2026-05-31days on market $1,595,000 Active 22 DOM
-
2026-05-09$1,595,000 New 968-char remark
Show marketing remark (968 chars)
STRONG INCOME POTENTIAL. Cash-flow positive 13-unit multi-family investment opportunity, or possible commercial re-development opportunity (property is located in Business zoning district), located in the desirable coastal town of Westport, MA. 1148 American Legion Highway is known as “177 Studio Apartments”, a one-level 13-unit studio apartment building. The 1-acre property has significant exposure along well-traveled MA State Rte. 177, with close proximity to Interstate 195 and U.S. Rte. 6. The multi-family building situated on a 1-acre parcel (28-37-0) can also be sold with an adjacent .75-acre vacant parcel (28-32D-0). Studio apartments each have own full bath (w/ shower), fridge & kitchen sink. See floor plan. 177 Studio Apartments has been owned by the same owner for over 50 years and has a history of long-term, stable at-will tenancy. Natural gas. Septic & well. Consult pages 30-46 in Westport zoning bylaws attached to listing.
ⓘ Source: listings_history table (triggers on properties + properties_extension) + one-shot
backfill from property_details.listing_events for pre-trigger history.
Tax reassessment forecast MA · Partial reset (capped growth)
- Current annual tax
- $6,120 · $510/mo
- Projected year-2 tax
- $12,869 · $1,072/mo
- Expected delta
- +$6,749/yr (+$562/mo · 110.3%)
ⓘ Screening estimate from a state-policy table — verify with the county assessor before closing.
Climate risk First Street
- Flood 1/10 Low FEMA zone X (unshaded) · 0% chance over 30 yrs
- Wildfire 1/10 Low
- Heat 5/10 Major 7 d/yr ≥96°F today · 15 d/yr by 30 yrs out
- Wind 8/10 Severe 80% chance of damaging wind over 30 yrs
- Air quality 2/10 Low 1 unhealthy d/yr today · 2 by 30 yrs out
Nearby sold comps map
Loading sold comps map…
Walkable amenities ~0.75 mi
Loading nearby amenities…
Taxation est. · year 1
- Rental income
- $216,744
- − Mortgage interest
- −$89,345
- − Property taxes
- −$6,120
- − Insurance
- −$7,975
- − Repairs & maintenance
- −$17,340
- − Management
- −$17,340
- − Depreciation
- −$46,400
- Taxable income
- $32,225
- Est. tax owed @ 24.0%
- −$7,734
- After-tax cash flow
- $49,026/yr
For passive investors: Depreciation is non-cash, so a rental often shows a tax loss while cash-flowing — sheltering income. Rental losses are passive: they offset passive income freely, and up to $25,000/yr can offset ordinary (W-2) income if you actively participate and your MAGI is under $100k (phasing out to $0 by $150k); unused losses carry forward. On sale, claimed depreciation is recaptured at up to 25%, and gains may owe capital-gains tax (a 1031 exchange can defer both). Figures are a year-1 estimate at your 24.0% rate — not tax advice; consult a CPA.
Schools (NCES district)
- District
- Westport
- NCES district ID
- 2512780
- Math proficiency
- 39% ▼ -13.00%
- Reading proficiency
- 48% ▼ -7.00%
- Median HH income
- $73,996
- Composite
- 39.66/100
- National rank
- #3913
- State rank
- #165 of 302 in MA
Livability — Westport
No livability data for this city. (Only ~50 U.S. cities are tracked.)
Census & demographics
- Census place
- North Westport, MA
- Population (ZIP)
- 16,725
Population outlook (Bristol County) Hauer SSP2
- Today (2025)
- 570,212 people
- By 2030
- 571,181 · +0.2%
- By 2040
- 565,389 · -0.8%
- By 2050
- 552,141 · -3.2%
- By 2075
- 520,923 · -8.6%
- By 2100
- 474,363 · -16.8%
Race, ethnicity, and origin ACS 2023
- Neighborhood character
- Predominantly White (92%)
- Race & ethnicity
- White 92% Two or more races 3% Hispanic / Latino 3%
- Common ancestry
- Russian 36% Lithuanian 15% Romanian 4%
- Foreign-born
- 10% · Canada, China
- Languages at home
- 85% English-only · Other Indo-European 13% Spanish 1% French/Haitian/Cajun 1%
Political lean MEDSL · Bristol
- 2024 margin
- Toss-up / Even · D 49.8% · R 48.5% · Other 1.8%
- 2008→2024 swing
- -21.9pp toward R · 2008: 23.2pp · 2024: 1.3pp
- All cycles
- 2024: D+1.3 2020: D+12.0 2016: D+9.3 2012: D+20.5 2008: D+23.2
Not yet ingested
- Civics
- —
Market trends
- HPI YoY
- ▼ -150.20%
- Current HPI
- 309.6882
- Rent YoY
- —
- Metro
- —
- State GDP YoY
- ▲ 2.28%
- F500 in state
- 38
Industry mix (Fortune 500 HQ in MA)
| Industry | F500 HQs | Revenue |
|---|---|---|
| Technology | 3 | $17B |
|
||
| Insurance | 2 | $84B |
|
||
| Retail | 2 | $76B |
|
||
| Life Sciences | 1 | $43B |
|
||
| Energy Technology | 1 | $31B |
|
||
| Aerospace / Defense | 1 | $18B |
|
||
Price history
1 event — show timeline
- 2026-05-09 Listed $1,595,000 MLS PIN
Property tax history
+5.1%/yrLatest (2023): $6,120 · +1.3% YoY. Source: county tax records.
Cash-flow waterfall
monthlySold comps — $/sqft
last 12 mo · ≤1 miLoading sold comps…